ElliottWave Circles
- Indicators
- Version: 1.14
- Updated: 6 May 2026
- Activations: 5

ElliottWave Circles: Master Market Momentum with Absolute Clarity
Unlock the true power of market cycles with ElliottWave Circles—a streamlined, visually striking momentum indicator designed to cut through the noise and deliver crystal-clear trading signals. Built upon the proven logic of the Elliott Wave Oscillator (EWO), this tool transforms complex market data into a simple, highly intuitive color-coded system.
Whether you are a scalper, day trader, or swing trader, ElliottWave Circles removes second-guessing from your strategy by visually mapping the exact moment momentum shifts in your favor.
🔥 Core Features That Set It Apart
- Intelligent Asset Profiling (Auto-Detect): Not all markets move the same way. ElliottWave Circles features a built-in smart detection system that automatically identifies the asset you are trading (Forex, Indices, or Cryptocurrencies) and instantly applies the most mathematically optimized moving average periods for that specific market. No more manual tweaking needed!
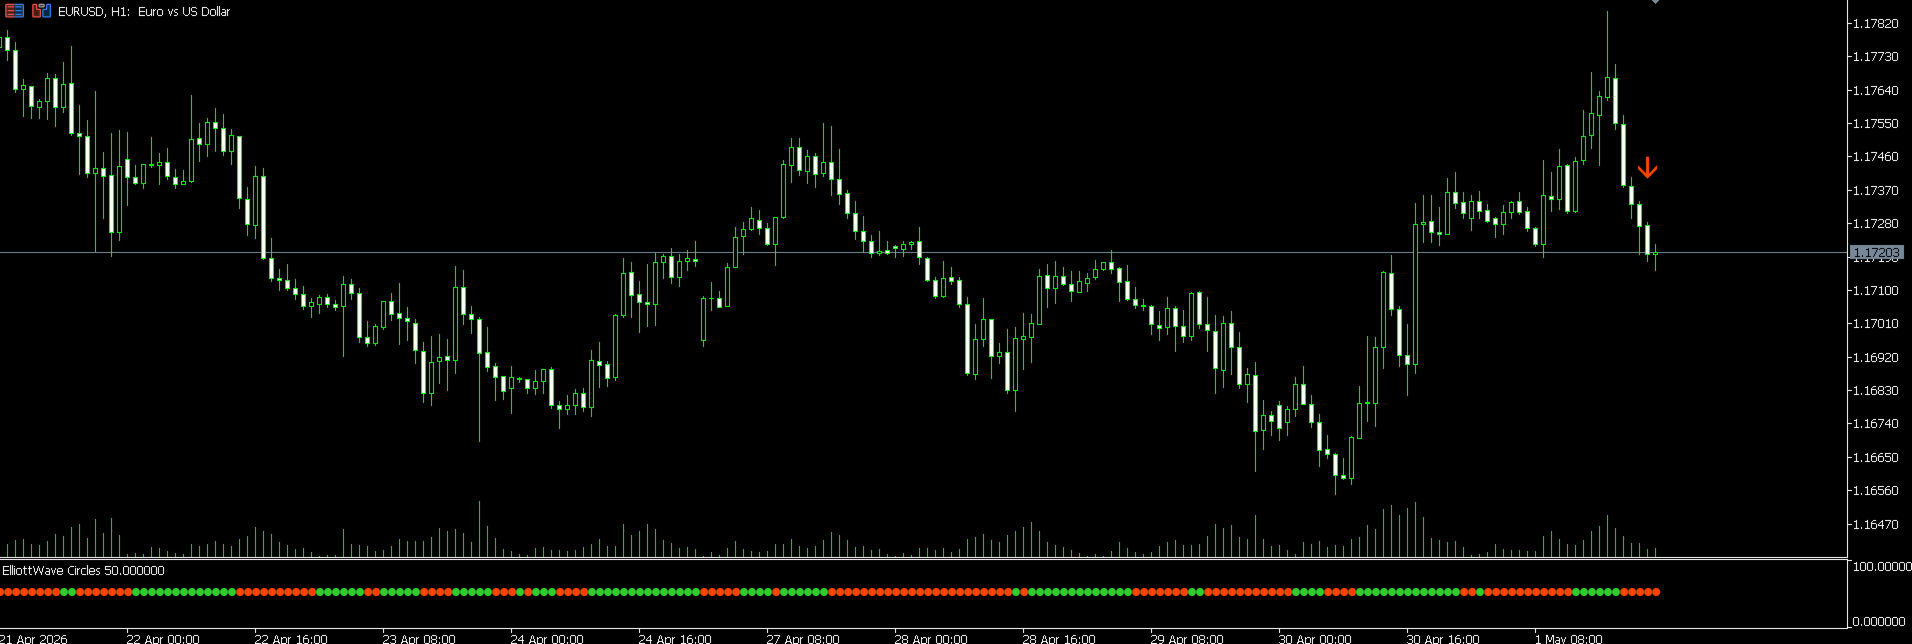
- Zero-Clutter Visuals: Say goodbye to messy, tangled lines. This indicator displays a sleek row of colored circles in its sub-window:
- 🟢 Vibrant Green: Momentum is accelerating upward.
- 🔴 Fierce Red: Momentum is accelerating downward.
- Precision Chart Arrows: Never miss an entry. When the indicator detects a strong, sustained momentum shift (e.g., 3 consecutive circles of the same color), it automatically prints a sleek, highly visible Buy or Sell arrow directly on your main price chart.
- Dynamic History Mode: Choose how you view your chart. Keep a full historical record of all past signals to backtest your strategy visually, or switch to "Clean Mode" to only display the single most recent, actionable signal on your screen.
- Highly Customizable: Prefer your own settings? Override the auto-detection and dial in your exact Fast and Slow SMA periods using the Custom Profile to perfectly match your unique trading style.
💡 How It Works
The indicator tracks the pure momentum of the market by comparing short-term and long-term price action (Median Price SMAs).
- When the oscillator is rising, it paints a Green circle, signaling bullish pressure.
- When the oscillator falls, it paints a Red circle, signaling bearish pressure. Once a confirmed streak is established, it alerts you with an arrow right where the action happens—on the candlesticks.
Trade smarter, not harder. Let ElliottWave Circles be your definitive guide to catching the next big market wave before it breaks!
⚠️ This is NOT a signal provider or strategy EA.
This is a professional trading utility designed to protect capital and improve execution discipline.