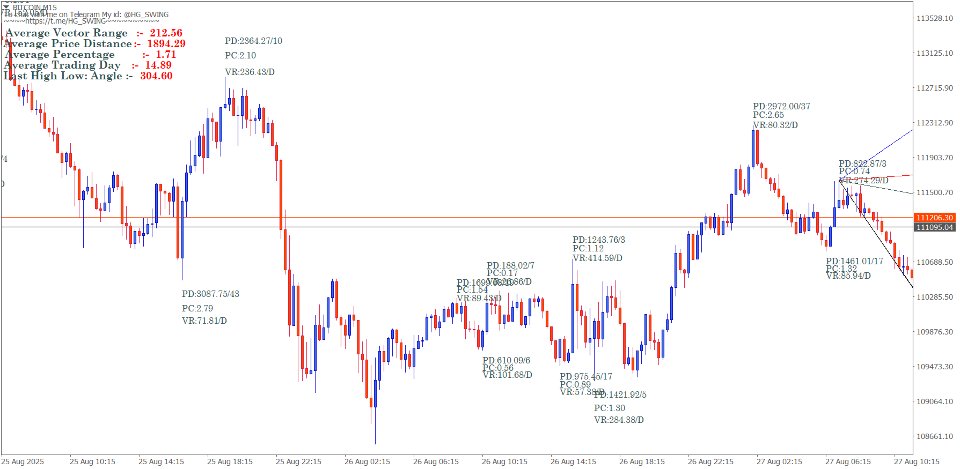
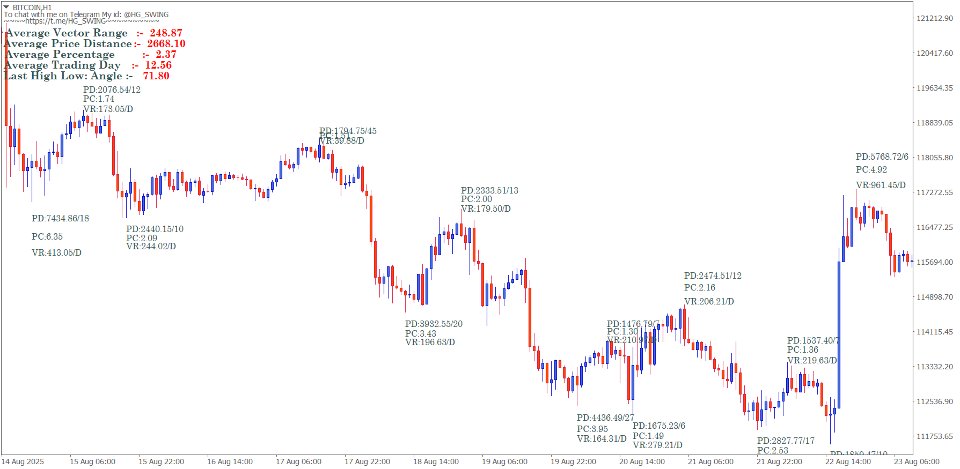
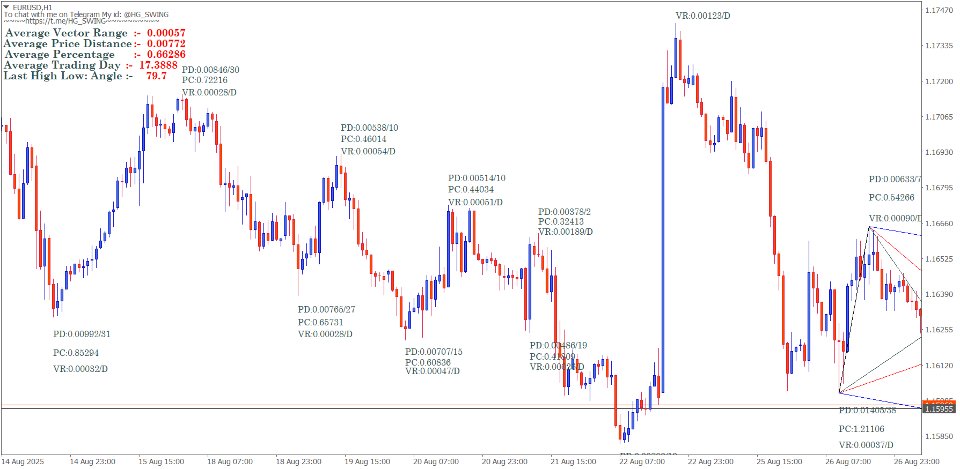
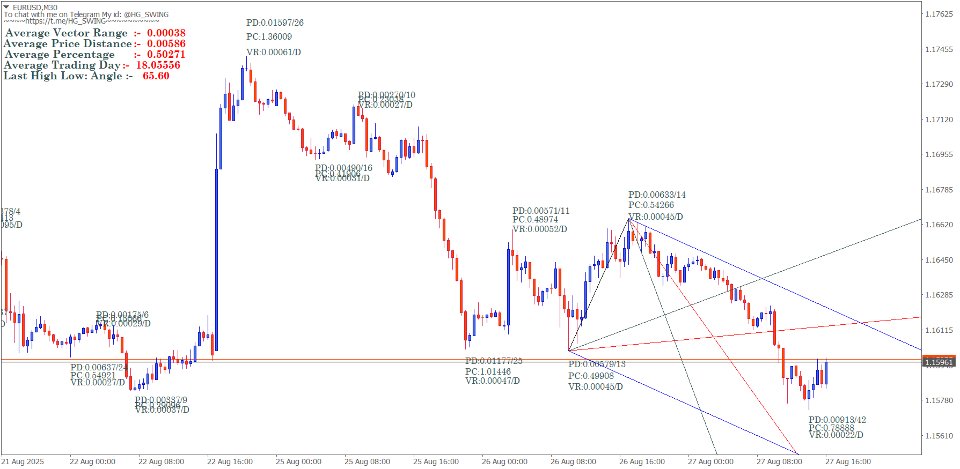
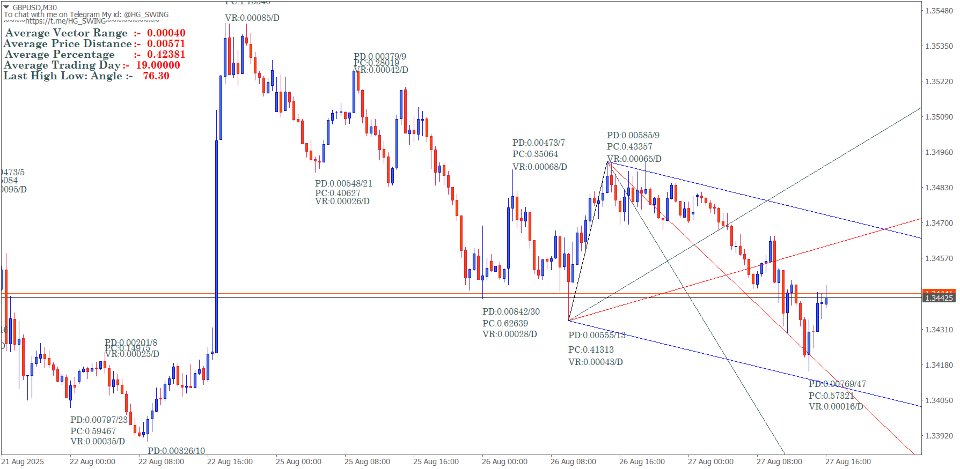
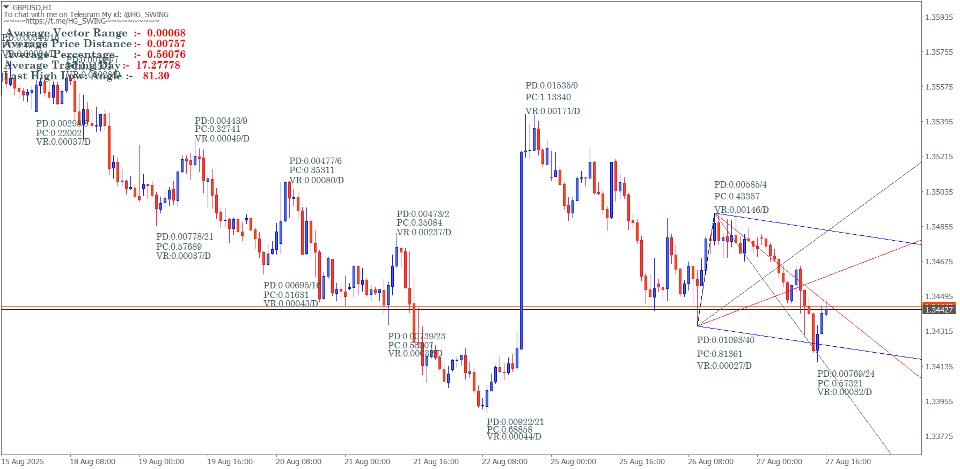
Gann Swing Method calculations
- Indicators
- Satya Prakash Mishra
- Version: 1.0
- Activations: 5
Introduction
William Delbert Gann (1878-1955) stands as one of the most enigmatic and successful traders in financial history, developing a sophisticated mathematical framework that combined geometry, astronomy, and natural law to predict market movements. His theory was based upon natural geometric shapes and ancient mathematics. Gann theory states that the patterns and angles of an asset on the market can be used as a predictor for the price's future movements.
Central to Gann's methodology was his swing trading approach - a systematic method of identifying market turning points through mathematical calculations that removed market "noise" and revealed the underlying geometric structure of price movements.
The Foundation of Gann's Mathematical Framework
Core Philosophy and Market Vibration Theory
According to this theory, human behavior isn't random and creates predictable vibrations in the whole market. Gann traded financial markets based on the idea that collective human behavior forms a specific repeating pattern that unfolds through time.
Gann believed that markets moved according to natural law, with mathematical relationships governing every price movement. His approach was built on three fundamental pillars:
- Price Analysis - Mathematical relationships between price levels
- Time Analysis - Cyclical patterns and geometric time relationships
- Pattern Analysis - Geometric angles and natural proportions
The Square of Price and Time
He later formulated his theory into what is known as the squaring of price and time. This concept represents the cornerstone of Gann's mathematical approach, where price movements and time intervals follow proportional relationships based on square root progressions and geometric angles.
Gann Swing Chart Construction and Mathematics
Basic Swing Chart Methodology
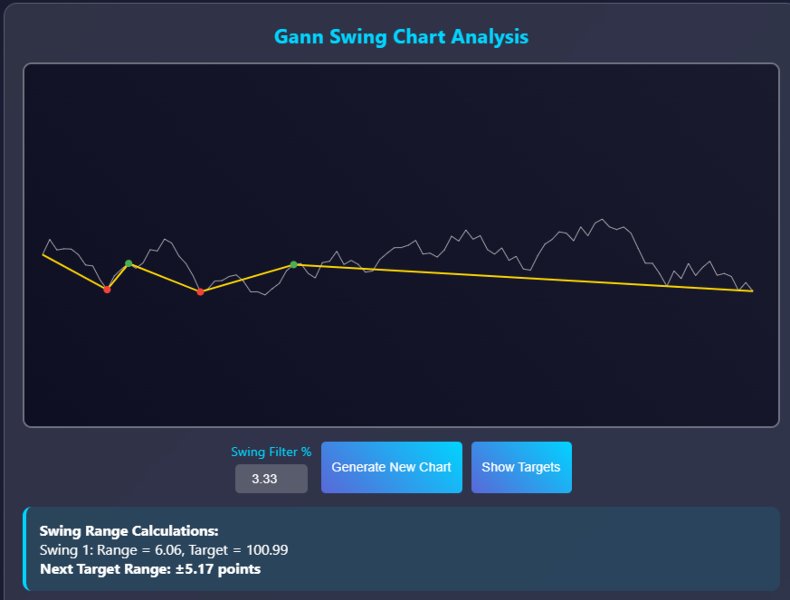
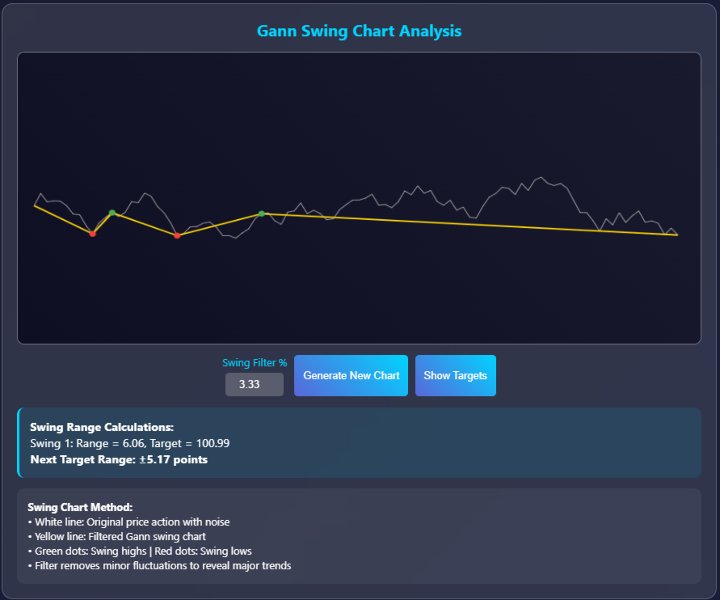
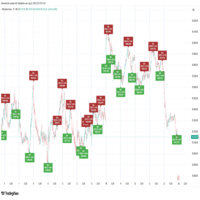
The Gann swing chart method systematically filters price action to identify significant market swings. The main goal of using Gann's charts is to remove the "noise" from regular price charts, revealing the underlying trend structure.
Mathematical Rules for Swing Identification
Upswing Requirements:
- Price must exceed the previous swing high by a predetermined percentage or point value
- The move must sustain above the breakout level for a specified time period
- Volume confirmation often required for validation
Downswing Requirements:
- Price must break below the previous swing low by the same mathematical criteria
- Sustained breakdown below the violation level
- Time-based confirmation of the new swing direction
Swing Calculation Formulas
Range Calculation Method
Swing objectives – add the range to move to the top of that move to find out the target for the next upmove or reverse in the bear market.
Formula:
Next Swing Target = Current Swing Extreme + Previous Swing Range
Where:
- Current Swing Extreme = The high (uptrend) or low (downtrend) of the current move
- Previous Swing Range = Absolute difference between the previous swing high and low
Percentage-Based Swing Filters
Gann employed specific percentage filters to define valid swings:
Small Swing Filter: 3-5% price movement Medium Swing Filter: 5-10% price movement
Major Swing Filter: 10%+ price movement
Square Root Progression in Swing Analysis
Gann discovered that significant price levels often aligned with square root relationships:
Square Root Calculation:
Next Resistance = √(Current Price²) + 1 Next Support = √(Current Price²) - 1
Square of numbers and 50% of the difference between those squares are significant support and resistance, but cannot be traded by themselves.
Advanced Mathematical Concepts
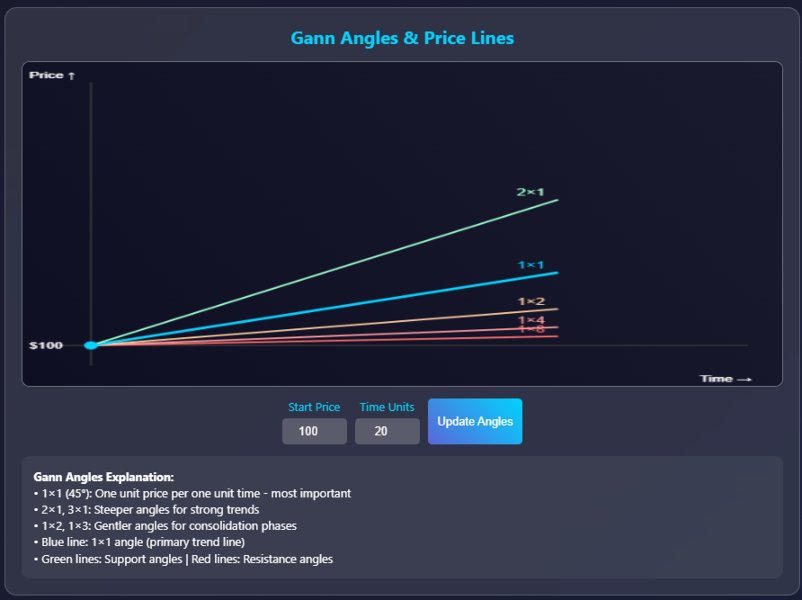
Gann Angles and Geometric Progression
Gann's angle system represents one of his most sophisticated mathematical contributions. These angles are derived from the relationship between price and time using specific geometric ratios:
Primary Gann Angles:
- 1×1 (45-degree angle) - One unit of price per one unit of time
- 1×2, 1×3, 1×4, 1×8 - Varying price-to-time relationships
- 2×1, 3×1, 4×1, 8×1 - Inverse relationships
Mathematical Construction of Gann Angles
Angle Calculation = arctan(Price Movement / Time Movement)
For a 1×1 angle on a chart where 1 day = $1:
- Slope = 1/1 = 1
- Angle = arctan(1) = 45 degrees
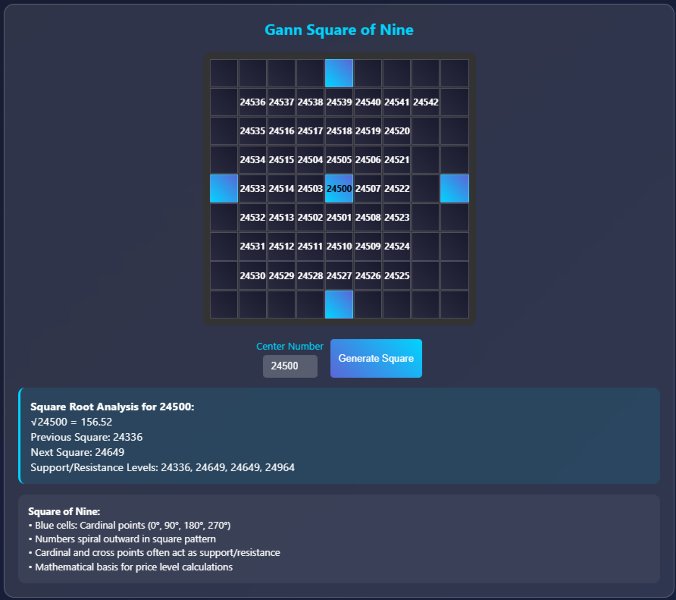
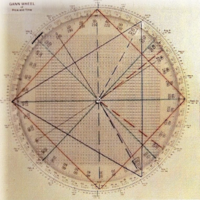
The Square of Nine
This represents Gann's most complex mathematical tool, incorporating:
Spiral Mathematics: Numbers arranged in expanding squares with specific directional movements creating resistance and support calculations.
Cardinal Points: 0°, 90°, 180°, 270° positions within the square Cross Points: 45°, 135°, 225°, 315° intermediate positions
Time Cycle Calculations
WD Gann, a famous trader, believed that market movements were influenced by predictable time cycles.
Natural Time Periods:
- Solar cycles (365 days)
- Lunar cycles (29.53 days)
- Seasonal cycles (90-day quarters)
- Geometric progressions (7, 14, 21, 30, 45, 60, 90, 120, 180, 360 days)
Practical Application of Gann Swing Mathematics
Trend Confirmation Methods
To confirm a trend was in progress, he would look for lower highs and higher lows to form after a major reversal in trend.
Uptrend Confirmation:
- Price creates higher swing highs
- Price maintains higher swing lows
- Gann angles provide directional support
Downtrend Confirmation:
- Price creates lower swing highs
- Price maintains lower swing lows
- Gann angles provide directional resistance
Risk Management Through Mathematics
Gann's main trading philosophy was to trade with a close stop loss and select the most opportune trades in the direction of the main trend.
Mathematical Stop Loss Placement:
- 3-5% below swing lows for long positions
- 3-5% above swing highs for short positions
- Gann angle violations as alternative stop levels
Swing Target Calculations
Primary Target Method:
Target = Entry Price ± (Previous Swing Range × 1.0)
Secondary Target Method:
Target = Entry Price ± (Previous Swing Range × 1.618)
Square Root Target Method:
Target = Next Perfect Square Root Level
Modern Implementation of Gann Mathematics
Digital Age Adaptations
Contemporary traders apply Gann's mathematical principles using:
Automated Swing Detection: Algorithms that identify swings based on percentage or point-based filters
Computer-Generated Gann Angles: Software that automatically plots angle lines based on mathematical relationships
Cycle Analysis Tools: Programs that identify time cycle confluences using Gann's natural time periods
Combining Traditional Mathematics with Modern Tools
Fibonacci Integration: Combining Gann levels with Fibonacci retracements for confluence analysis
Volume Profile Analysis: Using Gann price levels with volume-based support and resistance
Multi-Timeframe Analysis: Applying Gann swing principles across multiple time horizons
Critical Analysis and Limitations
Mathematical Precision vs. Market Reality
While Gann's mathematical approach provides structured market analysis, several considerations affect practical application:
Subjectivity in Swing Identification: Different traders may identify different swing points using identical criteria
Market Structure Changes: Modern electronic markets may not respond identically to mathematical relationships identified in Gann's era
Curve Fitting Risk: The complexity of Gann's methods can lead to retrospective optimization rather than predictive accuracy
Balancing Mathematical Rigor with Trading Psychology
Successful implementation requires understanding that mathematical precision must be balanced with:
- Market sentiment analysis
- Fundamental factor consideration
- Risk management principles
- Position sizing mathematics
Conclusion
WD Gann's swing trading and market calculation mathematics represent a sophisticated attempt to discover natural law within financial markets. W. D. Gann's legendary swing trading method has been unstoppable for the last 7 years. His geometric approach to market analysis, combining mathematical precision with natural cycles, continues to influence traders nearly a century after its development.
The enduring appeal of Gann's methods lies not just in their mathematical elegance, but in their systematic approach to market analysis that removes emotional decision-making from trading. While modern markets have evolved significantly since Gann's era, the underlying mathematical relationships he identified continue to provide valuable insights for contemporary traders willing to master their complexity.
Success with Gann's methods requires dedicated study of both the mathematical foundations and practical application techniques. The geometric precision of his approach demands disciplined implementation, but for those who master these calculations, Gann's swing trading methodology offers a unique perspective on market structure that transcends conventional technical analysis approaches.
Note: Trading based on any mathematical system involves significant risk. Historical performance of analytical methods does not guarantee future results. Proper risk management and thorough backtesting are essential before implementing any trading strategy based on Gann's mathematical principles.
link:- https://claude.ai/public/artifacts/4579f122-c256-455a-a251-a0c9f934cfd0
