 MetaTrader 5
 Experts
 Indicators
 Libraries
 Utilities
 Widgets
 Rules
Watch the Market tutorial videos on YouTube
How to buy а trading robot or an indicator
Run your EA on
virtual hosting
virtual hosting
Test аn indicator/trading robot before buying
Want to earn in the Market?
How to present a product for a sell-through
Free Technical Indicators for MetaTrader 5 - 55
 Signals from technical indicators play a crucial role in opening and closing deals on stock and Forex markets. The essence of indicators is a mathematical transformation of a financial symbol price aimed at forecasting future price changes.
Test technical indicators to better predict market behavior and profit from it.
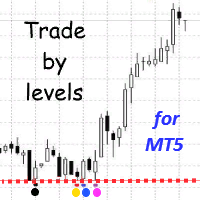
The Trade by levels for mt5 indicator is designed to automatically determine the formation of a model for entering the market on the chart of the selected instrument.
Definitions: ⦁ BFl is the bar that formed the level. ⦁ BCL1 and BCL2 bars, confirming the level.
The graphical model: ⦁ levels high\low the bars BFL and BCL1 must match the accuracy to the point ⦁ there can be any number of bars between BFL and BCL1. ⦁ between BCL1 and BCL2 intermedi
FREE

The "Matrix Series" indicator is a technical analysis tool designed to identify potential support and resistance zones by visualizing overbought/oversold conditions and trend direction using a combination of price data and customizable parameters, incorporating Commodity Channel Index (CCI) to highlight potential reversal points within the market.
Key features of the Matrix Series indicator: Dynamic Zones: Calculates support and resistance levels based on CCI values, allowing users to adjust th
FREE
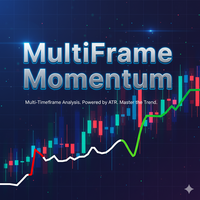
MultiFrame Momentum Indicator The MultiFrame Momentum is an advanced indicator that simultaneously analyzes multiple market timeframes to identify moments of directional convergence . Its unique design seeks momentum coincidences across different timeframes, generating clear visual signals via a line that changes between green (bullish) , red (bearish) , and gray (neutral) . Essential Configuration and Testing The indicator's effectiveness is entirely dependent on the customized timeframe config
FREE

Laguerre RSI Advanced Suite for MetaTrader 5 Take your technical analysis beyond standard oscillators with the Laguerre RSI Advanced Suite . Based on the work of John F. Ehlers, the Laguerre Relative Strength Index (RSI) is designed to provide superior smoothness and faster response times compared to the conventional Welles Wilder RSI. While the standard Laguerre RSI is a powerful tool, our Advanced Suite transforms it into a complete trading cockpit. It equips traders with a precision calcul
FREE

ChronoBar is a free, lightweight chart companion for every trader.
- Candle-close countdown, shown both in the corner and on a label riding the price line, so you always know how long the current bar has left. - Live spread in points, always visible. - Session boxes for Tokyo, London and New York (hours configurable per session) over the last several days. Each box is bounded by that session's own high and low, and the live session's box grows in real time.
It uses simple chart objects - no in
FREE

Trading Session Activity Dashboard
TAGLINE
Trade the session, not just the candle.
PRODUCT OVERVIEW
SessionEdge Navigator MT5 is a session-analysis indicator for MetaTrader 5. It tracks the major trading sessions and provides a practical dashboard showing whether a session is active, how much range it has produced, how that range compares with its recent average, and whether current session behavior is bullish, bearish, or range-like.
Covered sessions: - Sydney - Tokyo / Asian - London - N
FREE

Trend Reversal alert: The concept of the EA is to give you a message/alert when something happens in the market, so you will never pass a tradechance for a trendreversaltrade. The EA give you the message when the chance is higher for a trendreversal, but it is important to say that this doesn`t mean that you should trade every signal. The advantage provided by the program is that you don`t need to sit the hole time for the PC and look at the chart because you get a message when a good trendrever
FREE
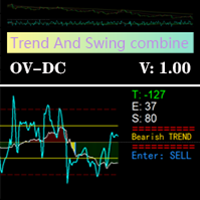
Based on the trend-following principle of CCI, it has been improved to become an indicator that can identify the reversal of the trend and its development direction, that is, it can identify the top and bottom attenuation of the oscillating trend in the trend market. feature The red and green columns represent the trend of bullish or bearish development under the current cycle. The blue line shows the position and attenuation of the current price trend in the current cycle. The upper and lower
FREE

See what your broker really delivers. Slippage Meter monitors the difference between the observed market price and the actual execution price of your trades. Entry & Exit slippage monitoring Average, best and worst slippage Live spread display Filter by lot size and Magic Number Optional CSV logging for detailed analysis Works alongside your Expert Advisor on the same chart Automatically adapts to the current trading symbol A simple tool for comparing real execution quality, spreads and slippage
FREE
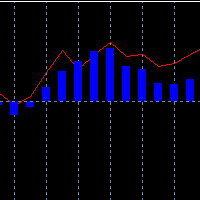
Klinger Volume Oscillator (KVO) - A Powerful Trend & Momentum Indicator This is an enhanced version of the Klinger Volume Oscillator (KVO) , a widely used indicator designed to help traders identify momentum shifts, trend direction, and overbought/oversold conditions in the market. How the KVO Indicator Works: Volume-Based Trend Identification – Unlike traditional oscillators that rely solely on price movements, the KVO uses both price and volume to detect market trends and momentum shifts .
FREE

The Smart Trend Tracker (OTT) is a technical analysis tool designed to help traders identify the direction and strength of a market trend. This indicator functions as an optimized moving average that adapts to market volatility, thereby providing dynamic support and resistance levels. The primary goal of the OTT is to smooth out price action and offer visual cues about potential changes in the trend. Core Components of the Indicator When you add the indicator to your chart, you will see two main
FREE

This is a simple and lightweight indicator that displays the live spread of the trading instrument on the top left corner of the screen. It is built to be lightweight, performant and react to real time price feed. The spread is the difference between the Ask and Bid price of the trading instrument. This is the cost that the user needs to pay for immediate execution. It is crucial to know and track the spread to be aware of costs involved. In the standard accounts, the spread is the only cost you
FREE
This is a general purpose indicator that displays colored lines at fixed and customizable price intervals, entered as parameters. It offers universal, constant, and familiar price ranges that allow quick and precise price analysis of a currency pair. With default parameters, this indicator implements The Quarters Theory , as described originally by Ilian Yotov . [ Installation Guide | Update Guide | Troubleshooting | FAQ | All Products | Get Help ] Easy to use No optimization needed Custom
FREE

Hourly Spread Profile reads your own account's closed bars and shows, hour by hour, what the spread actually cost on the symbol and timeframe you have open. It does not predict, and it does not advise. Every number on the panel already happened.
How the numbers are built: for each of the 24 server-time hours it takes the median spread across up to 5,000 closed bars, whichever the terminal holds. Median, not average, so one wide spike during a news release does not relabel a whole hour. An hour
FREE

Every trader knows the ritual: open the indicator settings, change a number, click OK, squint at the chart, decide it is wrong, open settings again, change it back. CCI Live Tuner ends that. It is a Commodity Channel Index that you tune directly on the chart, live . A small panel sits on your chart with sliders for the CCI period and both level lines. Drag a slider and the indicator recalculates and redraws instantly, in the background, while you watch. When it looks right, you are done — no dia
FREE

This indicator calculates the average trading range (Daily Range) of the current symbol over a custom period and displays the essential data directly as a comment on your chart. Key Features: Custom Lookback Period: Choose exactly how many days (e.g. 50 days) you want to include in the average range calculation. Real-Time Analysis: Calculates the daily spread ( High - Low ) and provides a precise average value instantly. Clean Design: No cluttered charts! Information is displayed discreetl
FREE
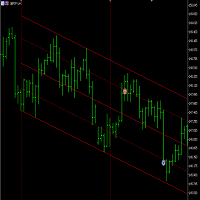
This is a free version of the indicator, the period between the vertical lines is always 30 bars. In the paid version the period can be set by user, so a configuration with many ThreePointsChannel indicators with different periods is possible.
The principle of construction - on top of any number of bars set by the user, a channel is constructed with maximum and minimum lines so that the bars touch the maximum and minimum of the channel at exactly three points. The name of the indicator follows
FREE
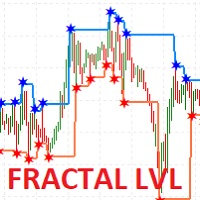
I present the well-known Fractal indicator.
Levels have been added to this indicator.
At the extreme points, you can see the continuation of the price line, which changes when the values of the Fractal indicator change.
The indicator is easy to use. The basic Fractal settings have been saved.
FractalLevels Parameters:
LeftBars - the number of bars on the left
RightBars - the number of bars on the right
FREE
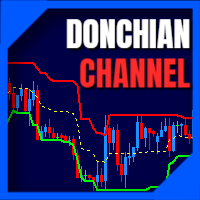
The donchian channel indicator might just be the best fit for you
Trading in derivative products such as futures, options, CFD's, forex and certificates contains significant risk. These products are not suitable for every investor. Investors could potentially lose all or more than the original investment. If anything, only money equal to personal risk capital should be used and can be lost without jeopardizing financial security or lifestyle. Partially or fully automated trading programs can
FREE

Support zones are created from confirmed pivot lows with positive volume conditions, while resistance zones are created from confirmed pivot highs with negative volume conditions. The visual boxes are color-coded to make analysis easier: green zones represent potential support areas, and red zones represent potential resistance areas. The indicator also includes hold signals and breakout labels. Hold markers help traders observe when price reacts from a zone, while breakout labels show when a su
FREE
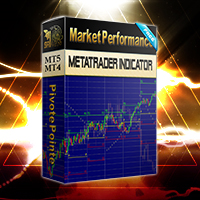
Unlike many other indicators including the moving average indicator, Pivot Point can be a leading indicator. In these systems, the price levels of the previous period are used to determine the critical points instead of relying on the current price performance. Such an approach provides a clear framework for traders to plan their trades in the best possible way.
You can use this method and its combination with the methods you want to build and use a powerful trading setup. MT4 version
Let us kno
FREE

Creator: https://www.quant-atlas.com/ Freyja is a visual pattern based indicator designed to highlight potential exhaustion and reversal areas using a structured time and price framework. The indicator studies how price behaves across repeated timing sequences and marks areas where the market may be approaching a potential turning point. It is built to give traders a clean visual layer that can be added to their existing analysis process. Signal Categories • Blue triangles
Low conviction patte
FREE

The Elsna ATR is a custom MetaTrader 5 indicator that combines two key features into one clean chart overlay: Average True Range (ATR) Display Calculates the current ATR value for the selected period (default = 14). Can show the value in pips or price units . Candle Countdown Timer Displays a live countdown showing how much time remains until the current candle closes. Updates every second, even when the market is quiet. This indicator helps traders quickly gauge market volatility (via ATR) and
FREE

The indicator makes calculations based on data obtained from one of seven (7) moving averages and colors the chart.
Simple moving averages are those that have only one important calculation parameter - the period.
The shift in the indicator is not used.
There is a shift trick setting, it is used to smooth the result of calculations. You can see the changes if you reduce this parameter to 1 (minimum value).
shift trick must always be less than the period value.
Available averages:
MA Simpl
FREE

MACD and Price Structure Confluence Indicator The indicator is based on the principles of the MACD in its formula , combined with price structure, support, and resistance levels identified on the D1 (Daily) timeframe . The regions identified by the system are represented by dashed lines extending across the entire chart , allowing users to visually monitor important levels within the market structure. The system's studies and analysis were primarily conducted using the M30 (30-minute) timeframe
FREE
An indicator for analyzing different currency pairs simultaneously Forex is a complex market that requires several currency pairs to be analyzed simultaneously Determine the number of currency pairs yourself Determine the currency pair you want to analyze to analyze 4 of the most important and similar currency pairs at the same time. For direct and simple analysis, some currency pairs have changed (EURUSD>>>USDEUR) Do not doubt that to succeed in this market, you must analyze several currency pa
FREE

ST Safe Guard: The Intelligent Shield Against Irregular Volatility The financial market is unforgiving. Most traders lose months of profit in just 5 minutes during high-impact news or irrational volatility spikes. ST Safe Guard is your first line of defense — a real-time monitoring system that decides, with mathematical precision, whether the market is safe or restricted for trading. Why every professional needs it: News Sentinel: Synced with the Economic Calendar, it visually flags the chart 30
FREE

AP Session Boxes — Asian / London / NY Range Overlay (MT5 Indicator) Clean session boxes on your chart.
This lightweight indicator draws the Asian , London , and New York time windows directly on the chart, including each box’s high and low as dashed lines. It’s perfect for quick context, breakout planning, and clean screenshots. Instant structure: See where the market ranged during key sessions. Breakout prep: Use the hi/lo lines as reference for pending orders or alerts fr
FREE
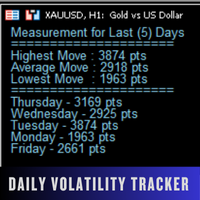
Daily Volatility Tracker is a practical and lightweight indicator designed to help traders monitor and analyze market volatility based on historical daily price movements. Whether you're a day trader, swing trader, or scalper, understanding how much a market moves per day is critical for: Choosing the right pairs to trade Setting accurate stop-loss and take-profit levels Adapting to changing market conditions MT4 Version - https://www.mql5.com/en/market/product/134958/ Join To Learn Market De
FREE
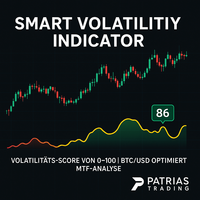
Smart Volatility Indicator – Precise Volatility Detection for MetaTrader 5 The Smart Volatility Indicator is an innovative tool for accurately measuring market volatility – specifically developed for MetaTrader 5. It combines candle range, wick ratios, and smart filtering logic into a clear, scalable volatility score from 0 to 100 . Perfect for traders who want to respond to breakouts, trend dynamics, or consolidating markets – manually or via Expert Advisors (EAs). Key Features Smart Volatility
FREE

CustomRSI50 - Customized RSI Indicator with Level 50 Description CustomRSI50 is a customized technical indicator based on the popular Relative Strength Index (RSI). This indicator provides a clear and customizable view of the RSI, with a special emphasis on the 50 level, which is crucial for many traders in momentum analysis. Main Features Configurable RSI period Highlighted 50 reference level Customizable applied price type Displayed in a separate window Fixed scale from 0 to 100 for easy inter
FREE

Trend Entropy – Adaptive Chaos & Order Detector
Entropy is the scientific measure of disorder or uncertainty in a system. In physics, it shows how energy disperses and why systems move toward chaos. In information theory, it measures unpredictability in data. Low entropy means order and predictability, while high entropy reflects randomness, complexity, and reduced clarity of outcomes.
Trend Entropy is a next‑generation trading indicator designed for MetaTrader 5. Unlike conventional oscillat
FREE

The Volunacci indicator is a custom technical analysis tool designed for MetaTrader 5. It combines volume analysis with Fibonacci retracement principles. In essence, it displays the current volume as a colored histogram within its own window. The unique feature is that it calculates a recent volume range (high and low over a user-defined period) and then projects key Fibonacci retracement levels (23.6%, 38.2%, 50%, 61.8%, 100%) onto this range. The color of the volume histogram changes dynam
FREE

K's Synapse is a market structure indicator designed to provide a clear visual reading of bullish pressure, bearish pressure, and uncertainty directly on the price chart. Creator: https://www.quant-atlas.com/ The indicator evaluates recent price structure across multiple reference points and converts the results into colored dots, rolling market surety percentages, and high intensity triangle signals. Dot Structure • Blue dots represent bullish price structure
• Red dots represent bearish price
FREE
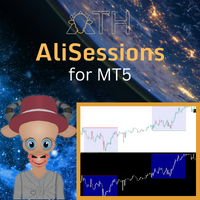
AliSession Highlight is an indicator that highlights a specific period of time according to your preferences. It can help you gain a clear vision of price movements into a specific session, the range of a session, and also to easily identify the high and low of the session. You can use it on any currency pairs, indices, and any timeframes. Settings: Start Hour: Set the hour to initiate the session highlight. Start Min: Set the minute for the start of the session highlight. End Hour: Specify the
FREE

Value Gap – a smart tool based on the Fair Value Gap strategy. How it works:
The indicator continuously analyzes recent price movements, identifying zones where buyers and sellers left an imbalance (Fair Value Gap). When such a gap is detected, it is marked on the chart as a clear level, allowing the trader to visually spot potential price reaction zones. After that, the tool monitors subsequent market movement. If the price returns and fills the gap within the allowed time, a signal is automa
FREE

If you like this product, please give it a 5 star rating as a token of appreciation.
This indicator calculates and draws pivot points and support/resistance levels for both daily and weekly timeframes: Pivot (central) level Support levels S1, S2, S3 Resistance levels R1, R2, R3 It allows showing daily, weekly, or both sets of pivots , giving traders visual references for potential support/resistance areas.
Pivot mode: Choose which pivots to display (weekly, daily, or both). Colors and style: C
FREE

Server Timer
Version: 1.2 The Server Time Clock Indicator is a lightweight and visually appealing tool for displaying the server's current date and time directly on the chart. This indicator updates dynamically every second and provides the following features: Customizable Appearance : Adjust font color, background color, and font size to match your chart's theme. Day and Time Display : Shows the current day, date, and time in an easy-to-read format ( Day{MM/DD} HH:MM:SS ). No Performance Over
FREE

Every trader knows the ritual: open the indicator settings, change a number, click OK, squint at the chart, decide it is wrong, open settings again. The Force Index has only one number to set -- the period -- but that single trip through the dialog still costs you the same squint-and-guess cycle every time you want to compare 13 against 2 or 100 on your own symbol. Force Index Live Tuner ends that. It is a Force Index that you tune directly on the chart, live , in its own window. A small panel s
FREE
MultiFrame MA: A Multi-Timeframe Trend Indicator MultiFrame MA is a trend analysis indicator designed to provide a comprehensive market overview across various timeframes. Instead of relying on a single timeframe, this tool synthesizes information from multiple charts, giving users a holistic and reliable perspective. KEY FEATURES: Multi-Timeframe Analysis: The indicator analyzes data from various timeframes, from M1 up to Monthly, to help users identify trend confluence at different levels. MA
FREE

Drawdown Floor makes the invisible line visible. A funded or challenge account dies the instant equity touches a floor that trails your peak, resets every day, or sits static under your starting balance. Your prop firm never draws that line. This does. What it shows A live equity-vs-floor plot in a separate window: your trading equity against up to three floors (trailing or static maximum drawdown, and the daily floor). The nearest binding floor, the one you would hit first, is highlighted in re
FREE

NovaTac Volition Exit Commander is a position-aware MT5 exit indicator with separate BUY and SELL scores, closed-bar confirmation, trailing references and confluence-qualified management states.
NovaTac Volition Exit Commander is a position-aware exit analysis indicator for MetaTrader 5. It evaluates conditions relevant to managing BUY and SELL positions and displays separate Close BUY and Close SELL scores.
The indicator combines momentum, trend strength, volatility, candle behaviour, marke
FREE

This is MT5 version Get Tunnel Warrens MT4 here
Here are several indicators that work together. It basically works with moving averages and various levels of ATR creating a dynamic channel through which the price is drained. As I always recommend, you should try it before using it in live so that you understand how it works. The market entry signal is similar to other MA indicators, but with this one you also have a graphical analysis of the moment when the trend is found and dynamic levels to
FREE
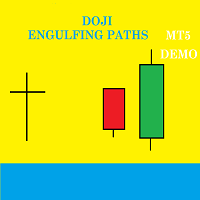
Doji Engulfing Paths enables to get signals and data about the doji and the engulfing patterns on charts. It makes it possible to get opportunities from trends, and to follow the directional moves to get some profits on the forex and stocks markets. It is a good advantage to take all the appearing opportunities with reversal signals and direct signals in order to obtain some profits on the forex market. With the demo version, only the signals starting with the 20th candle or bar are available.
FREE

MT5 Visual Theme Indicator – Clean Chart and Full Customization Enhance the appearance of your charts in MetaTrader 5 with this fully customizable visual indicator, designed to provide a clean, modern, and easy-to-read trading environment. This indicator does not generate signals or open trades. Its sole function is to optimize chart visualization to help you analyze the market with greater clarity. If you find this useful, please leave a 5-star rating and follow me for future tools, indicators,
FREE

Full Description (Professional MQL5 Version) Range Scanner Pro is a lightweight and efficient MT5 indicator that scans price action to monitor market ranging conditions and potential breakout setups. Markets spend most of their time in consolidation. Identifying these range zones early allows traders to prepare for high-probability breakout trades. This tool is ideal for breakout traders, scalpers, intraday traders, and volatility-based strategy users. Key Features Detects market consoli
FREE

>> Announcements Channel << DiverX is a powerful and versatile divergence indicator developed for the MetaTrader 5 platform. It detects both Regular and Hidden Divergences based on five popular technical indicators: RSI (Relative Strength Index) , RVI (Relative Vigor Index) , Stochastic Oscillator, CCI (Commodity Channel Index) , and MACD (Moving Average Convergence Divergence) and ATR Plus (author’s proprietary indicator, product page >> ) . The indicator plots results directly on the main c
FREE

Elliott Wave PRO MTF & SQX Engine: Manual Técnico Este indicador es un sistema algorítmico avanzado que escanea el mercado buscando la estructura clásica de Ondas de Elliott (Impulso 1-5 + Corrección ABC). Combina volatilidad adaptativa (ATR), fuerza de tendencia (ADX), filtros Multi-Timeframe (MTF) y una salida de datos especializada para integrarse con constructores de estrategias automáticas como StrategyQuant X. ️ 1. Parámetros de Entrada (Inputs) Los parámetros están agrupados lógicame
FREE

Switch Tray is a shortcut tray tool for commonly used trading pairs provided to traders. It can be placed at the bottom of the chart, and commonly used trading pairs can be set by themselves. 1. You can set the shortcut switch button for your commonly used trading pairs. The default is [EURUSD/GBPUSD/XAUUSD/USDJPY/USDCHF/USDCNH]. / slash is the separator. 2. The button of each trading pair is also equipped with the number of open positions of a certain trading pair. 3. Multi-cycle quick switchi
FREE

An indicator for visualizing time ranges of key trading sessions: Asian, European, and American. The indicator features functionality for setting the start and end times of each trading session, as well as an adjustable timezone of the trading server. The main advantages of the indicator include the ability to operate with minimal CPU load and memory usage. Moreover, it offers the option to specify the number of displayed historical days, providing the user with flexible market dynamics analysis
FREE
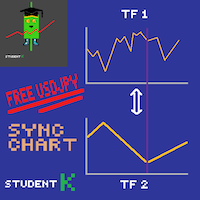
--- StudentK Sync Chart --- 1. Move charts at the same time 2. Cross check among different Symbols and Timeframes 3. Plan your own trading strategies
=== Simple (Free) Version ===
1. Allow USDJPY only
2. Support M5 and M15
3. * Contact StudentK for unlocking all timeframes *
--- Context --- StudentK is not indicated as a master or K Sir for knowledgeable person who claims for winning all the time. (But lots of traders should know the fact that it is rarely truth, especially in fluctuated per
FREE

Initial Balance Pro – Institutional Opening Range Professional MT5 Indicator
Trade Like Institutions
Initial Balance Pro automatically identifies the Institutional Initial Balance (IB), Opening Range and key market session levels used by professional traders.
Designed for MetaTrader 5, the indicator provides precise reference zones for brea
FREE
Hi Traders,
Simple, clear, and essential for every trader. It helps keep your chart clean and informative.
// In case you open multiple positions, your chart becomes crowded and messy. Then, you may want to hide "Trade levels" and only concern about the averaging buy or average sell level. // In case you want to know at which price your account would reach the broker’s stop-out threshold (i.e., the price at which your account would be “burned”). //You may also want to get your account's PnL an
FREE

Volatility drives opportunity — and SierraCapital Multi‑ATR gives you the clarity to act on it. This indicator displays multiple ATR readings in a clean two‑column panel, allowing you to instantly assess market conditions without switching timeframes or opening extra windows. Whether you scalp, swing trade, or automate your strategies, Multi‑ATR provides the volatility insight you need. Highlights Up to 10 ATR periods displayed at once Clean, professional two‑column layout Fully customizable pos
FREE

El indicador técnico conocido como Líneas de Tendencia Perfecta . Este indicador es una herramienta valiosa en el análisis técnico y se utiliza para mejorar la toma de decisiones en el trading. Aquí tienes una descripción paso a paso de cómo funciona y cómo puede ser utilizado por los traders: Identificación de Tendencias : Las líneas de tendencia perfecta se dibujan conectando dos o más puntos de precio en un gráfico, revelando así la dirección general del mercado. Una línea ascendente indica
FREE
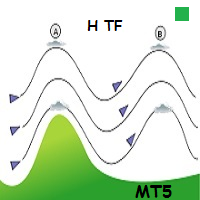
WindFlow HTF is a useful tool suited to use in conjunction together with my WindFlow indicator. This indicator will give you a background vision about the price action trend on a higher timeframe, so when it runs with the WindFlow indicator you have an almost complete trading solution. At this point, you only need some support/resistance analysis and a bit of focus to become a consistent trader.
The metaphorical "wind's ballet" Professional traders know that every timeframe is governed by its o
FREE

El indicador técnico Non Lag MA (Non-Lagged Moving Average) es una variante de la media móvil que busca reducir el retraso inherente a las medias móviles tradicionales.
Pros: - Menos retraso: Al estar diseñado para reducir el retraso, el Non Lag MA puede proporcionar señales más rápidas que las medias móviles tradicionales. - Tendencias claras: Las líneas del Non Lag MA muestran claramente las tendencias alcistas y bajistas, lo que facilita la interpretación de la dirección del mercado. - Pers
FREE

Trend Scanner Dashboard — это информационный индикатор для MetaTrader 5, который берет на себя рутину по поиску сильных и ровных трендов. Вам больше не нужно вручную переключать десятки графиков в поиске точек входа. Главные преимущества: Экономия времени: Автоматически отслеживает все валютные пары и инструменты из окна «Обзор рынка». Математическая точность: Для оценки качества тренда используется линейная регрессия (R-squared / R² ). Индикатор отличает действительно гладкий, устойчивый тре
FREE

This indicator gives full information about the market state: strength and direction of a trend, volatility and price movement channel. It has two graphical components: Histogram: the size and the color of a bar show the strength and direction of a trend. Positive values show an ascending trend and negative values - a descending trend. Green bar is for up motion, red one - for down motion, and the yellow one means no trend. Signal line is the value of the histogram (you can enable divergence sea
FREE
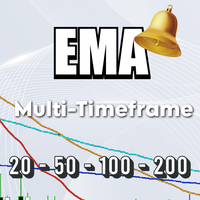
The EMA Navigator Pro is an advanced version of the popular EMA indicator, designed to provide superior flexibility and multi-timeframe analysis capabilities. This indicator not only displays EMA lines but also offers a powerful alert system to ensure you never miss a crucial signal. Key Features: Multi-Timeframe Support: You can assign a separate timeframe to each individual EMA line, allowing you to analyze long-term (e.g., D1) and short-term (e.g., H1) trends on the same chart. Automatic Cro
FREE

PGSindicator for MetaTrader 5 Free Companion Indicator for Profit Guard System Trade Panel. *** The attached video is the " PGS Trade Panel Tutorial Part 1 " *** (4m video) Adjust >>> **** EMA1 N-Pips Separation from EMA2
This setting defines the minimum distance required between EMA1 and EMA2 before a trend condition is considered valid.
The default value is 100.0 pips for NASDAQ 100, 1 minute CHART . Depending on how your broker calculates pip values, you may adjust this to 20.0 or 10.0
FREE

Candle Detector By Mahefa R. General Description Candle Detector is an advanced technical indicator for MetaTrader 5 , designed to automatically detect and highlight the most important Japanese candlestick patterns directly on the price chart .
It allows traders to quickly identify market reversal and continuation setups without visual clutter. The indicator recolors only the candles that match the selected pattern , ensuring a clear, accurate, and professional chart analysis . ️ How It Work
FREE

QDragon Lot Calculator & Risk Manager is a premium, interactive utility designed for MetaTrader 5 to simplify your risk management and lot size calculations. No more manual calculations, spreadsheet checks, or guessing lot sizes before entering a trade. Simply drag the lines on your chart and let the indicator do the math!
Why Risk Management Matters The secret to consistent trading is keeping your risk controlled. With QDragon Lot Calculator, whether your Stop Loss is 10 points or 1000 points
FREE

Hi there! Since I am starting commercial and non-commercial product publishing I would highly appreciate: If you like this product, please rate it. That will help to promote not only this product, but indirectly another ones. So, such promotion will help to make some money from commercial products. Thus, I will have opportunity to fund my another directions of trading researches like bot development using mql4 and mql5 programming languages as well as python written products like crypto bots. If
FREE
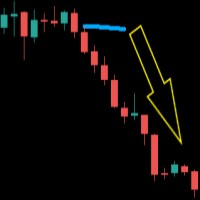
O indicador imprime a linha da média longa quando as médias media e curta estão confinadas dentro dos limites de 1 ATR (average tru range) da média longa. Após períodos de congestão os preços se movimentam fortemente em uma direção. Este indicador não fornece pontos de entrada, apenas mostra que as médias estão bastante próximas. Parâmetros: Periodmalongo: Período da média longa. Periodmamedio: Período da segunda média. Periodmamedio2:Período da terceira média. Periodmacurto: Período da média cu
FREE
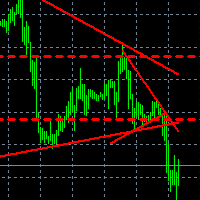
Что показывает на графике индикатор TrendBreak? 1 — рисует линию тренда до максимальных максимумов в 100 баров. 2 — рисует линию тренда до максимальных максимумов в 30 баров. 3 — рисует линию тренда до максимальных минимумов в 100 баров. 4 — рисует линию тренда до максимальных минимумов в 30 баров. И эти линии указывают на сжатие тренда. Также индикатор выбирает 100-й бар и рисует ровную линию к максимуму и минимуму.
FREE

Overview
Asian Session Anchor Profile is a technical indicator for MetaTrader 5. It calculates reference levels from the Asian trading session and displays them on the chart. The levels remain visible during the following sessions and are updated as new data arrives.
The indicator is an analysis tool. It does not open trades and does not provide buy or sell signals.
Displayed elements
The indicator draws the following elements on the chart:
1. Asian session range, shown as a rectangle betw
FREE
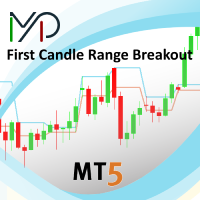
This creative simple indicator will provide a precise framework for market sentiment within technical analysis of different timeframes. For instance, for traders like me that uses "Mark Fisher" strategy regularly, this is a perfect indicator for having an insight to markets from short term to long term point of view, using Break points of candles' lows and highs and perfect to combine with "Price Action" . For more options and modifications you can also edit the low timeframe candles withi
FREE

LIMINAL DEE — Dynamic Exhaustion Engine for MetaTrader 5 LIMINAL DEE is a momentum exhaustion indicator that detects when a directional price move is running out of energy — before price confirms the reversal. Rather than using fixed take profits, DEE scores exhaustion in real time on a normalised 0–100 scale and signals the optimal exit window while profit is still at its peak. DEE combines three proprietary sub-measurements: Body Decay Index (BDI) — whether consecutive expansion candles are sh
FREE

SwingStrength Pro – Swing High & Low Strength Scoring for MT5 Not every swing high or low is equal. Some are formed by a sharp rejection on heavy volume and hold for weeks; others are minor pauses that break at the first retest. SwingStrength Pro finds every swing high and swing low that price has not yet closed through, scores each one from 0 to 100, and shows you the strongest resistance and support directly on your chart. How it works Finds swings. The indicator scans the chosen timeframe for
FREE
The MetaTrader Market is the best place to sell trading robots and technical indicators.
You only need to develop an application for the MetaTrader platform with an attractive design and a good description. We will explain you how to publish your product on the Market to offer it to millions of MetaTrader users.

You are missing trading opportunities:
- Free trading apps
- Over 8,000 signals for copying
- Economic news for exploring financial markets
Registration
Log in
You agree to website policy and terms of use
If you do not have an account, please register