 MetaTrader 5
 Experts
 Indicators
 Libraries
 Utilities
 Widgets
 Rules
Watch the Market tutorial videos on YouTube
How to buy а trading robot or an indicator
Run your EA on
virtual hosting
virtual hosting
Test аn indicator/trading robot before buying
Want to earn in the Market?
How to present a product for a sell-through
Free Technical Indicators for MetaTrader 5 - 62
 Signals from technical indicators play a crucial role in opening and closing deals on stock and Forex markets. The essence of indicators is a mathematical transformation of a financial symbol price aimed at forecasting future price changes.
Test technical indicators to better predict market behavior and profit from it.

The indicator makes calculations based on data obtained from one of seven (7) moving averages and colors the chart.
Simple moving averages are those that have only one important calculation parameter - the period.
The shift in the indicator is not used.
There is a shift trick setting, it is used to smooth the result of calculations. You can see the changes if you reduce this parameter to 1 (minimum value).
shift trick must always be less than the period value.
Available averages:
MA Simpl
FREE

BarX — Specific Candle High & Low Indicator BarX is a technical indicator that automatically highlights the high and low of a specific candle of the day , as defined by the user (for example, candle 0 represents the first candle after market open ). This tool is especially useful for traders who use fixed price levels as support, resistance, breakouts, or reversals . By visually marking these points on the chart, BarX facilitates technical analysis , improves market reading, and helps in making
FREE

A lightweight, non-intrusive on-chart floating dashboard for MetaTrader 4 (MT4) and MetaTrader 5 (MT5) . It provides critical market telemetry and live account status directly inside the chart window with interactive drag-and-drop and minimize functionality. Key Features Interactive Drag & Drop: Click anywhere on the dashboard panel to reposition it seamlessly across the chart window. Automatic boundary detection keeps the panel within the chart frame. Smart Minimize / Expand Toggle ( _ / + ): C
FREE

The Wormhole time frame indicator for MetaTrader 5 (MT5) is not just another trading tool—it’s your competitive edge in the financial markets. Designed with both novice and professional traders in mind, the Wormhole transforms how you analyze data and make decisions, ensuring you stay ahead of the curve. Why You Need the Wormhole Indicator Outsmart the Competition: The ability to view two timeframes on the same chart simultaneously means you’re always one step ahead. No more switching between ch
FREE

The Fibonacci indicator automatically displays the Fibonacci retracement levels, representing significant support and resistance. The range for calculating the indicator can be taken from the previous day, week, month, year or user-specified session.
Levels 100 % (High) of the range from the previous session. 0 % (Low) of the range from the previous session. 76,4 % of the range from the previous session. 61,8 % of the range from the previous session. 50 % of the range from the previou
FREE

ViewTrend The ViewTrend indicator provides a visual interpretation of market conditions by coloring the candles and the moving average line based on defined technical criteria. ️ How does it work? The agorithm analyzes the relationship between the current closing price, the previous closing price, and the behavior of a simple moving average (SMA). Based on this analysis, the indicator colors the candles and the moving average line according to the technical scenario observed: Blue — Suggesti
FREE

================================================================================ VL LEVELS INDICATOR - USER GUIDE VolumeLeaders Institutional Trade Levels for MetaTrader 5 ================================================================================
WHAT IS THIS INDICATOR? ----------------------- This indicator displays VolumeLeaders institutional dark pools trade levels on your MT5 charts. These levels represent price points where significant institutional trad
FREE
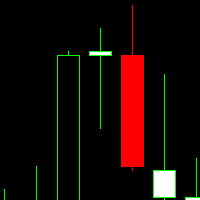
This indicator is a volume indicator it changes the color of the candles according to a certain number of ticks, and this number of ticks can be informed by the user both the number of ticks and the color of the candles, this indicator works in any graphical time or any asset, provided that the asset has a ticker number to be informed.
This indicator seeks to facilitate user viewing when analyzing candles with a certain number of ticks.
FREE

Tick Push Strength Indicator Catch rapid market momentum before the candle even closes. The Tick Push Strength Indicator tracks live order flow on a raw, tick-by-tick level. While standard indicators suffer from lag, this tool calculates the exact speed and volume pressure behind every micro-movement—giving you an instant visual of whether Bulls or Bears are driving the market. Key Highlights: Zero-Lag Analysis: Measures real-time tick velocity instead of waiting for candle closes. Breakout
FREE

The RSI everyone uses. Finally READABLE.
RSI is one of the most famous indicators in the world... and one of the most misread. RSI Clarity Zones makes it crystal clear, with colored zones and a plain word.
️ WHAT YOU SEE • The RSI with its colored zones overbought / neutral / oversold • A label stating the state plainly: OVERBOUGHT, OVERSOLD or NEUTRAL • A flag when it crosses the 50 line (the momentum shift) ️
WHO IT'S FOR Beginners who want to understand RSI without memori
FREE
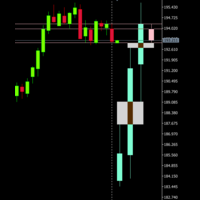
If you like this product, please give it a 5 star rating as a token of appreciation. This indicator projects Higher-Timeframe (HTF) candles onto the current chart and optionally shows their OHLC lines and Fair Value Gaps (FVGs) using ICT 3-candle logic.
Projects multiple higher timeframe candles.
Accurately preserves HTF OHLC on any lower timeframe.
Allows spacing adjustment between projected candles.
Optionally displays OHLC horizontal reference lines.
Automatically detects and draws HTF Fair
FREE

This MQL5 script is a Dynamic Support & Resistance (S/R) Investigator. It functions as a real-time analytical tool that identifies key price levels and mathematically evaluates their "durability" based on historical interactions. Unlike static indicators, it uses a custom Graphical User Interface (GUI) to provide a live dashboard of market structure. 1. Level Detection Logic The indicator scans the most recent InpPeriod (lookback) of bars to identify the absolute highest peak (Resistance) and t
FREE

LotCalc is a minimalist MT5 indicator designed for fast, precise position sizing. Set your risk amount in dollars, click the button, then click your entry and stop-loss levels directly on the chart — the lot size and point distance are calculated and displayed instantly. No clutter, no extra panels, just the one tool you actually need before placing a trade.
FREE
The Kalires Channel Indicator is a technical indicator used to evaluate trend direction and potential trading opportunities. This is a hybrid indicator that combines Kauffman Adaptive Moving Average (KAMA), linear regression and smoothing. The Kalires Channel Indicator consists of two lines: one central and two outer bands. The central line is a smoothed KAMA modified according to the direction of the trend. The outer bars represent two linear regression lines drawn above and below the center l
FREE
Are you having trouble with too many events in the economic calendar? This reduces to the minimum number you need. You can filter by country code importance any key words and you can receive alerts before the set time of the event. ++++++++++++++ If country code is blank, display available code on the expert tab. You need to turn off the automatic calendar update setting in MT5. Any sound file of .wav format in Sounds directory. The length of keyword characters is limited by MT5.
FREE
Простой индикатор, показывающий цены Bid и Ask. Есть настройки отображения информации и возможность перетаскивать панель. Индикатор используется для наглядного отображения цен покупки и продажи актива.
Входные параметры : Support - Ссылка, на помощь проекту heigth - Высота формы width - Ширина формы size - Размер текста bidcol - Цвет текста bid askcol - Цвет текста
FREE

Spread Engine Nika — Real-Time Spread Profiling for MetaTrader 5 Spread Engine Nika is a professional spread analysis indicator for MetaTrader 5. It builds a statistical spread profile for any symbol using historical tick data, displays live spread conditions in context, and gives you an instant read on whether current spreads are normal, elevated, or dangerous — all in a compact on-chart panel. Designed for scalpers, intraday traders, and anyone who cares about execution cost, it turns raw spre
FREE

This indicator is designed based on the Moving Origin indicator
When the moving origin indicator breaks the price, this indicator gives a signal
It is useful for better viewing of signals and analysis on them
Attributes: Can be used in all symbols Can be used in all time frames Too many signals Simple and quick settings Easy way to work
Settings: period: like moving average settings alarmShow: If you want to receive an alert in Metatrader after receiving the signal, enable this setting
alarmS
FREE

TRADING REPORT Mini-dashboard for MetaTrader 5 Main features Updates on every tick (open position and floating P/L in real time) Current position details (BUY/SELL + volume + entry price + floating P/L with green/red color) Daily P/L and today’s balance change Full statistics: Balance, Equity, Total trades, Wins/Losses, Winrate (%), Profit Factor, Best trade, Worst trade Clickable “Report” button: one click to show, one click to completely hide the panel (perfect for cleaning the screen) Fully
FREE
The Trendline Automatic indicator is an advanced technical analysis tool specifically designed to assist traders in identifying critical levels in the financial markets through the automatic drawing of support and resistance trendlines on price charts. With its automatic capabilities, this indicator saves traders time and effort in analyzing price movements, allowing them to focus on making better trading decisions. Key Features : Automatic Drawing of Trendlines : This indicator allows traders t
FREE

Fibonacci Trend Indicator for MT5 Unlock the power of Fibonacci analysis on your MetaTrader 5 charts!
Our Fibonacci Trend Indicator automatically plots dynamic support and resistance levels so you can spot trends, reversals, and breakout opportunities at a glance. Features & Advantages Automatic Fibonacci Levels
Instantly displays seven key Fibonacci retracement levels based on the highest and lowest prices from your chosen lookback period — no manual work required. Dynamic Trend Adaptatio
FREE
Overview
MAM Forecast is an indicator designed to replace guesswork with probabilities. It generates two adaptive levels—UP and DN—along with probabilities that always sum to 100%, giving you a clear idea of which level price is more likely to reach within the chosen horizon. Key Features Displays UP (upper) and DN (lower) adaptive levels calibrated to market volatility. Shows touch probabilities (e.g., 62% vs 38%) for likelihood within the defined horizon. Clean, informative HUD indicates sym
FREE
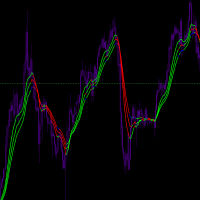
Input Parameters JawPeriod (default=9): Period for the blue line JawShift (default=0): Shift for the blue line TeethPeriod (default=7): Period for the red line TeethShift (default=0): Shift for the red line LipsPeriod (default=5): Period for the green line LipsShift (default=0): Shift for the green line Signals Bullish Conditions When price moves above all lines (all lines turn Lime) Potential buying opportunity Confirms upward momentum Bearish Conditions When price moves below all
FREE
SilverTrend Signal Indicator (v4.0) Brief Description
The SilverTrend_Signal is a versatile, trend-following technical analysis indicator designed for MetaTrader 5. It identifies potential market reversal points by analyzing price action within a dynamic volatility-based channel. The indicator plots clear buy (up arrow) and sell (down arrow) signals directly on the chart and provides customizable audio/visual alerts to notify traders of new trading opportunities; helping traders quickly sp
FREE

The AlphaQuant Prop Firm Risk Calculator is a professional, institutional-grade utility designed specifically for proprietary trading firm challenges and funded accounts. It eliminates manual guesswork, ensuring every trade you plan aligns perfectly with your firm's strict risk parameters.
KEY FEATURES
️ Universal Prop Firm Compatibility Unlike rigid tools locked to one firm, this calculator features fully customizable input parameters. Easily adjust the Max Daily Loss , Max Total Loss ,
FREE

Titan Strength Pro Indicator- Multi-Currency Strength Analysis System Overview Titan Strength Pro is a technical indicator that analyzes the relative strength of 8 major currencies (USD, EUR, GBP, CHF, CAD, AUD, JPY, NZD) across all 28 forex pairs simultaneously. The indicator calculates currency strength values across multiple timeframes and generates trading signals based on strength divergence, trend alignment, and multi-timeframe convergence. This is an indicator tool that provides anal
FREE

UZFX Professional Trader Panel v1.0 – Your Complete Trade Monitoring Solution Stop juggling between multiple charts and terminal tabs. Get a complete bird's-eye view of your entire trading portfolio in one elegant, real-time dashboard. Transform your chart into a professional trading command center. Monitor all open positions, account health, and floating P&L at a single glance. If you are Looking Best indicators in Mql5 Market. Check these out!
SSS Scalping Smart Signals MT5 Indicator
Scalpi
FREE
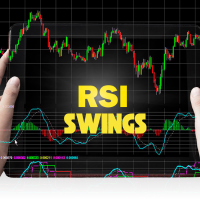
The RSI Swings indicator is a powerful tool designed for MetaTrader 5 (MT5) that combines the principles of the Relative Strength Index (RSI) with high and low price levels to enhance trading decisions. This innovative indicator helps traders identify potential reversal points in the market by analyzing price swings in conjunction with RSI readings. Key Features High-Low Analysis : The RSI Swings indicator focuses on the highs and lows of price movements, allowing traders to pinpoint signifi
FREE

Thread indicator is calculating possible values for the upcoming periods. It is built by author’s system, with ability to learn. Input data ( recommended interval ): Sensitivity to oscillatory motion (integer value, 0 - 8) increase of value shifts priority of calculation towards high-frequency vibrations (increase loads the system) Shift of diagram (integer value, 0 - 8) shifts output of indicator to the right Diagram forecast (integer value, maximum 10) defies the number of periods calculated
FREE

INSTITUTIONAL SESSION PRO - Smart Money Zones PROFESSIONAL SESSION HIGHLIGHTER FOR SERIOUS TRADERS Institutional Session Pro is a FREE, professional-grade indicator designed to help traders identify and visualize key institutional trading sessions, liquidity zones, and high-volume candles with precision and clarity. Perfect for ICT methodology, Smart Money Concepts (SMC), and institutional trading strategies.
KEY FEATURES SMART MONEY SESSIONS Asian Session Range with automatic High/Lo
FREE
Multi-Timeframe Chart Overlay Indicator
The Timeframe Overlay indicator displays price action for multiple timeframes on a single chart, allowing you to quickly assess different timeframes from a single chart. The advantage is to observe and follow the correlations of price movements in real time to help you find potential trades at a glance.
---- Symbol 1 ----
Symbol = EURUSD
Correlation Inverse = false
Display = true
Ratio
FREE

The MetaTrader 5 Position Indicator is a custom technical tool designed to enhance traders' ability to monitor and manage their positions effectively. It displays key trade details such as stop-loss (SL), take-profit (TP), groups them where they are the same, average buy price, and average sell price directly on the chart. Costs accounted for. Key Features:
Displays TP and SL levels
Groups TP and SL levels where they are the same
Shows average buy and sell price levels Candlestick countdown Pan
FREE
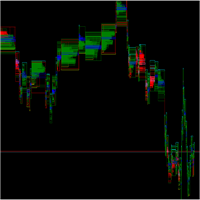
O SpreadFlow é um indicador para MetaTrader que gera um gráfico totalmente baseado no comportamento do fluxo de negócios, em vez de se limitar apenas a candles de tempo ou volume.
Ele organiza as informações de cada tick em quatro dimensões principais: Spread – monitora a diferença entre BID e ASK ao longo do tempo, mostrando momentos de compressão e alargamento do spread, associados a maior ou menor liquidez. Negócio no mesmo preço – identifica quando sucessivos negócios ocorrem no mesmo nível
FREE

The SpreadTracer and TimeLeft indicator is a powerful yet straightforward tool designed for traders who want to keep a close eye on market conditions directly on their chart. This custom indicator provides essential real-time information about the spread and candle time, making it easier to make informed trading decisions. Key Features: Current Spread Monitoring : The indicator constantly displays the current spread of the trading pair, helping you assess the cost of entering or exiting a positi
FREE
CFN - Multi MA & EMA Indicator for MT5 – with Alerts Take your chart analysis to the next level with the Multi MA & EMA Indicator for MetaTrader 5 – a versatile, efficient tool designed for traders who rely on Moving Averages and Exponential Moving Averages to interpret trends and make smarter trading decisions. Key Features: Supports up to 5 Moving Averages (MA) & 5 Exponential Moving Averages (EMA):
Easily plot and manage up to 10 customizable averages directly on your MT5 charts.
FREE

If you are Looking Best indicators in Mql5 Market. Check these out!
SSS Scalping Smart Signals MT5 Indicator
Scalping Winning Signals Pro SWS
LTL Long Trend Locator
UZFX The5ers Guardian PRO – The Ultimate Challenge Protection Dashboard for MT5 Pass your The5ers Challenge with confidence using the most advanced account monitoring dashboard designed specifically for The5ers traders . UZFX The5ers Guardian PRO is a professional MT5 indicator that continuously monitors your trading account, ca
FREE

Marks price gaps between the close of one bar and the open of the next. Open gaps are drawn as boxes that extend until price fills them; filled gaps can be hidden. Key features Calculated on closed bars, values do not repaint Works on any symbol and timeframe All periods, levels and colours can be changed in the inputs Light on resources with a maximum bars setting Objects are removed automatically when the indicator is deleted Inputs Gaps: Minimum gap size (points), Bars to scan, Show filled ga
FREE

Professional Support and Resistance Indicator This indicator was developed as a market context study and analysis tool , designed to help identify potentially relevant areas on the chart through the combination of price action, volume, and higher-timeframe market structure . The indicator displays two layers of horizontal dashed lines , positioned at areas considered relevant for analysis. This allows traders to observe different support and resistance zones and evaluate their relationship with
FREE
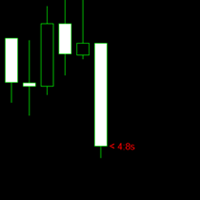
The purpose of the remaining time indicator on the K-line is to assist traders in gaining a deeper understanding of market dynamics and making more precise trading decisions, particularly in the realm of forex and binary short-term trading. The significance of this indicator and its application to various trading strategies will be thoroughly examined below: Enhancement of Trading Timing Accuracy - Precision: By displaying the remaining time of the current K-line cycle, traders can achieve great
FREE

Umagads Candle Timer MT5 Precision Timing for Disciplined Traders Umagads Candle Timer is a high-performance utility designed for MetaTrader 5 traders who demand absolute precision. In fast-moving markets, knowing exactly when a candle will close is the difference between a perfect entry and a missed opportunity. Whether you are scalping the M1 timeframe or swing trading on Daily charts, this tool puts the countdown exactly where you need it, ensuring you are always one step ahead of the next ma
FREE

Candle Countdown Pro – Multi-Timeframe Candle Countdown for MetaTrader 5 Candle Countdown Pro is a professional multi-timeframe indicator for MetaTrader 5 that displays the remaining time until the next candle closes across multiple timeframes simultaneously. The indicator features a clean and easy-to-read countdown panel directly on the chart and supports all major timeframes from M1 to W1 . This allows you to instantly see when the next candle will close on every selected timeframe. The panel
FREE

Chart Status Bar MT5 is a strictly read-only informational indicator that displays essential market, connection and symbol information directly on the chart.
The compact bar shows: • broker trading schedule and next session transition; • terminal connection status; • age of the latest tick; • current spread in points and pips; • remaining time of the current candle; • trading server time.
The DETAILS panel also shows: • symbol trade mode; • minimum, step and maximum volume; • stop and freeze
FREE
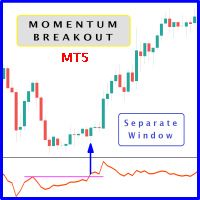
When prices breakout resistance levels are combined with momentum oscillator breaks out its historical resistance levels then probability emerges to record farther higher prices. It's strongly encouraged to confirm price breakout with oscillator breakout since they have comparable effects to price breaking support and resistance levels; certainly short trades will have the same perception. Concept is based on find swing levels which based on number of bars by each side to confirm peak or trough
FREE

This is a simple and lightweight indicator that displays the live spread of the trading instrument on the top left corner of the screen. It is built to be lightweight, performant and react to real time price feed. The spread is the difference between the Ask and Bid price of the trading instrument. This is the cost that the user needs to pay for immediate execution. It is crucial to know and track the spread to be aware of costs involved. In the standard accounts, the spread is the only cost you
FREE
One of the simplest Pivot Point indicator, easy to operate, and most complete for a single chart in determining Resistance and Support level lines.
In single chart, it will show R&S Level Line with 5 popular types of Pivot Point, Highest&Lowest of closing price Include the Trend and up to 3 Time Frames.
Five types (Floor, Woodie, Camarilla, DeMark, & Fibonacci) of popular Pivot Points in determining Resistance and Support levels. With just using simple button on the
FREE

Non-proprietary study of Joe Dinapoli used for overbought/oversold evaluation. Uses of Detrended Oscillator indicator Profit taking. Filter for market entry technics. Stop placement. Part of volatility breakout pattern. Determining major trend changes. Part of Dinapoli Stretch pattern. Inputs lnpPeriod: Perid of moving average Method: Calculation method ********************************************************************************* If you want to know market Overb
FREE
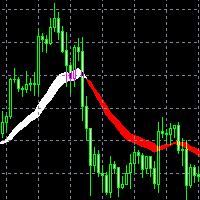
Индикатор Trade in trend предназначен для торговли по тренду. Сила тренда определяется шириной линии. Узкая линия - начало или конец тренда. Широкая линия свидетельствует о высокой силе тренда. Резкая смена ширины линии свидетельствует, с большой вероятностью, об окончании тенденции. Сигналы индикатора Не против покупки: переход с красной линии в белую цена отразилась от белой линии индикатора цена находится выше белой линии индикатора Не против продажи: переход с белой линии в красную цена отр
FREE

Description The Profit and Loss Indicator by Creative Tech Solutions is a robust and comprehensive tool designed to help traders monitor their trading performance in real-time. This indicator provides detailed metrics on profits and drawdowns, ensuring traders are always informed about their trading activities and performance. With customisable alerts and display settings, this indicator is an essential tool for any serious trader. Features Real-Time Metrics : Monitor profit and drawdown percent
FREE

The Volume Heatmap indicator visually shows the INTENSITY of the volume taking into account the concept of standard deviation. Purpose of the Indicator: High volumes are common where there is a strong consensus that prices will increase. An increase in volume often occurs at the beginning of a new upward trend in the price of an asset. Some technical analysts do not rely on trend confirmations without a significant increase in volume. Low volumes usually occur when an asset is heading for a down
FREE

The most sensitive indicator you've ever seen . . .
POscillator is a sensitive indicator to find each trend direction change in every timeframe. It shows price variations and reveals up or down trends. POscillator makes a price curve based on frequency filters. The procedure makes two price functions by using high-frequency and low-frequency filters separately. Then it adds them together to create a smoothed price curve. The final stage of the indicator converts this smoothed curve to an oscil
FREE

Swiss Holy Grail Indicator Motivation and functioning The HolyGrail indicator serves to optimize an entry. At that very moment I caught myself, that I went short in an uptrend, so I got into a trade in an anti-cyclical way. Or I have entered into a much too mature trend. This indicator should prevent such errors: One should always be aware of whether it is pro- or anticyclic entry, and one must always know about the maturity of the trend. Don't enter an old trend. Linda Raschke advises to buy th
FREE

*Used by MeditionSeed EA. Meditation is a practice in which an individual uses a technique – such as mindfulness, or focusing the mind on a particular object, thought, or activity – to train attention and awareness, and achieve a mentally clear and emotionally calm and stable state.[1][2][3][4][web 1][web 2] Plant a Meditation Seed to have wonderful future.
FREE

This indicator works by plotting fractals on the chart as arrows that can be used as buy or sell signals. It is a great tool for both new and experienced traders as it provides a clear visual representation of the market and helps traders identify fractals. Although it repaints, it can be used quite effectively in conjunction with other tools to filter trading strategies.
We use this indicator in this way in our Royal Fractals EA, which you can purchase on the MQL5 Market: https://www.mql5.com
FREE

Калькулятор размера позиции в виде индикатора. Для тех случаев, когда использование стандартных советников для расчета риска невозможно. Два режима работы: Маркет и Отложенные ордера. Передвигаете линию SL и получаете необходимый объем позиции согласно настройкам риска. Только показывает информацию, сделки сам не открывает. Для корректной работы следует добавить все Major пары в Market Watch.
FREE

Your balance tells you where you are. It does not tell you how close you came to the edge.
Kingdom Guard is a free, read-only panel that puts the numbers that actually decide survival on your chart:
REAL DRAWDOWN, RIGHT NOW How far your equity sits below its own historical peak - not below your deposit. The single number most traders never watch.
YOUR LOSING STREAK - CURRENT AND WORST EVER When you are four losses deep it matters enormously whether your worst streak was five or fifteen. Know
FREE

️ Aviso de Risco Negociar no mercado financeiro envolve riscos significativos. Esta ferramenta é um auxílio à tomada de decisão e não garante lucros. Opere com responsabilidade e sempre com gerenciamento de risco adequado.
O painel do indicador MACD utiliza como base uma das três possíveis configurações a seguir : 1. Cruzamento das Linhas (MACD x Linha de Sinal); - Sinal de Compra (Alta): Ocorre quando a Linha MACD cruza de baixo para cima a Linha de Sinal. - Sinal de Venda (Baixa): Ocorr
FREE

Advanced Trend Builder is a trend indicator using the original calculation algorithm. ATB can be used on any data and timeframe. My recommendation use for calculation numbers 4 - 16 - 64 - 256 and so on ..., but this is only recommendation. The middle of the trend wave is a special place where market behavior is different, when developed ATB was main idea to find the middle of the wave trend. Input parameters: Bars will be used for calculation - number of bars used for a trend line calculation.
FREE
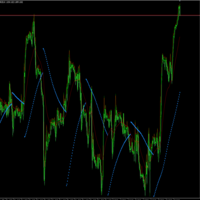
La idea de este indicador es la siguiente: reemplazar los precios High, Low del indicador SAR por los valores del indicador Moving Average. Al final tendremos la siguiente imagen:
Es decir, el indicador SAR cambia su dirección después de tocar el indicador Moving Average.
Parámetros de entrada SAR: Step - parámetro "Step" del indicador SAR; SAR: Maximum - parámetro "Maximum" del indicador SAR; MA: Period - parámetro "período de promediación" del indicador MA; MA: Shift - parámetro "des
FREE

Sniper Spread Monitor v1.0 ¿Qué es el Spread y por qué es vital monitorearlo? En el trading, el Spread es la diferencia entre el precio de compra ( Ask ) y el precio de venta ( Bid ). Es, en esencia, el costo inmediato que pagas al bróker por abrir una operación. Para un trader de precisión, el spread no es solo un número; es un factor crítico por tres razones: Costo de Ejecución: Un spread alto significa que empiezas la operación con una pérdida mayor. En estrategias de scalping o entradas prec
FREE
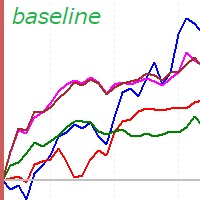
This is a rate of change chart from the baseline. features. comparison of max 5 symbols. free baseline with drag. free timeframes of the sub window. reverse chart selectable if you need.
i.e. set symbols "-US100" notes In the sub window, you can't believe datetime on the chart, because the numbers of bars are different. You can check the baseline if you click symbol name. The dragged baseline is temporary. You must set it to indicator's parameter if you need.
FREE
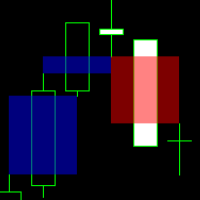
This indicator identifies and highlights market inefficiencies, known as Fair Value Gaps (FVG), on price charts. Using a custom algorithm, the indicator detects these areas of imbalance where the price moves sharply, creating potential trading opportunities. Indicator Parameters: Bullish FVG Color (clrBlue) : Color used to highlight bullish inefficiencies. The default value is blue. Bearish FVG Color (clrRed) : Color used to highlight bearish inefficiencies. The default value is red. Bullish FVG
FREE

RSI Level Alert SM — это компактный фоновый индикатор для MetaTrader 5, который автоматически отслеживает выходы цены в зоны перекупленности и перепроданности по осциллятору RSI и сразу предупреждает трейдера. Принцип работы и преимущества: Индикатор работает бесшумно в фоновом режиме и не загромождает график визуальными элементами. Как только закрывается свеча, на которой RSI пересекает заданные пороги, утилита выдает сигнал. Это освобождает от необходимости постоянно дежурить у монитора и по
FREE

Wave123 BOS Indicator (XAUUSD M15 Optimized) Wave123 BOS Indicator is a modern, chart-based Break of Structure (BOS) + Breakout (BO) visualization tool built for traders who want clear market structure signals directly on the chart — with a strong focus on XAUUSD (Gold) on the M15 timeframe . Gold moves fast and often breaks structure with sharp impulses and quick retraces. This indicator is designed to highlight those moments clearly, so you can trade with better direction, timing, and confiden
FREE
Higher Timeframe Chart Overlay will display higher timeframe candles, including the number of candles high/low you specify.
You no longer need to switch timeframes to check the candles. Everything can be shown in one chart. Get Full Version - https://www.mql5.com/en/market/product/115682 Please feel free Contact me if you have any questions regarding this tool.
FREE
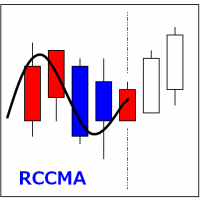
RCCMA is a general moving average indicator that works with ReviewCandleChart. Original is "Custom Moving Average" provided by MetaQuotes Software Corp. Based on that source code, I corresponded to ReviewCandleChart .
Advantages When ReviewCandleChart is ON, no line will be displayed on the right side from the vertical reference line. When ReviewCandleChart is ON and you press a key such as "Z" or "X" Following that, the MA is drawn. When ReviewCandleChart is OFF, the same drawing as the origin
FREE

The Smart Trend Tracker (OTT) is a technical analysis tool designed to help traders identify the direction and strength of a market trend. This indicator functions as an optimized moving average that adapts to market volatility, thereby providing dynamic support and resistance levels. The primary goal of the OTT is to smooth out price action and offer visual cues about potential changes in the trend. Core Components of the Indicator When you add the indicator to your chart, you will see two main
FREE

Add Logo Watermark – Showcase Your Signals with Clarity This indicator allows you to display a clean and customizable watermark on your chart, helping your audience easily identify what symbol you're currently trading. Display the current symbol as a watermark
Add current symbol text and customize its color
Choose to show only the logo, only the symbol, or both
Add your own custom watermark by placing custom.bmp in the MQL5 > Files directory Perfect for signal providers, educators, and
FREE

Ultra Momentum Advanced Directional-Force Market Analyzer Ultra Momentum is a professional momentum indicator engineered to detect the market’s true speed and directional dominance . It combines the classic Momentum calculation with an adaptive multi-period structure and high-quality algorithmic smoothing to deliver a noise-resistant, market-contextual view of momentum. Unlike standard oscillators, Ultra Momentum does more than measure a simple price difference: it analyzes the coherence of m
FREE
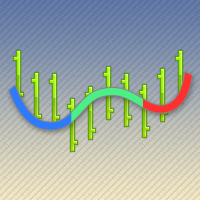
The ColorLine indicator shows the line of the price moving average on the chart. The line has diffrent colors (100 bars have the same color). The color settings of the line is changing every 5 ticks, there are 3 color schemes. Indicator for demonstrating the DRAW_COLOR_LINE style. Draws a line at Close prices in colored pieces of 20 bars. The thickness, style and color of the line sections are changed randomly. The indicator code is published in the MQL5 Documentation in the section Indicator S
FREE

The Missed Opportunity Analyzer is a professional historical analysis tool that identifies and visualizes high probability trading opportunities you missed in the past. Unlike predictive indicators, it provides 100% non-repainting hindsight analysis to help you study price behavior, refine your strategy, and improve your trading discipline. Core Concept The indicator scans historical data to find confirmed price swings where:
Price moved to your target (TP) before hitting your sto
FREE
The MetaTrader Market is a simple and convenient site where developers can sell their trading applications.
We will help you post your product and explain you how to prepare your product description for the Market. All applications on the Market are encryption-protected and can only be run on a buyer's computer. Illegal copying is impossible.

You are missing trading opportunities:
- Free trading apps
- Over 8,000 signals for copying
- Economic news for exploring financial markets
Registration
Log in
You agree to website policy and terms of use
If you do not have an account, please register