 MetaTrader 5
 Experts
 Indicators
 Libraries
 Utilities
 Widgets
 Rules
Watch the Market tutorial videos on YouTube
How to buy а trading robot or an indicator
Run your EA on
virtual hosting
virtual hosting
Test аn indicator/trading robot before buying
Want to earn in the Market?
How to present a product for a sell-through
Free Technical Indicators for MetaTrader 5 - 51
 Signals from technical indicators play a crucial role in opening and closing deals on stock and Forex markets. The essence of indicators is a mathematical transformation of a financial symbol price aimed at forecasting future price changes.
Test technical indicators to better predict market behavior and profit from it.

IBS Pro — Internal Bar Strength Indicator IBS Pro is a clear and adaptable MetaTrader 5 indicator designed to show the strength of a market close within its recent trading range. Its scale runs from 0 to 100. Readings near 0 suggest that price is closing close to the lower part of the range, while readings near 100 suggest that price is closing near the upper part. Values around 50 indicate a more balanced market condition. The indicator can analyze the range of one candle or several candles, he
FREE
This indicator is EXCLUSIVELY to be used on the Brazilian stock exchange "B3". It automatically calculates the yesterday's Settlement Price (Ajuste) of the Symbol "DOL". It uses a mathematical calculation over the ticks received from the borker server, it DOES NOT access external sources (websites, HTTP connections, etc) so it is safe and totally reliable! For practical purposes and to maintain the longevity of the indicator it was added in the Parameters the ability to control the Time Range in
FREE

Product Description Clean, Smart Sessions is a professional trading sessions indicator designed to provide traders with a clear, accurate, and clutter-free view of the active market sessions directly on the chart. The indicator dynamically detects and displays the active trading session (Asian, London, and New York) in real time, drawing a clean session box that continuously updates to reflect the session’s true high and low. When sessions overlap, each active session is handled independently
FREE

Pivot RSI Indicator – Pivot Points, RSI with Divergence Detection, and Automatic Trend Lines Pivot RSI Indicator is a technical analysis tool that combines three concepts into a single indicator: Pivot Points, RSI momentum analysis, and automatic swing-based trend lines with divergence detection. Pivot Points (Multi-Timeframe) The indicator displays the Pivot Point (PP) along with Support and Resistance levels (S1-S3, R1-R3). Pivots are calculated from a timeframe selected by the user (H1, H4,
FREE

交易数据分析助手 : 这是一款交易数据统计分析工具,数据图表较多可供分析参考 . 语言: 支持语言的选择切换(目前支持中文和英文 主动识别不用人工选择) 主窗口显示: 余额显示 总盈亏显示 现在持仓盈亏金额显示 现在持仓盈亏比例显示 买单卖单总单量,总手数,以及盈亏情况显示. 仓位使用比例显示 按照目前持仓能够承受的亏损点数预计 (点击右下角可缩放)每日订单单量,手数,盈亏情况统计 (点击右下角可缩放) 当周盈亏数据
(点击右下角可缩放) 当月盈亏数据
(点击右下角可缩放) 当年盈亏数据
交易数据统计区: 详细订单统计,(可以选择按日,周,月,季度,年)(按品种,识别码)(现有持仓详细统计) 盈亏/手数/交易次数 柱状图 多/空持仓时间/获利水平情况 多货币盈利次数/盈利水平分布情况 余额净值曲线/余额曲线/盈利曲线等(注:加载余额净值曲线可能需要一定的数据处理时间,请耐心等待加载完成...) 每次订单盈亏利润柱状图 多货币对盈利曲线图 数据统计分析报告 关于版本更新 有任何问题,建议,欢迎交流.
FREE

Catalyst Indicator Catalyst Indicator is a MetaTrader 5 technical-analysis indicator designed to help users study price movement, momentum, and multi-timeframe market conditions. It is intended for chart analysis, education, and technical confirmation across different instruments supported by the user's broker. Core idea The indicator combines moving-average behavior, momentum readings, and multi-timeframe observation to help users build a clearer view of market structure. It is especially usefu
FREE

Hi traders, HiperCube i glad to present you a new indicator MTF MA! Discount code for 25% off at Darwinex Zero: DWZ2328770MGM HiperCube Multi-Timeframe Moving Average or MTF MA is an indicator that permit you display the MA from higher timeframe y other lower, so simple.
Features:
Select Timeframe from a dropdown menu Custom Period MA Custom MA type(EMA,SMA...) Custom Color of MTF MA Chat GPT and AI was used to develp it Conclusion
HiperCube MTF is a simple but usefull innicator that pe
FREE

The indicator shows round levels on the chart. They are also called psychological , banking, or levels of major players. At these levels, there is a real fight between bulls and bears, the accumulation of many orders, which leads to increased volatility. The indicator automatically adjusts to any instrument and timeframe. When the level 80 is broken through and then tested, we buy. When level 20 is broken through and then tested, we sell. The target is 00. Attention. Due to
FREE

Market Sessions HUD Pro turns any chart into a clear, professional session map. See exactly which market is open, how far it has moved, when the next one opens — plus elegant session zones with a fully configurable opening range. Built to look great on any broker and any timeframe, with real Daylight Saving handling so your sessions are always on time. Real-time HUD panel Active session name in its own color, with a live server clock Session progress bar (% elapsed) and countdown to the next
FREE

Chaikin Money Indicator (CMF) – Free Trading Indicator
The Chaikin Flow Indicator (CMF) is a technical analysis tool based on the original Chaikin Money Flow (CMF) indicator, developed by Marc Chaikin in the 1980s. It is designed to track capital flows into an asset and helps identify buying and selling pressure. This indicator is useful for both intraday trading and medium-term analysis .
How CMF Works CMF analyzes price action and volume over a given period by calculating the Money Flow Mult
FREE

Session Highlighter V3.0F – Market Session Visualizer Overview The Session Highlighter is a professional MT5 indicator that automatically displays colored backgrounds for the three major trading sessions: Asia, London, and US . No more guessing when sessions open or calculating time zones – just look at your chart and see. What it does Draws three separate boxes on your chart (one for each session) Boxes grow dynamically with price during the session (highest high / lowest low) To
FREE

Momentum Maxwell V1 PRO: The Sniper Hybrid Energy Momentum Maxwell V1 PRO no es un oscilador convencional; es una herramienta de precisión balística diseñada para el trader que opera como un francotirador . Mientras que los indicadores estándar se pierden en el ruido del mercado, el Maxwell V1 PRO utiliza un motor de triple filtrado de energía para detectar el agotamiento del precio con una nitidez quirúrgica. A diferencia del RSI o el Estocástico, que confinan sus datos en una escala artificial
FREE

Overview
Asian Session Anchor Profile is a technical indicator for MetaTrader 5. It calculates reference levels from the Asian trading session and displays them on the chart. The levels remain visible during the following sessions and are updated as new data arrives.
The indicator is an analysis tool. It does not open trades and does not provide buy or sell signals.
Displayed elements
The indicator draws the following elements on the chart:
1. Asian session range, shown as a rectangle betw
FREE

Adaptive Moving Average Gradient Indicator This indicator combines the responsiveness of Kaufman's Adaptive Moving Average (KAMA) with gradient analysis to identify momentum shifts and trend strength in real-time. Key Benefits: The gradient of the KAMA provides a dynamic measure of trend acceleration and deceleration, automatically adjusting to market volatility. Unlike standard moving averages, KAMA adapts its sensitivity based on price efficiency, making the gradient measurement more reliable
FREE

EMA Offset Bands is a MetaTrader 5 indicator that plots a central EMA surrounded by percentage-based offset bands. The bands act as dynamic support and resistance that adjust automatically as the EMA moves. Features Central EMA trend line as the directional anchor. Percentage offset bands: upper and lower bands set as a percent of the EMA, so they scale with price. Dynamic support/resistance: the bands move with the market instead of being fixed lines. Simple, clean overlay that works on any sym
FREE
Descubre el poderoso aliado que te guiará en el laberinto de los mercados financieros. Este indicador revolucionario te llevará de la incertidumbre a la claridad, permitiéndote identificar con precisión los puntos de inflexión del mercado. Mejora tus decisiones de entrada y salida, optimiza tus operaciones y ¡multiplica tus ganancias con confianza.
¡Para más información, te invitamos a unirte a nuestro canal de Telegram en https://t.me/Profit_Evolution ¡Allí encontrarás contenido exclusivo, an
FREE

Trend indicator based on the ADX / ADXWilder indicator
The indicator shows trend areas using ADX or ADXWilder indicator data.
How the indicator works: if PDI is greater than NDI, then it`s bullish movement; if PDI is less than NDI, then it`s bearish movement; if ADX is less than or equal to the filter value specified in the parameters, then there is no movement state.
Input parameters of the indicator: Calculate Timeframe - timeframe for calculation; ADX Type - type of ADX calculation based
FREE

WANT TO AUTOMATE THESE ZONES? Stop waiting for setups! The Smart SR Levels Sniper EA is now live. It reads these exact indicator zones, filters for high-probability "thin" zones , auto-calculates your risk , and targets the next SR levels for Take Profit . It can even scan all your open charts at once! Stop guessing where the market will turn. Let the volatility tell you. Smart SR Levels Sniper EA https://www.mql5.com/en/market/product/165191
LogicLadder SR Zones
------------------------
FREE

Trend Quality Filter Market Structure Overview Trend Quality Filter Market Structure visualizes the currently identified market condition directly below the chart. Each evaluated candle is assigned to one of four phases according to a fixed market-structure logic. This provides traders with a clear additional classification of previous price behavior without generating buy or sell signals. What This Indicator Does The indicator analyzes the existing price structure and displays the resulti
FREE
Is Zero Lag profitable? Not always, different system is for different pairs. You can play around with this indicator from Mladen, I have modified it with Bollinger Bands over T3.
You can change the period and how it calculate. MT4 version soon will be released too. Please leave a review , it helps us and we will share more indicators. .... Thank you and happy trading
FREE

RBM ATR PRO v1.10 Quem opera mercado volátil sabe como é ruim tomar stop por causa de uma violinada de pavio e ver o preço andar forte a favor logo depois. O RBM ATR PRO foi desenvolvido exatamente para resolver isso. Ele evolui o indicador clássico de volatilidade combinando a leitura do ATR com dois níveis independentes de suavização. A linha no gráfico fica limpa e objetiva: verde para estrutura de alta e vermelha quando o mercado vira para a baixa. Funciona perfeitamente para rastrear a ten
FREE
Developed by smart2trader.com
The Didi Index Nuvem Indicator is an indicator based on the original Didi Aguiar (Didi Index) indicator, featuring two visualization methods for the moving averages: as a cloud or as lines (original). This customization offers a new way to visualize the moving average crossovers in the Didi Index indicator. About the Didi Index Indicator The Didi Index Indicator , created by Brazilian trader Didi Aguiar, is a technical analysis tool based on the crossover of three
FREE
Fibonacci Timing Indicator by Quant Atlas Creator: https://www.quant-atlas.com/ Fibonacci Timing Indicator is a clean signal based trading tool designed to identify potential turning points through a timing sequence framework inspired by Fibonacci spacing. The indicator studies price behavior across selected historical reference points and looks for repeated directional pressure. When the sequence reaches completion, it plots a clear signal directly on the chart. Signal Display • Green upward t
FREE
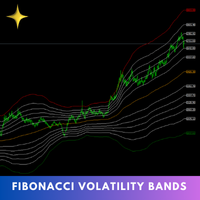
The Fibonacci Volatility Bands indicator is a refined tool designed to enhance your market analysis by integrating Fibonacci retracements with the Bollinger Bands concept. This indicator visually highlights potential areas of support and resistance, providing traders with a clearer understanding of price fluctuations and volatility. MT4 Version - https://www.mql5.com/en/market/product/126421/ The core of the Fibonacci Volatility Bands is built around a Volume Weighted Moving Average (VWMA) that
FREE

Every trader knows the ritual: open the indicator settings, change a number, click OK, squint at the chart, decide it is wrong, open settings again. The Money Flow Index has only one number to set -- the period -- but that single trip through the dialog still costs you the same squint-and-guess cycle every time you want to compare 14 against a shorter or longer read on your own symbol. MFI Live Tuner ends that. It is a Money Flow Index that you tune directly on the chart, live . A small panel si
FREE

Have you ever noticed that the ADX on your chart does not match the numbers in the books? There is a reason. The standard built-in ADX uses exponential smoothing -- the true Wilder-smoothed version, the one Welles Wilder actually published, ships only as a separate indicator that most traders never load. ADX Live Tuner gives you the textbook Wilder ADX by default, and adds the Live Tuning workflow on top. It is a full three-line ADX (+DI, -DI and the ADX line) that you tune directly on the chart
FREE

Spread Times Histogram and Stats is a spread monitoring indicator for MetaTrader 5. It plots a real-time color-coded histogram of broker spread, tracks a rolling 24-hour average, and fires smart alerts when spread exceeds a configurable dynamic threshold.
Key Features
- Color-coded histogram: green when spread tightens, red when it widens - Rolling 24-hour average line for ongoing context - Session statistics: minimum, maximum, and average spread for the current session - Smart alert system: f
FREE

Key Features of this Version: Multi-Timeframe (Vertical Stack): It creates 5 distinct units on the left side of the chart for M5, M15, M30, H1, and H4. Segmented Power Meter: The center bar uses a "grille" technique (drawing small background-colored lines over the fill) to create the segmented LED look from your image. Live Market Data: Price: Shows the current Bid price at the top of each box. Spread: Shows the live spread at the bottom of each box. Strength %: Calculates a weighted a
FREE

Overview Quick Chart Control Panel is a compact, modern-looking toolbar that sits in a corner of your chart and gives you instant control over the most common chart display options. Instead of opening the chart properties dialog (F8) or digging through menus, you can switch things on and off with a single click. The panel is designed with performance in mind. It does no work on incoming ticks and updates only what has actually changed, so it can stay attached to every chart you use without slowi
FREE

Bollinger Bands Advanced Suite for MetaTrader 5 Take the classic power of Bollinger Bands and supercharge it with institutional-grade precision and a professional, multi-channel alert system. The Bollinger Bands Advanced Suite is not just another moving average envelope; it is a complete volatility analysis tool designed for the modern MetaTrader 5 trader. Whether you are a breakout trader, a mean-reversion specialist, or use bands for dynamic support and resistance, this suite provides the c
FREE
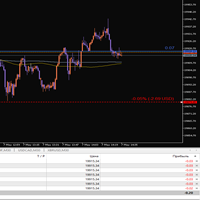
This indicator is designed for visual risk management and monitoring of open positions on the chart. It automatically calculates and displays: The average entry price for all open positions of the current instrument. The total volume of positions. A horizontal Stop Loss line, which can be moved manually. The potential loss if SL is triggered – both as a percentage of the account balance and in the account currency.
FREE

โครงสร้างตลาด ZigZag (ความลึก 30) – คําอธิบาย + การตั้งค่า อินดิเคเตอร์นี้ใช้หาโครงสร้างตลาดแบบ: HH (Higher High) = ยอดสูงขึ้น → แนวโน้มขึ้น HL (Higher Low) = ยกฐาน → แนวโน้มยังขึ้น LH (Lower High) = ยอดต่ําลง → แนวโน้มลง LL (Lower Low) = ทําโลว์ใหม่ → แนวโน้มลงชัด ใช้ร่วมกับ ZigZag เพื่อ "คัดเฉพาะสวิงใหญ่" ไม่มั่ว หลักการทำงาน ZigZag จะหา "จุดกลับตัว" ตามค่า Depth เอาจุดเหล่านั้นมาเปรียบเทียบ: สูงกว่าเดิม → HH ต่ํากว่าเดิม → LH โลว์สูงขึ้น → HL โลว์ต่ําลง → LL แสดง label + เส้นแนวนอน
FREE

TrueUSD Candles is a multi-currency analytical indicator for MetaTrader 5 that plots a real-time candlestick chart of the US Dollar (USD) in a separate window and uses macro-triangulation to separate genuine US economic momentum from European market movements. The primary goal of this indicator is to eliminate the structural flaw of the classic US Dollar Index ( DXY ), which is weighted 57.6% toward the Euro (and 77.3% toward European currencies overall). Because of this heavy imbalance, any is
FREE

Gold Daily Analysis Engine
Gold Daily Analysis Engine is a MetaTrader 5 indicator designed for XAUUSD daily structure analysis.
The indicator helps traders observe daily gold movement through structure levels, daily range behavior, liquidity sweep conditions, reaction zones, and a simple market status panel. It is a manual decision-support tool and does not place trades automatically.
Overview
Gold can move quickly during active market sessions. This indicator is designed to organize the da
FREE

H4 CONTAINER MTF BOXES (MetaTrader 5) | //| | //| One H4 container box holds every H1, M30, M15, M5 and M1 box | //| that falls inside it. Each inner timeframe has its own on/off | //| switch. | //| | //| LEVELS | //|
FREE
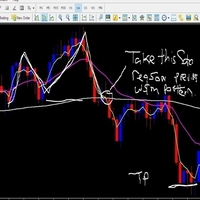
About. This indicator is the combination of 3 Exponential Moving averages, 3,13 and 144. it features Taking trades in the direction of trend, and also helps the trade to spot early trend change through Small moving averages crossing Big Moving averages Product features 1. Have built in Notification system to be set as the user desires (Alerts, Popup notification and Push Notification to Mobile devices) so with notification on, you do not need to be at home, or glued to the computer, only set and
FREE
SizeInPips Indicator – Visualize Candle Size with Ease!
Unlock the power of price action analysis with the SizeInPips Indicator ! This simple yet powerful tool is designed for traders who want to quickly measure and visualize the size of each candle (bar) in pips, helping you make informed trading decisions with confidence. Whether you're a beginner or an experienced trader, SizeInPips is the perfect addition to your MetaTrader 5 toolkit.
What Does It Do? The SizeInPips Indicator calculates
FREE
The DR IDR Range Indicator plots ADR, ODR and RDR ranges for a given amount of days in the past. A key feature that appears is that it calculates the success rate of the ranges for the shown days. This indicator is perfect for backtest since it shows ranges for all of the calculated days, not just the most recent sessions. PRO VERSION
https://www.mql5.com/en/market/product/93360 Remember: this free version counts neutral days as true days , so stats might be slightly inflated. To get perfect a
FREE
“Turn second‑chart noise into actionable signals.” This tool generates a true second‑based chart (1‑second candles) inside a sub‑window—something MT5 cannot display by default—and equips it with a CCI Engine engineered specifically for second‑level price action . It is a high‑precision trading tool built for ultra‑short‑term decision making. Concept In FX scalping and binary options, waiting for a 1‑minute candle to close often means you’re already too late. This tool condenses a micro‑level
FREE

Market Strike SignalBox Market Strike SignalBox is a clean visual indicator that draws structured trade zones directly on the chart: Entry , Stop Loss , TP1 , and TP2 .
It is designed for traders who want a fast, “at-a-glance” view of potential setups without complicated dashboards. This product is NOT an Expert Advisor and does not open/close trades . It provides visual signals only . What You Get on the Chart When a valid signal is detected, the indicator will display: Entry level Stop Loss (S
FREE

How to Read EOS AI EOS AI is designed to make its current market assessment easy to understand from one compact dashboard. The panel gives you three main pieces of information:
BUY Probability – the neural model's current bullish assessment SELL Probability – the neural model's current bearish assessment Signal – BUY, SELL or WAIT after the required confirmation rules are applied
The probabilities provide context, while the final signal applies the additional confirmation logic. This means the
FREE

STO & ZeroMax System: A Revolutionary Algorithm for Precise Exit and Maximum Profit Tired of losing your profits to the market during deep corrections? Tired of guessing where to close a trade to capture maximum momentum instead of exiting prematurely?
Introducing STO – a highly accurate basement phase and momentum oscillator, part of the ZeroMax professional trading system. This next-generation analytical tool is designed for traders who need absolute precision when taking profits and iden
FREE

Bollinger Breakout with Stop-Loss Levels Description This indicator tracks breakouts of the upper and lower Bollinger Bands and automatically displays dynamic entry lines and stop-loss levels on the chart. The lines dynamically extend to the current candle, allowing visual tracking of signal relevance. Key Features 1. Color Coding Upper Breakout (BLUE) – buy signal (bullish breakout) Lower Breakout (RED) – sell signal (bearish breakout) 2. Dynamic Lines Breakout and stop-loss lines autom
FREE
Slightly changed for speed. testers are required for a new adviser, who is interested, write to me by e-mail 777basil@mail.ru https://backoffice.aurum.foundation/u/DHXP1U
The indicator is calculated based on price changes in the history and is calculated mathematically, recalculated each time the data is received again. It can be used on different timeframes. From the borders of the indicator in 70% there is a change in the direction of price movement, or consolidation. In this way, you can tr
FREE

We, at Stonehill Forex are posting our first homegrown indicator, which was profiled on the Stonehill Forex website in March ‘25. The original version was coded for MetaTrader 4 (MT4) and subsequently coded for MT5 and TradingView, based on community interest. This first one comes to you at no cost and thus, begins our library.
It’s a two lines cross price overlay which, at its heart, uses two weighted moving average lines run through a very sleek filter. The result calls out pretty accurat
FREE

Every trader knows the ritual: open the indicator settings, change a number, click OK, squint at the chart, decide it is wrong, open settings again. The Relative Vigor Index has only one number to set -- the period -- but that single trip through the dialog still costs you the same squint-and-guess cycle every time you want to compare 10 against 14 on your own symbol. RVI Live Tuner ends that. It is the classic two-line RVI (RVI and its Signal) that you tune directly on the chart, live . A small
FREE

Triple Trend Core (EMA 50, 100, 200): * Dynamic trend tracking across three timeframes. * Ultra-thin visualisation to avoid overlapping with candlesticks. Thermal Fibonacci Retracement (Dynamic Heat Map): * Temperature Levels: Retracements are intuitively coloured. Shallow levels (0% - 23.6%) in Red/Orange indicate high-tension zones and quick continuation, while deep levels (76.4% - 100%) in Blue signal cooling zones or extreme value. * Dynamic Adaptation: Automatically calculates the maximum a
FREE

ADX Trend Strength Multi-Timeframe Dashboard shows how strong the trend is and in which direction, on four timeframes at once, using ADX together with the Directional Indicators. It answers the question that decides which tools to trust: is the market trending strongly or simply ranging. By default it reads the M15, H1, H4 and D1 timeframes, and the period and the strong threshold are configurable. Each timeframe appears in green for a strong up move, red for a strong down move and grey when the
FREE

Explosion Signal Indicator analyzes the market for sharp changes in volatility and volume that often precede significant price movements. The indicator uses the ratio of short-term and long-term ATR to assess current volatility relative to the average level. Simultaneously, it monitors current volume compared to the average over a specified period.
When the volatility or volume exceeds the defined thresholds, the indicator determines the direction of movement through momentum calculation — the
FREE

This indicator is a zero-lag indicator and displays exact trend as is. True Trend Moving Average Pro works best in combination with True Trend Oscillator Pro that displays strength of trend change.
True Trend Oscillator Pro: https://www.mql5.com/en/market/product/103589
If you set PERIOD input parameter to 1 this indicator becomes a sharpshooter for binary options.
Default input parameters: TT_Period = 10; TT_Meth = MODE_SMA; TT_Price = PRICE_MEDIAN;
Before you buy this product, please do t
FREE
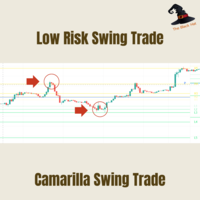
Camarilla Swing Trade Indicator is an Indicator. Support and resistance points are calculated from the High Low Close of the previous TF Week's price.
What are Camarilla Pivot Points?
1.Camarilla Pivot Points is a modified version of the classic Pivot Point. 2.Camarilla Pivot Points was launched in 1989 by Nick Scott, a successful bond trader. 3.The basic idea behind Camarilla Pivot Points is that price tends to revert to its mean until it doesn't. 4.Camarilla Pivot Points is a mathematical pr
FREE

This is a dedicated trading auxiliary tool for the MT5 platform, with the core function of automatic counting and labeling of candlesticks within a custom trading session . It adapts to overnight trading scenarios and broker time differences (summer/winter time), features a lightweight design and flexible configuration, and eliminates manual candlestick counting to improve chart analysis efficiency. Core Features Customize the opening and closing time of the trading session in Beijing Time, sup
FREE
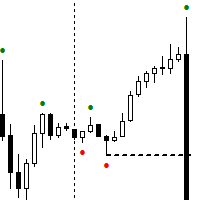
Next Arrival : Flip or Die Trading Arena. Flip a trading account: https://flipordie.com/chapter-1-thirteen-doublings-double-a-trading-account/
The Expert Advisor for this Indicator can be found here: https://www.mql5.com/en/market/product/115567 The Contraction/Expansion Breakout Lines with Fair Value Gaps (FVGs) Indicator for MetaTrader 5 (MT5) is a powerful technical analysis tool designed to help traders identify and visualize breakouts at critical levels of contraction and expansion in fi
FREE

Draw Order Blocks – Channels and Market Structure Manual
-A simple tool for drawing precise channels on Order Blocks or any area you choose. It offers three drawing modes: full candle, wick only, or body only, each with a 50% level. It also includes "BOS" and "CHoCH" lines with two-level confirmation: one checkmark on wick break and two checkmarks on candle close-
FREE
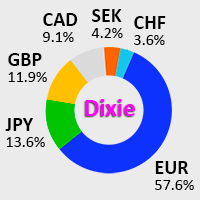
IDixie is an indicator which shows open and close values of the American dollar index, DXY or "Dixie". The indicator is calculated from weighted values of 6 major symbols: EURUSD, USDJPY, GBPUSD, USDCAD, USDSEK, and USDCHF. In addition to "Dixie" values, the indicator also shows a moving average. You can set the period of the moving average. When bars of the indicator break through the moving average, this creates good opportunities to enter the market. As a rule, signals from this indicator are
FREE

ATRRange-MT5-Ind — an indicator for MetaTrader 5 that builds volatility channels based on ATR with three multiplier levels. Indicator: Calculates ATR — uses the standard Average True Range Draws three channels around the closing price: Top1/Bottom1 (blue) — Close ± ATR × Multi1 Top2/Bottom2 (orange) — Close ± ATR × Multi2 Top3/Bottom3 (red) — Close ± ATR × Multi3 Dynamic levels — channels automatically expand/contract depending on volatility Parameters ATR Period : ATR period Default: 14 Multi1
FREE
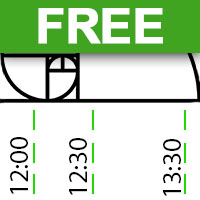
Simple indicator to calculate fibonacci retracement levels on time. Add to chart and move trend line to set the fibonacci retracement levels. Inputs Levels - levels for which to calculate values, separated by space, default are fibonacci levels Show time - if true, time will be shown on levels Show date - if true, date will be shown on levels Show fibonacci level - if true, value of levels will be shown Fibonacci lines color - color of levels Trend line color - color of trend line which de
FREE

One line showing where every open trade on this symbol, taken together, comes out flat. Scale into a position five times and the line tells you the price you need back, with the live P&L beside it. It is the break-even, not the average entry Averaging the entry prices is not the price that makes you flat. Swap accrues nightly and commission is charged on every lot, so the real break-even sits above the average entry on a long book and below it on a short one, and it drifts as swap builds. This s
FREE
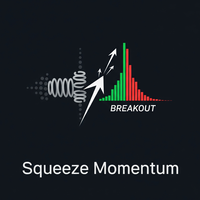
1. Introduction The Squeeze Momentum Plus is a powerful technical analysis tool designed to help traders identify periods of low market volatility (the "squeeze" phase) and assess the direction and strength of price momentum . This indicator combines the principles of Bollinger Bands and Keltner Channels to detect changes in market volatility, along with a momentum oscillator to measure buying/selling pressure. 2. Key Components of the Indicator The Squeeze Momentum Plus is displayed in a separa
FREE

DiNapoli DMAs (Displaced Moving Averages) The DiNapoli DMAs indicator brings the world-renowned Displaced Moving Averages, popularized by legendary trader Joe DiNapoli, to MetaTrader 5. Unlike conventional moving averages, the forward displacement (shift) helps filter out market noise and reduce whipsaws, allowing traders to identify trends and support/resistance levels with much higher clarity. This indicator plots the three classic DiNapoli combinations: 3x3: 3-period Simple Moving Average, di
FREE

Sandwich Candle Scanner Pro Sandwich Candle Scanner Pro is a high-precision price action tool specifically engineered to detect Sandwich (Three-Method) candlestick patterns automatically. This indicator is a powerful asset for traders focusing on high-probability reversals and trend continuations, particularly effective on volatile assets like XAUUSD (Gold) , Indices, and Major Forex pairs. Stop hunting for patterns manually. Let this professional scanner do the heavy lifting, ensuring you never
FREE
In the world of finance, correlation is a statistical measure of how two securities move in relation to each other. Correlations are used in advanced portfolio management. This indicator measures how different securities move in relation to a reference one, thus making portfolio management easier. [ Installation Guide | Update Guide | Troubleshooting | FAQ | All Products | Get Help ] Avoid concurrent trades in highly correlated instruments Find trading opportunities among highly correlated
FREE

VWAP WAVE [Riz] - MT5 Indicator Advanced VWAP Divergence Detection System
VWAP Wave is a professional-grade Volume Weighted Average Price indicator with built-in divergence detection system. It identifies high-probability reversal and continuation signals by analyzing price-VWAP relationships across multiple timeframes.
FREE

http://www.tradepositive.lat
ALGO Smart Flow Structure Indicator The ALGO Smart Flow Structure Indicator is designed for serious traders who use objective Market structure. Forget noise and slow indicators; this tool provides you with a crystal-clear, unambiguous view of structural breakouts across all timeframes. Based on the rigorous rules of the ALGO Smart Flow methodology, the indicator filters out internal structure and only shows you the Major Structural Points (Swing Points) , ensuri
FREE

RaysFX Pattern Detector è uno strumento di analisi tecnica all'avanguardia progettato per i trader che basano le loro decisioni sull'azione dei prezzi (Price Action). Questo indicatore scannerizza automaticamente il grafico in tempo reale per identificare e segnalare i pattern candlestick più affidabili e noti, eliminando il lavoro manuale e aiutandoti a non perdere mai un'opportunità di trading. Che tu sia un trader discrezionale, un principiante che sta imparando a riconoscere le candele, o un
FREE

Global Exchange Sessions Global Exchange Sessions is an MQL5 indicator that marks the regular trading hours of the world’s main stock exchanges directly on your chart. Each session is shown as a colored rectangle. The rectangle starts at the official market open and ends at the official market close. Its upper and lower edges follow the session high and low as new prices arrive. This makes it easy to see when major equity markets are active, where each session formed its range, and how price rea
FREE

Indicator Description: Decisional POI + Subho Average (SUVO) The Decisional POI + Subho Average is a professional-grade institutional trading tool designed for MetaTrader 5. It combines Smart Money Concepts (SMC) with a high-responsivity Volume-Weighted Trend Line . This indicator identifies high-probability "Decisional" Order Blocks and provides a dynamic trend filter to ensure you are always on the right side of the market. 1. Key Features SUVO Order Blocks: Automatically detects i
FREE

This indicator serves as an alert for climax regions.
How does it work? When the 20-period arithmetic moving average meets the 200-period arithmetic moving average, a conflict region forms with two major opposing forces fighting. This causes the price to show random peaks until a winner side is defined, which can be dangerous. Therefore, the indicator paints the region between the moving averages to alert you.
How to use it? It can be used for specific volatility or support and resistance str
FREE
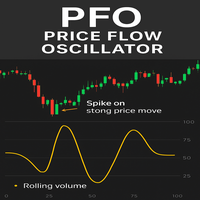
PFO Price Flow Oscillator – MT5 Indicator
The PFO Price Flow Oscillator is a highly advanced tool designed to help traders anticipate explosive price movements and identify market momentum with precision.One of its most powerful features is the ability to anticipate explosive price moves before they occur, giving traders an early edge in volatile markets. Unlike standard oscillators, the PFO does not rely on price alone—it integrates multiple market factors to provide clear, actionable insight
FREE

This indicator shows the direction of the trend and trend change. Ganesha Trend Viewer is a trend indicator designed specifically for gold and can also be used on any financial instrument. The indicator does not redraw. Recommended time frame H1. Ganesha Trend Viewer is perfect for all Meta Trader symbols. (currencies, metals, cryptocurrencies, stocks and indices..)
Parameter setting
MA Short Period ----- Moving Average short period MA Long Period ----- Moving Average long period Alerts ON
FREE
The MetaTrader Market is a simple and convenient site where developers can sell their trading applications.
We will help you post your product and explain you how to prepare your product description for the Market. All applications on the Market are encryption-protected and can only be run on a buyer's computer. Illegal copying is impossible.

You are missing trading opportunities:
- Free trading apps
- Over 8,000 signals for copying
- Economic news for exploring financial markets
Registration
Log in
You agree to website policy and terms of use
If you do not have an account, please register