 MetaTrader 5
 Experts
 Indicators
 Libraries
 Utilities
 Widgets
 Rules
Watch the Market tutorial videos on YouTube
How to buy а trading robot or an indicator
Run your EA on
virtual hosting
virtual hosting
Test аn indicator/trading robot before buying
Want to earn in the Market?
How to present a product for a sell-through
Free Technical Indicators for MetaTrader 5 - 61
 Signals from technical indicators play a crucial role in opening and closing deals on stock and Forex markets. The essence of indicators is a mathematical transformation of a financial symbol price aimed at forecasting future price changes.
Test technical indicators to better predict market behavior and profit from it.

Multi-Period Profit Display Indicator for MetaTrader 5 Brief Description A sophisticated indicator that displays real-time profit/loss across 4 different time periods simultaneously in the top-right corner of your MetaTrader 5 chart. Features detailed Buy/Sell position breakdown for comprehensive daily analysis. Key Features 4 Time Periods Displayed Daily Buy & Sell - Breakdown by position type (Buy/Sell) for today Daily Total - Total daily profit/loss Weekly - A
FREE
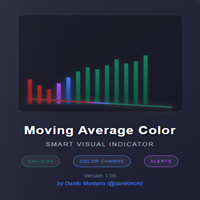
Moving Average Color - Indicador Inteligente para MT5 Descrição Geral O Moving Average Color é um indicador avançado que combina média móvel tradicional com sistema visual inteligente de cores. O indicador muda automaticamente as cores da média móvel e das velas (candlesticks) baseado na posição do preço em relação à média, oferecendo uma análise visual clara e instantânea da tendência do mercado. Principais Características Funcionalidades Principais: Média Móvel Configurável : Suporte a
FREE

The Moving Average
( https://www.youtube.com/c/TheMovingAverage/ )
inspired to create All in One 4MA-s with his color setting.
It Put up 4 Smoothed Moving Averages
With Arty chosed colors.
You can modify the settings / Parameters of the indicator
It's easy to use don't have to waist time to set up all 4 MA-s
just put this up.
Hope its helpfull and Arty don't mind it.
You can donate my work here:
https://discotechnika.hu/MQL/PayPal_Donate.jpg
or here
PayPal.Me/HunSkippy
FREE

The indicator draws a normal chart by coloring it in colors based on prices calculated by the Heiken Ashi indicator algorithm.
That is, the shape of the candles does not change.
In fact, this is the same Heiken Ashi that does not distort the price chart.
Then there will be a drawing of a cat, because there is nothing more to write about the indicator. .
FREE
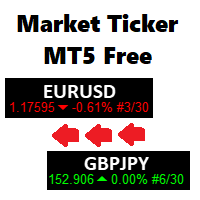
A scrolling Market Ticker that displays price changes from all symbols in the Market Watch list. Provides an easy snapshot of symbol prices, and keeps scrolling automatically while you trade and analyse the chart.
Options include: - MTF, eg choose to show price changes of the daily chart, or the hourly - use the live candle or the recently completed - font and background coloring
FREE
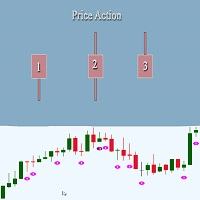
This indicator looks for 3 rather strong patterns: Spinning Top pattern Hammer or Hanging Man Inverted Hammer or Shooting Star These patterns may indicate a trend continuation or its reversal, depending on the location of the patterns.
Input parameters Distance - distance between the signal and the formed signal Note: the higher the timeframe, the greater the value should be used in Distance to display the signal correctly
Indicator Features Suitable for any currency pair Operating timeframe:
FREE
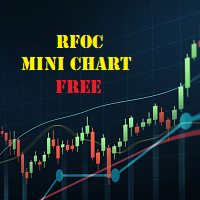
The RFOC Mini Chart was created to project a macro view of the market, which the option to select the timeframe of interest other than the main chart, it is possible to include 2 indicators: 1 - Moving average channel On the mini chart, the moving average will be created based on the prices of the selected time frame for the RFOC Mini Chart. The moving average period must be selected in the indicator settings pannel.
2 - Boillinger Band In the mini chart, a boillinger band will be created based
FREE
The statistical indicator for the metatrader 5 TradingStatisticPro collects statistical data on your trade, which makes it easier to assess the effectiveness of trading, the profit received and the risks. The indicator is compactly placed in the corner of the main chart of the terminal and displays the following information: 1. The profit earned. 2. Maximum drawdown. 3. The recovery factor. 4. Profit factor. 5. The ratio of profitable and unprofitable transactions (winrate). 6. Average profit a
FREE

This Phoenix Delta Lite indicator is an institutional-grade order flow and trend-following tool. It combines Volume Delta Analysis with EMA-based Trend filtering to identify where "Big Money" is moving in real-time. Indicator Description The tool provides a dual-layer analysis of the market: Volume Delta Histogram: Unlike standard volume, this calculates the net difference between buying and selling pressure within each candle. If the bar is Teal, buyers are in control; if Orange-Red, sellers a
FREE

Trade Sentiment or trade assistant is a MT5 Indicatior. That show buy or sell signal of different indicator to assist to take trades. That will help you to take right trades or to get confirmation for your trade. You don't need to have this indicators. Including indicators like RSI , STOCH , CCI. And the signals are Based on different Timeframes like 5M , 15H , 1H and 4H.
FREE

Here is the step-by-step guide to installing and operating your Phoenix Independence Trader in MetaTrader 5. Phase 1: Installation Open MetaTrader 5: Launch your terminal. Open Data Folder: Go to File > Open Data Folder. Navigate to Indicators: Go to MQL5 > Indicators. Create Folder: (Optional but recommended) Create a folder named "Phoenix". Save the File: Paste your merged .mq5 code into a text file and save it as PhoenixTrader.mq5 inside that folder. Compile: Double-click the file to open Me
FREE

CURRENCYPOWER NAVIGATOR MT5 Currency Strength Ranking Dashboard
TAGLINE
See the strongest and weakest currencies before choosing the pair.
PRODUCT OVERVIEW
CurrencyPower Navigator MT5 is a currency-strength indicator for MetaTrader 5. Instead of focusing on one chart only, it evaluates a basket of major Forex pairs and estimates the relative strength of individual currencies.
The indicator then ranks the main currencies and helps identify stronger-versus-weaker combinations that may offer
FREE

Aurexon DriftWave EMA
MetaTrader 5 Custom Indicator Overview
Aurexon DriftWave EMA is an EMA-based chart context indicator for MetaTrader 5. It is designed to give traders a clear visual overview of trend direction, impulse behavior, and volatility boundaries directly on the price chart. Instead of relying only on arrow signals, the indicator displays EMA lines, EMA cloud, ATR volatility rails, and optional closed-bar Buy/Sell confirmation arrows. Key Features Fast EMA impulse line Slow EMA t
FREE
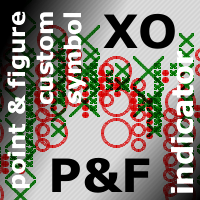
This is a bufferless indicator which can display classical X and O columns if applied on custom symbol charts built by Point-And-Figure-like generator PointFigureKagiCharts or its DEMO . The indicator will enforce a fixed price-scale on the chart to make sure the marks keep correct aspect ratio. The marks are shown only if the chart time-scale is large enough to hold them in the space allocated per bar (if the horizontal scale is one of 3 smallest ones, the indicator draws nothing and outputs a
FREE
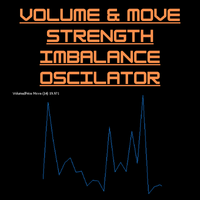
Volume-to-Price Movement Oscillator (VP Oscillator) for MT5 The VP Oscillator highlights the balance (or imbalance) between trading volume and price movement, helping traders spot hidden accumulation, distribution, or weakening trends. How It Works: Calculates each bar’s price range (High–Low) and tick volume. Normalizes both values over a set period (default: 14). Plots the absolute difference between them ×100 — showing how closely price action aligns with trading activity. Interpretation: Hig
FREE

ST Flow Context: The Professional Trader’s Compass ST Flow Context is a macro analysis tool developed to identify the predominant direction of institutional money. It filters out intraday noise and delivers the real market context, helping the trader never to trade against the main tide. Key Features: Trend Alignment: Identifies whether the daily flow is bullish or bearish based on multiple timeframes. Interest Zones: Maps where institutional volume is defending positions. Entry Filter: Use Flow
FREE

Indicador Volatilidade Histórica Indicador é um oscilador que faz o plot da volatilidade histórica de um ativo, representado pelas fórmulas: Volatilidade Histórica = Raiz quadrada da média das diferenças ao quadrado * Fator de anualização. Média das diferenças ao quadrado = soma de todas as diferenças de retorno diário / número total das diferenças. Retorno diário = (preço atual - preço anterior) / preço anterior. Nesse indicador estamos utilizando os preços de fechamento de cada barra e fazemos
FREE

概要
このインジケーターは、MetaTrader 5に内蔵されている経済指標カレンダー機能を使い、 FOMCや雇用統計などの重要な経済指標の発表時刻を 日本時間(JST)かつ日本語で チャート上にコンパクトに表示します。 外部サイトへの通信(WebRequest)は一切行わないため、許可URLの設定や面倒な設定は一切不要です。 ---Japanese only. Other languages are not supported.---
主な機能 MT5内蔵カレンダーから自動取得、常に最新の予定を反映 重要度をHigh/Moderate/Lowでフィルタ可能(の数で一目表示) 表示時刻は日本時間に自動変換、年を省いたコンパクト表示(MM/DD HH:MM) 角丸・半透明の見やすいパネルデザイン、8方向(時計回り)から配置場所を選択可能 時計機能内蔵で指標発表時に目線を外す必要がありません 指数発表前は予告色に変化し、直前〜発表後は点滅して警告可能(発表x分前から発表後x分後までなど自由設定、0で機能ごとに無効化も可能) インジケーターとして動作するため、お使いのEAと同一チャ
FREE

Push Notif for Mobile Trading
(Now you can trade perfectly through notifications to your Mobile Gadget, with Signals that you can adjust to your trading style, Use VPS to activate real time trading)
Description Push Notif for Mobile Trading is a custom MetaTrader 5 (MT5) indicator designed to send mobile push notifications to traders when certain price or indicator-based conditions are met. This allows traders to monitor markets remotely and act quickly, even when not at their trading terminal.
FREE

Bullish Consecutive Signal — Consecutive Bullish Candle Buy Signal with Alerts & P&L Simulation
Bullish Consecutive Signal automatically detects consecutive bullish candle patterns and marks high-probability buy entries directly on the chart. Each signal comes with an ATR-calculated Stop Loss and Take Profit level, drawn as reference lines so you can assess risk at a glance. A built-in P&L back-simulation lets you evaluate strategy performance without leaving the chart.
IMPORTANT — DEFAULT
FREE

MultiTimeFrame Double Screener MT5 — HiddenEdge MultiTimeFrame Double Screener MT5 is a professional dashboard that monitors multi-timeframe trend bias across multiple symbols from a single chart.
It uses dual confirmation to reduce noise and keep readings consistent across all windows. Functional Overview Computes bias per symbol using closed candles and a time anchor (H1 by default) to avoid historical repaint. Applies dual confirmation: bias reading + optional N-bar validation on the anchor
FREE

Simple. Informative. Instantly Visible on Your Chart. Alwinson Active Trades Info is a lightweight indicator that displays a summary of currently open positions directly on the chart. It removes the need to switch to the Terminal window to check which symbols are active and what volume is involved. An MT4 version of this indicator is also available among my products.
Key Features: Lists all symbols that currently have open positions in the trading account. Shows the dominant position type (BUY
FREE

The Real Flow Defense Levels indicator is a proprietary tool designed to identify and plot significant, high-conviction price zones directly onto your main trading chart. It uses a dynamic, volume-based analysis to determine where the market has previously demonstrated the strongest defense or concentration of activity . These plotted lines serve as dynamic support and resistance levels , highlighting the prices where major participants are most likely to enter or defend their positi
FREE

Spread Ranking Panel Spread Ranking Panel is a compact MetaTrader 5 indicator that displays currency pairs ordered from the lowest to the highest spread. It scans the Market Watch symbols, filters forex pairs, and shows a clean on-chart ranking table to help traders quickly identify the pairs with the best trading conditions. Key Features Real-time spread ranking from lowest to highest Compact on-chart dashboard Shows spread in pips and points Displays up to 7 visible pairs Include or exclude sp
FREE
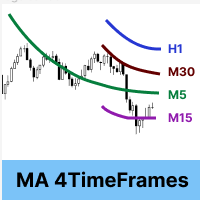
Moving Average 4 TimeFrames
Display 4 moving averages of 4 different timeframes on the same chart. In order not to pollute the chart, the indicator will plot the complete average only in the current timeframe of one of the 4 registered averages, for the other timeframes of registered averages the indicator only displays a part of the average so that you know where it is at that time graphic.
Example:
Display on the 5-minute chart where the 200-period arithmetic moving average of the 5 minute
FREE
Daily Key Levels Indicator
Spot the market’s key price levels from the daily session at a glance!
This indicator automatically plots the important daily price levels , helping you quickly identify strategic zones for entries and exits. Features: Automatic display of important daily market levels. Fully customizable : Choose the number of levels to display. Set the line color to match your personal or chart style. Works on all instruments and all timeframes (Forex, indices, commodi
FREE

If you love this indicator, please leave a positive rating and comment, it will be a source of motivation to help me create more products <3 Key Takeaways Bulls Bears Eyes is another version of Laguerre RSI. Use Bull/Bear Power to calculate. One use of the Bulls Bears Eyes is to identify trends. This is done by looking for sustained periods when the indicator is above or below the 0.5 line. Also, a buy signal is generated when the Bulls Bears Eyes line crosses above the 0.15 level, while a s
FREE

If you love this indicator, please leave a positive rating and comment, it will be a source of motivation to help me create more products <3 How to use Aroon Indicator? The AroonUp and the AroonDown measure the strength of the uptrend and the strength of the downtrend, respectively. These lines fluctuate between zero and 100. Values close to 100 indicate a strong trend and values near zero indicate a weak trend where the lower the AroonUp, the weaker the uptrend and the stronger the downtrend,
FREE

SmartTrader Pip Value Display answers a question that trips up more traders than you'd expect: what is a pip actually worth, right now, on this symbol, at this lot size? Why the textbook answer is often wrong "$10 per pip on a standard lot" is a rule of thumb for a handful of major USD pairs - it is not a universal fact. Gold, indices, JPY pairs, and plenty of other symbols have real pip values that differ from that number, sometimes significantly, and it depends on your specific broker's contra
FREE
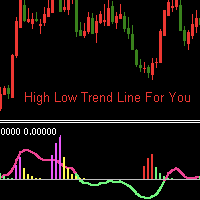
Indicator introduction:
The indicator draws trend line and histogram, It has small price lag, and has no future functions, the signals will not drift. When the market is under inter-area oscillations, If the indicator appears red and green histogram, this is a low price zone, if the indicator appears magenta and yellow histogram , this is a high price zone. It can also be used to analyze market's trend according to the high and low price zone. The indicator can send emails, alerts and notificat
FREE
Este indicador de Média Móvel Personalizada permite aos traders visualizar a tendência do mercado utilizando diferentes métodos de cálculo e aplicação a várias séries de preços. O indicador é flexível e pode ser configurado para se adaptar a várias estratégias de trading, oferecendo suporte aos métodos de média móvel mais populares, incluindo Média Móvel Simples (SMA), Média Móvel Exponencial (EMA), Média Móvel Ponderada Linearmente (LWMA) e Média Móvel Suavizada (SMMA). Funcionalidades: Seleção
FREE
The Market Thermometer can be used to help traders identify sleepy or turbulent periods. It helps beginners to check when is the ideal time to enter operations, that is, when the value of the thermometer is below its average for several periods, identifying a peaceful market. When the market is heated, that is, the thermometer is above three times its average, it is time to make profits. The Thermometer measures the extent to which the end of a period, maximum or minimum price, projects out
FREE

SMC Trend Momentum Signal Line
SMC Trend Momentum Signal Line is an MT5 indicator that draws a smoothed on-chart line and colors it in real time: lime for positive momentum, tomato for negative, derived from the “SMC Trend Momentum” subwindow oscillator. This gives you immediate momentum direction directly in the main chart. Note: You must purchase the “SMC Trend Momentum” to see the line. The SMC Trend Momentum Signal Line is and will remain free of charge for you. Key Features Colored On-Char
FREE

Multi Kernel Regression Indicator (FREE & PREMIUM)
SPECIAL OFFER Full version is available in the market under "Daily Zone Pro" Market Link: https://www.mql5.com/en/market/product/157609?source=Site +Market+My+Products+Page
What This Indicator Does The Multi Kernel Regression (MKR) indicator uses advanced statistical kernel functions to create smooth, adaptive moving averages that respond intelligently to market conditions. Unlike traditional moving averages, MKR applies different kernel
FREE

Non-proprietary study of Joe Dinapoli used for trend analysis. The indicator gives trend signals when the fast line penetrates the slow line. These signals remain intact until another penetration occurs. The signal is confirmed at the close of the period. It is applicable for all timeframes. Inputs lnpPeriod: Period of moving average. lnpSmoothK: %K period. lnpSmoothD: %D period. ********************************************************************************
FREE
Identify trending and flat markets effortlessly
This indicator calculates how much has a symbol moved in relative terms to find trending or flat markets. It displays what percentage of the latest price range is directional. It can be used to avoid trading in flat markets, or to find flat markets to execute range-bound trading strategies. [ Installation Guide | Update Guide | Troubleshooting | FAQ | All Products | Get Help ] A value of zero means the market is absolutely flat A value of 100
FREE

Grazia Matrix Pro - Product Description Instantly visualize trends across all timeframes. The ultimate compass to eliminate trading indecision. 【 Limited time offer! Free 】 【Perfect For】 Traders wasting time on manual environment recognition. Traders struggling with losses caused by trading against the higher-tier trend. Traders seeking a professional, clutter-free charting environment. 【Overview】 "Multi-timeframe (MTF) analysis is crucial, but switching charts constantly is a hassle..." Graz
FREE

Th is i ndicator is a versatile MetaTrader 5 tool that calculates and displays Average True Range (ATR) levels on your chart. It draws horizontal lines representing price levels based on ATR multiples from the daily opening price, helping traders identify potential support and resistance zones. 1. Multiple ATR Levels ATR1 : Standard ATR level (default: 1x ATR) ATR2 : Intermediate level (default: 2x ATR) ATR3 : Extreme level (default: 3x ATR) Each level displays both upper (High) and lower (L
FREE
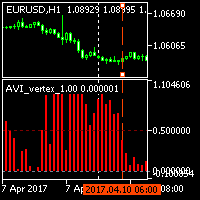
The indicator displays trend slowdown or possible end of trend and price reversal. The indicator has no parameters. When red bars appear and when they become shorter, we can talk about the approaching end of the downtrend. When green bars become shorter, we can expect the approaching end of the uptrend.
FREE
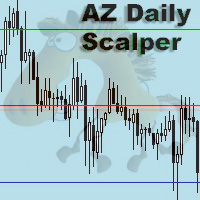
AZ daily scalper
Mini indicator that draws possible correction levels based on the previous day. Then you go to a lower timeframe and look for entry patterns. In the settings, you can select the day on which you want to get these levels (by default, it calculates from the previous day). You can set the colors of the levels, the type of lines, the background color of the candle from which the calculation occurs
FREE

WHO IS THIS FOR?
→ Manual traders who want to track performance without leaving MT5 → EA developers who need quick visual feedback on strategy results → Fund managers who want a clean, presentable performance overview → Anyone serious about understanding their trading edge
WHAT MAKES IT DIFFERENT
Most trading dashboards show you numbers. This one shows you the
FREE

BB and EMA 50 This indicator merges BollingerBands and EMA50 to clarify trend strength, momentum shifts, volatility expansion, and directional bias, offering structured insights for breakout detection, pullback validation, and dynamic trend continuation across varied market conditions while improving precision in identifying reliable trade setups. It also includes an interactive hide-and-show line control using integrated buttons for flexible visual analysis.
FREE
BBTrend is a powerful trend analysis tool designed to provide a clear overview of market volatility and trends at a glance.
This indicator calculates the difference between two Bollinger Bands of different periods,
visually indicating the strength of upward or downward trends to traders. Clear Trend Visualization: The upward trend is represented in green, and the downward trend in red,
allowing traders to intuitively grasp the direction and strength of the trend. Standardized Percentage Disp
FREE

Coasyn Participation Intelligence Professional Market Participation Intelligence for MetaTrader 5 Most trading losses begin long before the entry—they begin by participating in poor market conditions. Coasyn Participation Intelligence is designed to help discretionary traders evaluate whether the current market environment deserves their participation before capital is committed. Rather than searching for more trading signals, this panel helps you become more selective by organizing important en
FREE
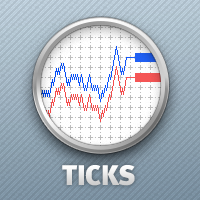
A simple tick indicator of Bid and Ask prices. The period separator (1 minute) is displayed as a histogram. Parameters Show Bid Line - show/hide the Bid line; Show Ask Line - show/hide the Ask line; Show Labels - show/hide the last price values.
FREE

Quantopro Plus: Skyrocket Your Trading Success Unleash the power of precision with Quantopro , the ultimate trading indicator for MetaTrader 5 that transforms market chaos into profitable opportunities. Engineered with a cutting-edge proprietary formula, Quantopro delivers crystal-clear buy and sell signals, empowering traders of all levels to dominate the markets with confidence. Why Choose Quantopro? Dynamic Signal Painting : Instantly spot high-probability trades with vivid, real-time signals
FREE
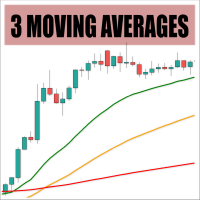
This is a customizable three-moving-averages indicator designed for crossover trading strategies. You can configure each moving average individually, including calculation method (e.g., exponential, simple), period, and price type, all from a single input dialog.
Parameters: Period <1,2,3> - Period of a moving average Shift <1,2,3> - Shift of a moving average Method <1,2,3> - Method of calculation for each moving average set separately Applied Price <1,2,3> - Set price type for calculations for
FREE

SuperTrend Indicator for MetaTrader 5
Ride Trends Like a Pro — Never Miss a Move Again Description:
The SuperTrend Indicator is your ultimate companion for mastering trend-following strategies. Designed to cut through market noise, this powerful tool combines the precision of Average True Range (ATR) with adaptive trailing stops to pinpoint trend reversals, confirm breakouts, and keep you on the right side of the market. Whether you’re trading forex, stocks, crypto, or commodities, the SuperTr
FREE

KTA Candle Timer | Art of Kushal Trading Academy
Never Miss a Candle Close Again!
KTA Candle Timer is a simple, lightweight, and essential tool for every professional trader. It shows the exact time remaining for the current candle to close on your MT5 chart. Perfect for traders who trade on Supply & Demand, Support & Resistance, and Price Action.
Knowing the candle time helps you avoid false entries and take perfect entries at the right time.
KEY FEATURES
- Accurate Countdown: Shows e
FREE
Introduction to GARCH Indicator GARCH is the short initial for Generalized Autoregressive Conditional Heteroskedasticity and it is the volatility prediction model commonly used in financial industry. GARCH model was first appeared in the work by Danish Economist, Tim Peter Bollerslev in 1986. The 2003 Nobel Prize winner, Robert F Engle also added much contribution for the refinement of GARCH model with Tim’s work. Our GARCH INM predictor took the original method of Nelder Mead for GARCH model bu
FREE

Product Title: IQ Expected Move SAR SuperTrend Stop Guessing Volatility Boundaries – Trade Inside the Institutional Football Field! Do you know where the institutional boundaries of your asset are for today? Most retail traders place their stops and targets based on gut feeling, running straight into the traps of market makers. Institutions look at the mathematical expected range of the day to define their playground. The IQ Expected Move SAR SuperTrend engine calculates this institutional vo
FREE

Product Name: Sinwl Signal – Premium Price Action & Swing Trade Indicator (WinWiFi Robot Series) Overview: Unlock professional trading performance with "Sinwl Signal" , the latest innovation from the WinWiFi Robot Series . Specifically engineered for the CFD markets (Forex, Indices, Energy, and Crypto), this indicator solves the trader's biggest challenge: distinguishing between Trend and Sideway markets. Sinwl Signal filters out market noise, allowing you to catch profitable moves with precisio
FREE
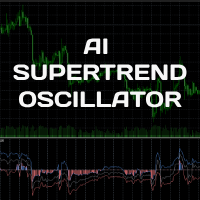
The AI SuperTrend Clustering Oscillator identifies three key outputs—bullish, neutral, and bearish—derived from variations between multiple SuperTrend indicators. FUNCTIONALITY The oscillator consists of three primary elements: Bullish Output : Represents the most optimistic signal, always the highest value. Bearish Output : Reflects the most pessimistic signal, always the lowest value. Consensus Output : Falls between the bullish and bearish outputs, serving as an overall trend indicator. A
FREE

Now free. Know your real spread, and know exactly what it costs you on every trade.
Know your real spread. Know what it costs you.
Real Spread Monitor puts the one number most traders ignore right on your chart: the real bid/ask spread, live, and exactly what it costs you per trade. Scalpers and intraday traders lose money to the spread every single day. This tool shows you when the spread is normal, when it is too wide to trade, and how it behaves hour by hour — so you trade with your eyes o
FREE

️️️CandleIntelligence MTF MA Combined Pro v3.22 ️️️ - Professional Japanese Candlestick Analysis System What Is This Indicator? CandleIntelligence MTF MA Combined Pro is an advanced educational tool combining candlestick pattern analysis with Moving Average context across multiple timeframes. The indicator recognizes 11 key Japanese candlestick formations and presents them in the context of market trend, Swing High/Low levels, and position relative to moving averages. Main Features
FREE

Spread Engine Nika — Real-Time Spread Profiling for MetaTrader 5 Spread Engine Nika is a professional spread analysis indicator for MetaTrader 5. It builds a statistical spread profile for any symbol using historical tick data, displays live spread conditions in context, and gives you an instant read on whether current spreads are normal, elevated, or dangerous — all in a compact on-chart panel. Designed for scalpers, intraday traders, and anyone who cares about execution cost, it turns raw spre
FREE

Swing Detector — When You Think You Know Swings, Think Again
One of the key reasons many traders fail is their inattention to seemingly simple details they believe they’ve mastered. One such critical detail is the accurate identification of market swings (Swing Highs / Lows) on the chart. If you ask a group of traders to manually and consistently mark swing points on a chart, you'll find that more than half struggle to do it correctly . Not due to lack of knowledge, but because of mental fatigu
FREE
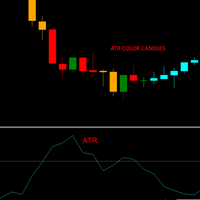
This indicator allows you to visually identify with a different color the candlesticks that exceed a certain limit of the ATR.
Just drag and drop it on the chart.
The user must enter the value of the ATR period.
The user must enter the value of the ATR limit with which he wants to identify the candlesticks.
In the colors tab, the user can select the colors with which to repaint the candles.
It is recommended that the first color always be None.
The second color corresponds to bullish c
FREE
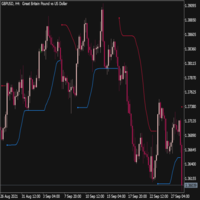
Trend Envelopes indicator is calculated based on a % of price change. That % is then used to determine if there is a new trend or trend remains the same.
This version is using Standard Deviation for the price change calculation instead and is adding prices smoothing prior to be used in calculations. The smoothing can be done using one of the 4 average types:
* Simple Moving Average
* Exponential Moving Average
* Smoothed Moving Average
* Linear Weighted Moving Average
Also, this
FREE

MTForge SuperTrend — Adaptive Trend Following for MT5 A professional-grade SuperTrend indicator built for serious traders. Unlike basic SuperTrend tools, MTForge SuperTrend gives you two trend detection modes and six moving average types, letting you fine-tune the indicator to match any market condition. What It Does The indicator plots a single colored line on your chart that flips between support (green) and resistance (red). When price is trending up, the line sits below price as dynamic supp
FREE

Vyl Daily Sessions & Drawdown Tracker — Full Guide
Short Description (for the Market product card)
Vyl Daily Sessions & Drawdown Tracker is an all-in-one indicator for MetaTrader 5 that combines professional chart mapping with advanced trading-discipline control.
The tool automatically draws the key trading sessions and the previous day's liquidity levels, and adds a unique Discipline Dashboard that tracks your daily stats in real time and instantly warns you when you're approachin
FREE
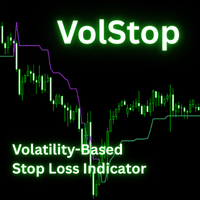
The VolStop Adaptive Volatility-Based Trailing Stop Indicator for MT5 VolStop is a precision volatility-stop indicator for MetaTrader 5, built for traders who want to stay in winning trades longer and exit with discipline. Instead of fixed pips or moving averages, VolStop dynamically tracks price action with ATR-based bands, automatically adapting to market turbulence. Key Features Adaptive Volatility Stops – Calculates a dynamic trailing stop using ATR and a user-set multiplier to match changi
FREE

The euro index on your chart, built live from your own broker's five euro pairs. When EURUSD falls you cannot tell from EURUSD alone whether the euro is weak or the dollar is strong. An index answers it. Put this under any chart and you are looking at the euro on its own terms, measured against the pound, the yen, the franc and the krona as well as the dollar. It uses the New York Board of Trade Euro Currency Index formula. EUR/USD 31.55% EUR/GBP 30.56% EUR/JPY 18.91% EUR/CHF 11.13% EUR/SEK 7.85
FREE

The Trend Strength Meter Core is a powerful on-chart dashboard designed to give you an instant, clear reading of the current market momentum . By combining the data from Moving Averages, RSI, and MACD, it calculates a highly accurate Trend Score (0 to 100), ensuring you always trade on the right side of the market . Key Features Advanced Confluence Algorithm: Calculates a dynamic score by analyzing price position relative to MA, RSI overbought/oversold zones, and MACD signal crossovers . Enhanc
FREE

Tired of adjusting the indicator settings losing precious time? Tired of the uncertainty regarding their efficiency? Afraid of the uncertainty in their profitability? Then the indicator ACI (automatically calibrateable indicator) is designed exactly for you. Launching it, you can easily solve these three issues just performing the simplest action: clicking a single Calibrate button. To achieve the highest efficiency, you should perform another additional action: move the power slider to the maxi
FREE

Displays previous months Highs & Lows. You can set the number of months to display levels for, also the line style, color and width. This is very useful for traders using the BTMM and other methods like ICT. I'll be creating more indicators for MT5 for the BTMM. Send me your suggestions to my Telegram: https://t.me/JDelgadoCR Take a look at my other products at: https://www.mql5.com/en/users/jdelgadocr/seller
FREE

ViewTrend The ViewTrend indicator provides a visual interpretation of market conditions by coloring the candles and the moving average line based on defined technical criteria. ️ How does it work? The agorithm analyzes the relationship between the current closing price, the previous closing price, and the behavior of a simple moving average (SMA). Based on this analysis, the indicator colors the candles and the moving average line according to the technical scenario observed: Blue — Suggesti
FREE

Throw VolumeGap Mabrouk Identify Institutional Footprints with Precision Volume Analysis Overview VolumeGap is not just another volume indicator; it is a clinical trading tool designed to detect "Liquidity Surges" and "Institutional Entry Points." By analyzing the relative strength of every tick, this indicator pinpoint the exact moment when high-volume players enter the market, creating high-probability reversal and breakout opportun. LIMITED LAUNCH OFFER Current Price: $35 (Exclusive for the
FREE

**Experience Smarter Trading with FVG Super Signal**
Unlock simpler, more decisive trading with **FVG Super Signal**, an advanced MT5 indicator from the WinWiFi Robot Series. This powerful tool uniquely combines the Fair Value Gap (FVG) technique with robust trend-following logic.
* **Clear Signals:** Delivers intuitive Buy/Sell alerts, simplifying your trading decisions. * **Universal Compatibility:** Works seamlessly across all assets and timeframes. * **Highly Versatile:** Ideal for all tr
FREE

"Driver Road Bands" indicator that is designed to be used in the 1H, 4H and 1D timeframes in the most ideal way. If we compare timeframes to roads and streets; main streets and highways with high traffic volume are similar to high-time timeframes in technical analysis. If you can interpret the curvilinear and linear lines drawn by this indicator on the graphic screen with your geometric perspective and develop your own buy and sell strategies; you may have the key to being a successful trader.
FREE
MetaTrader Market - trading robots and technical indicators for traders are available right in your trading terminal.
The MQL5.community payment system is available to all registered users of the MQL5.com site for transactions on MetaTrader Services. You can deposit and withdraw money using WebMoney, PayPal or a bank card.

You are missing trading opportunities:
- Free trading apps
- Over 8,000 signals for copying
- Economic news for exploring financial markets
Registration
Log in
You agree to website policy and terms of use
If you do not have an account, please register