 MetaTrader 5
 Experts
 Indicatori
 librerie
 Utilità
 Widget
 Regole
Guarda i video tutorial del Market su YouTube
Come acquistare un Robot di Trading o un indicatore
Esegui il tuo EA
hosting virtuale
hosting virtuale
Prova un indicatore/robot di trading prima di acquistarlo
Vuoi guadagnare nel Market?
Come presentare un prodotto per venderlo con successo
Indicatori tecnici gratuiti per MetaTrader 5 - 55
 I segnali degli indicatori tecnici giocano un ruolo cruciale nell'apertura e nella chiusura delle transazioni sui mercati azionari e Forex. L'essenza degli indicatori è una trasformazione matematica del prezzo di un simbolo finanziario, finalizzata alla previsione dei cambiamenti futuri dei prezzi. Prova gli indicatori tecnici, per prevedere al meglio il comportamento del mercato e ricavarne dei guadagni.

Description This is an indicator for MT5 which has enhanced the "Fractals" indicator. "Fractals" indicator is included in MT5 by default but the draw line period is fixed at "5" and it cannot be modified. Thus I have reinvented the Fractals indicator with some useful function added. This tool will be useful especially for those who are learning how to draw good horizontal lines and wants to get some reference. Of course, those who are considering Fractals as an important horizontal line wil
FREE
SuperTrend Indicator – Description & Important Notice The SuperTrend is a composite technical indicator designed to help you identify the primary trend, measure its strength, and assess signal quality. However, an indicator is only a tool —it’s never 100% accurate and cannot replace sound risk management. 1. Core Formula & Components ATR (Average True Range): measures price volatility; customize sensitivity via Periods and Multiplier . Upper/Lower Bands: derived from ATR and your chosen source p
FREE

Mahdad Candle Timer è un indicatore leggero e preciso per MetaTrader 5 che mostra il tempo rimanente alla chiusura della candela corrente, visualizzato direttamente accanto all’ultima barra. È stato progettato per i trader che si affidano a un timing accurato — che si tratti di scalping, day trading o dell’attesa della conferma di una candela in configurazioni swing. Caratteristiche principali Conto alla rovescia accurato – Tempo rimanente in formato HH:MM:SS (opzionalmente millisecondi) Pos
FREE

Indicador Volatilidade Histórica Indicador é um oscilador que faz o plot da volatilidade histórica de um ativo, representado pelas fórmulas: Volatilidade Histórica = Raiz quadrada da média das diferenças ao quadrado * Fator de anualização. Média das diferenças ao quadrado = soma de todas as diferenças de retorno diário / número total das diferenças. Retorno diário = (preço atual - preço anterior) / preço anterior. Nesse indicador estamos utilizando os preços de fechamento de cada barra e fazemos
FREE
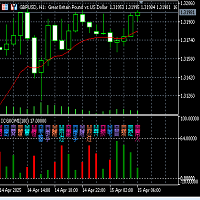
Fuxi Guaxiang Dual-color Oscillation Indicator Function and Usage Instructions (V2.1)
Fuxi Guaxiang Dual-color Oscillation Indicator Instructions: (1) This Guaxiang change indicator is based on the Yin-Yang transformation thought of the "Book of Changes" philosophy in ancient Chinese culture, integrating the results of the long-short game in each candlestick K-line period of the financial trading K-line chart, using China's oldest predictive coding method, in the form of the 64 Guaxiang of the
FREE
- Chart Time Indicator is very simple and easy, but it can be very important to control the time before opening any manual trade. This indicator shows the time on the chart between 3 different options. Input Parameters: - Show Time : Select all the time options that you want to see. Local Time (Personal Computer Time), Server time (Broker Time) or GMT Time. Recommendations: - Use only one Chart Time Indicator for each Chart.
FREE

Throw VolumeGap Mabrouk Identify Institutional Footprints with Precision Volume Analysis Overview VolumeGap is not just another volume indicator; it is a clinical trading tool designed to detect "Liquidity Surges" and "Institutional Entry Points." By analyzing the relative strength of every tick, this indicator pinpoint the exact moment when high-volume players enter the market, creating high-probability reversal and breakout opportun. LIMITED LAUNCH OFFER Current Price: $35 (Exclusive for the
FREE
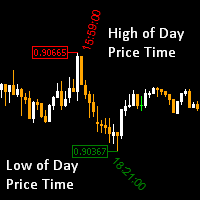
High of the Day and Low of the day Time and Price Fractal Studies is an indicator that will help you identify certain patterns that tend to repeat themseleves at certail times of the day or at certain prices.
It is used to study Daily Highs ad Lows in relation to time and price.
You will get to answer certail questions like:
At what time of day does this market usually turn around. At what price does the market turn. Is it at round numbers etc
FREE

BrioQuant Position Monitor keeps your floating result where your eyes already are: beside the newest candle at the current price. Show this symbol's positions or the whole account, in cash and as a percentage of balance or equity, with optional entry lines and a per-position label for every open trade on the chart symbol. Features: - Floating readout rides the newest candle at current price height - no corner panel to glance away at - Scope: this symbol or the whole account; swap included or exc
FREE

LotCalc is a minimalist MT5 indicator designed for fast, precise position sizing. Set your risk amount in dollars, click the button, then click your entry and stop-loss levels directly on the chart — the lot size and point distance are calculated and displayed instantly. No clutter, no extra panels, just the one tool you actually need before placing a trade.
FREE
Se ti piace questo progetto, lascia una recensione a 5 stelle.
Come le istituzioni commerciano grandi volumi, non è raro per loro cercare di
difendere la loro posizione a livelli percentuali specifici. Questi livelli serviranno come supporto naturale e resistenza che è possibile
utilizzare
o entrare in un commercio o essere a conoscenza di possibili pericoli contro la
vostra posizione. Questo oscillatore vi mostrerà la variazione percentuale per il: Giorno. Settimana. Mese. Quarto. Anno. In
FREE
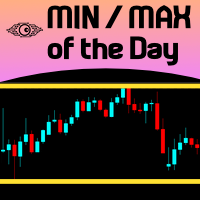
For those Price Action traders who love to trade strong Price points, like yesterday's HIGH and LOW, here is an indicator to ease the identification of those values, drawn directly on your chart! MIN/MAX of the Day will automatically draw 2 lines showing you those points for you, AND, if you like any HIGH and LOW in the past, not just yesterday's prices. It can also be configured to additionally show today's HIGH and LOW prices - just configure the refresh rate of those lines at your own taste/s
FREE

Estadistica.mq5: il tuo pannello di controllo completo per il trading e l’analisi Ottimizza la gestione delle tue operazioni di trading con Estadistica.mq5, il pannello di controllo definitivo per i trader alla ricerca di chiarezza e precisione. Questo indicatore indipendente ti consente di monitorare in tempo reale sia le tue posizioni aperte sia una cronologia dettagliata delle operazioni chiuse, il tutto all’interno di un’interfaccia compatta e altamente efficiente.
Caratteristiche principal
FREE
Indicatore “Step Channel Momentum Trend” (MT5 Indicator) Step Channel Momentum Trend è un potente indicatore basato sul momentum progettato per fornire ai trader un vantaggio adattivo combinando la struttura di mercato con un'analisi dinamica della volatilità. Questo strumento aiuta a distinguere chiaramente tra tendenza e intervallo senza dipendere da tecniche di smussatura soggette a ritardi, utilizzando una linea mediana a gradini unica e un canale filtrato da ATR. Caratteristiche Chiave Me
FREE
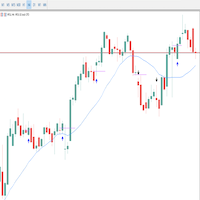
Multset This is inte_plays indicator, which helps the trader to enter the trades appropriately it plots an arrow when there is appropriate environment which permits trading
Features 1. Sends push notification on mobile devices 2. Plots arrow on chart when the setting is found
TimeFrame Is suggested to be used on higher time frames only, especially starting 15min and above for proper moves
For more informations please Visit: https://t.me/Tz_Fx_Lab Subscribe to our Youtube channel: https:
FREE

If you are Looking Best indicators in Mql5 Market. Check these out!
SSS Scalping Smart Signals MT5 Indicator
Scalping Winning Signals Pro SWS
LTL Long Trend Locator
The Ultimate Challenge Protection Dashboard for Goat Funded Trader (MT5) Pass your Goat Funded Trader (GFT) challenge with confidence using a professional MT5 dashboard designed specifically to help traders stay within the firm's trading rules. UZFX Goat Funded Trader Guardian PRO is an advanced account monitoring indicator that
FREE
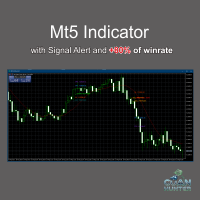
FREE VERSION FOR GOLD (XAUUSD) AND BTCUSD Dont forget to rate after use this indicator, Thanks.
Features: Clear Buy/Sell labels with directional arrows. Automatic Take Profit (TP) & Stop Loss (SL) labels for better risk management. Easy-to-read chart signals (no messy lines). Works on any timeframe and any asset (Forex, Gold, Indices, Crypto, Stocks). Compatible with MetaTrader 5 (MT5 desktop & mobile sync) . Perfect for: Beginner traders who need straightforward sign
FREE
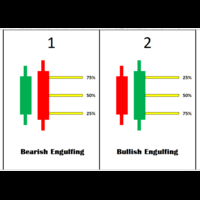
Engulfing Levels Indicator – Smart Entry Zones for High-Probability Trades Overview:
The Engulfing Levels Indicator is designed to help traders identify key price levels where potential reversals or trend continuations can occur. This powerful tool combines Engulfing Candle Patterns , Percentage-Based Levels (25%, 50%, 75%) , and Daily Bias Analysis to create high-probability trading zones . Key Features:
Engulfing Pattern Detection – Automatically identifies Bullish and Bearish Engulf
FREE

"Elder Ray" or "Ray" indicator is based on the Dr. Alexander Elder's oscillators: Bulls & Bears Power. Both of them works with an EMA. This indicator is used by traders to identify divergence, market directions and more... Dr. Elder's method generally uses a 13-day EMA Period but this can be modified based on your personal demand. The calculations are: Bulls Power= high candle - EMA close Bears Poder= low candle - EMA close Lime line represents Bulls Power and OrangeRed line, shows Bears Power
FREE

================================================================================ VL LEVELS INDICATOR - USER GUIDE VolumeLeaders Institutional Trade Levels for MetaTrader 5 ================================================================================
WHAT IS THIS INDICATOR? ----------------------- This indicator displays VolumeLeaders institutional dark pools trade levels on your MT5 charts. These levels represent price points where significant institutional trad
FREE

Hi there! Since I am starting commercial and non-commercial product publishing I would highly appreciate: If you like this product, please rate it. That will help to promote not only this product, but indirectly another ones. So, such promotion will help to make some money from commercial products. Thus, I will have opportunity to fund my another directions of trading researches like bot development using mql4 and mql5 programming languages as well as python written products like crypto bots. If
FREE

## FutureSight CCI — See Beyond, Trade Ahead
### What It Is FutureSight CCI is a next‑gen oscillator that upgrades the classic CCI. It combines trend detection, cross signals, Bollinger Bands, alerts, and logs into one powerful tool.
Paired with the **second‑chart generator**, it gives you total control of the ultra‑short‑term market. Perfect for scalping and binary options where speed and precision matter most.
---
### Highlights - **Extended CCI**: Three custom lines for deep
FREE
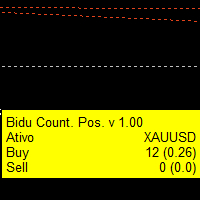
Indicador que cria um painel para acompanhamento to total de posições abertas no ativo do gráfivo.
São apresentados os dados: Ativo do gráfico Total de posições de venda em aberto Quantidade do volume de posições de venda em aberto Total de posições de compra em aberto Quantidade do volume de posições de compra em aberto.
Painel simples mas eficiente para o equilíbrio das ordens
FREE

The MetaTrader 5 Position Indicator is a custom technical tool designed to enhance traders' ability to monitor and manage their positions effectively. It displays key trade details such as stop-loss (SL), take-profit (TP), groups them where they are the same, average buy price, and average sell price directly on the chart. Costs accounted for. Key Features:
Displays TP and SL levels
Groups TP and SL levels where they are the same
Shows average buy and sell price levels Candlestick countdown Pan
FREE

Looks for strong price movements and draws levels upon their completion.
You determine the strength of the movement yourself by specifying in the settings the number of points and the number of candles of the same color in a row in one direction.
There are 2 types of building in the settings: extrenum - high / low close - close price You can also adjust the number of displayed levels and the number of candles for calculations.
By default, the settings indicate 5 levels for 360 candles.
That
FREE

Высокоточный трендовый индикатор для платформы MetaTrader 5, разработанный для поиска идеальных точек входа на пробой зон консолидации. Индикатор автоматически определяет периоды накопления объема, строит динамические ценовые коробки и генерирует сигналы в моменты истинного выхода цены из диапазона. Главное преимущество алгоритма — строгий фильтр чередования сигналов (BUY / SELL) . Индикатор полностью исключает рыночный шум и серии однотипных ложных сигналов на затяжных трендах: после сигнала н
FREE
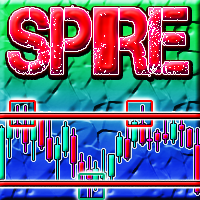
Spire - показывает трендовый, сигнальный, свечной прорыв в сторону верхней или нижней границы канала, а так же временную или долгую консолидацию в виде прямоугольного канала. Сигналы тренда не перерисовываются. В основу идеи индикатора входит Bollinger Bands.
Изменяемые параметры Signal trend -изменение цветовой гаммы сигнального символа тренда Lower limit - изменение цветовой гаммы нижней границы канала Upper limit - изменение цветовой гаммы верхней границы канала Internal field -изменение ц
FREE

The Average Cross System indicator is a versatile tool designed for traders using the MetaTrader 4 (MT4) platform. This indicator provides a straightforward yet effective way to identify potential buy and sell signals based on moving average crossovers, a widely used technical analysis strategy. Key Features: Moving Average Crossovers: The heart of the Average Cross System is the detection of moving average crossovers. It automatically identifies when a shorter-term moving average crosses above
FREE

All-in-One Dashboard for Trend, Momentum & Volatility Indicators Info Panel is a compact yet powerful MT5 tool that summarizes the most important market metrics directly on your chart.
It reads built-in MT5 indicators (no custom calculations) and displays real-time data about trend strength, volatility, momentum and multi-timeframe direction — all in one clean panel. Ideal for traders who want a fast overview of market conditions without opening multiple sub-windows. ️ Main Features Display
FREE

Here is the full professional description for your indicator, rebranded as Institutional Trend Candles (ITC) . You can use this text for your Market documentation, user manual, or simply to understand exactly how your tool functions. Institutional Trend Candles (ITC) v1.0 Overview Institutional Trend Candles (ITC) is a specialized trend-following system designed to filter out "retail noise" and visualize the true directional flow of the market. Built specifically for high-volatility assets like
FREE

Investment Castle Engulfing — Never Miss an Engulfing Candle
Whether you scalp or trade the daily, bullish and bearish engulfing candles are some of the most reliable signals — but spotting them across timeframes is tedious and easy to miss. This indicator finds them for you, including an engulfing candle forming on a higher timeframe while you trade a lower one.
What it does for you Automatic engulfing detection: bullish and bearish engulfing candles are flagged for you. Multi-timeframe aware
FREE

LWSWING – Comportamento della struttura degli swing
Prezzo: Gratis
Piattaforma: MetaTrader 5
Tipo: Indicatore delle condizioni di mercato (non automatizzato) Sviluppo questi indicatori e questi EA e ne rilascio alcuni gratuitamente. In cambio, il minimo che chiedo è che mi lasciate un feedback — positivo, negativo o neutro. Se qualcosa funziona, fatemelo sapere. Se qualcosa non funziona, fatemelo sapere lo stesso. Se qualcosa è poco chiaro o non soddisfa le vostre aspettative, ho bisogno di sap
FREE
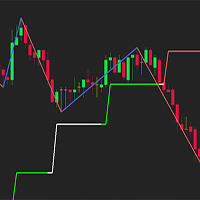
Simple indicator used in technical strategies to analyze tops, bottoms and reversal or continuation points. Developer information:
Line values and colors:
Buffer 0 : ZigZag line value;
Buffer 1 : ZigZag color value;
Buffer 2 : Median line value;
Buffer 3 : Median color value; Buffer to get the values of each top and bottom. Buffer 4 : Top value;
Buffer 5 : Bottoms value;
Buffer that returns the type of the last direction.
Buffer 9: 0 = Not updated, 1 = High, -1 = Low;
This indic
FREE
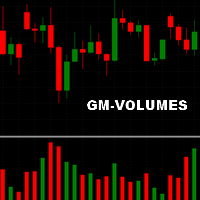
A simple volume indicator according to the color of the candle!
- Custom background!
- Supports Volume by Ticks or Real Volume.
The original Metatrader Volume indicator does not show the colors of the bar according to the color of the Candle, it only changes color when the volume of a candle is greater than the previous one, this sometimes creates confusion for beginners and does not know the real reason for the color change.
Free indicator, support may take a while to respond!
FREE
Descrizione: NR4 & NR7 Inside Bar Highlighter è un indicatore che rileva automaticamente i pattern di compressione del prezzo, basati sulla combinazione di NR4 o NR7 con una candela Inside Bar. Il pattern NR4 (Narrow Range 4) identifica la candela con il range più stretto delle ultime 4 candele, mentre NR7 (Narrow Range 7) considera le ultime 7. Quando queste condizioni coincidono con un’Inside Bar (una candela completamente contenuta all’interno della precedente), si evidenziano situazioni di c
FREE

RSI 2-Level Scanner MT5 Multi-Symbol RSI Reversal Scanner with Clickable Chart Navigation Added the option to scan Market Watch or a custom list, as well as an option to open the chart in different views.
RSI 2-Level Scanner is a practical MetaTrader 5 tool for monitoring multiple symbols at the same time and detecting potential RSI reversal setups. Unlike a standard RSI scanner that only shows overbought or oversold values, this indicator uses a two-level confirmation system . For a LONG setup
FREE

CDS SR Fractal Level: Dynamic Fractal Support & Resistance with Breakout Alerts Overview Tired of manually drawing and updating support and resistance lines? The CDS SR Fractal Level indicator automates this crucial process by intelligently identifying key market levels based on fractals. This lightweight and efficient tool allows you to focus on your trading strategy, not on chart setup, ensuring you never miss an important price level or a potential breakout. This indicator is clean, simple,
FREE

DS Trend is a free trend indicator that colorizes candles directly on the chart, making it easy to identify the current market direction at a glance.
Candle colors: - Blue: uptrend in progress - Gray: neutral market / consolidation - Red: downtrend in progress
Parameters: - Period (default 20): controls the indicator responsiveness to recent price action - Sensitivity (default 2): adjusts the threshold for trend detection
Works on all symbols and timeframes. No repainting. Simple visual read
FREE
The TrendChannelTracker Indicator is an innovative Forex trading tool. This indicator, which is based on the standard Stochastic Oscillator, provides traders with a unique and simplified method for observing market trends. In contrast to the traditional Stochastic Oscillator, which is shown at the bottom of the chart, the TrendChannelTracker Indicator is built into the price action itself. This removes the need for traders to continually switch their attention between the oscillator and the pri
FREE

MSX SuperTrend Visual Indicator Overview MSX SuperTrend Visual Indicator is a MetaTrader 5 indicator designed to display trend direction and market structure using a SuperTrend-based calculation with optional filtering components. The indicator combines trend visualization, volatility measurement and optional EMA-based filtering to provide a clear graphical representation of market conditions. Features • SuperTrend-based trend visualization • ATR-based volatility calculation • Optional Heikin A
FREE

PFG Risk Meter The PFG Risk Meter is a free companion indicator for the PropFirmGuardian EA Suite . It displays real-time daily and total drawdown as visual gauge panels on your chart, giving you instant visual feedback on your prop firm rule status. Features Live daily drawdown gauge Live total drawdown gauge Color-coded warning and danger zones Works on any symbol and timeframe Designed to run alongside the PropFirmGuardian EA Requirements This indicator is part of the PropFirmGuardian EA Suit
FREE
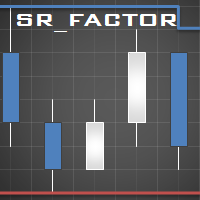
This indicator identifies short-term, medium-term and long-term highs and lows of the market according to the method described by Larry Williams in the book "Long-term secrets to short-term trading".
Brief description of the principle of identifying the market highs and lows A short-term high is a high of a bar with lower highs on either side of it, and, conversely, a short-term low of a bar is a low with higher lows on either side of it. Medium-term highs and lows are determined similarly: a
FREE

Special Offer ... It is totally free for all. New one coming soon...................
About This Indicator: RSI vs SMA Indicator: A Comprehensive Technical Analysis Tool for Better for Identify the Short and Long Signals.
The RSI vs SMA Indicator is a powerful technical analysis tool designed to understanding Market Price Fluctuation for Long or Short signals. This user-friendly Indicator good for both novice and experienced traders, providing valuable indication in price chart and separate wind
FREE

Dynamics Edge: Statistical Precision in Mean Reversion Dynamics Edge is a volatility boundary indicator designed to identify price exhaustion with high precision. Using an advanced standard deviation calculation ( $2.2 \sigma$ ), it maps the extremities where price is statistically likely to return to equilibrium (median). Key Features: Dynamic Exhaustion Edges: Solid lines that expand and contract based on volatility, identifying overbought (Blue) and oversold (Red) zones. OCR-Ready Price Tags:
FREE
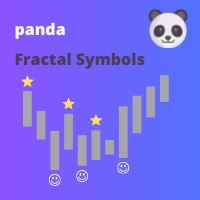
This indicator displays fractal symbols and bars Use this indicator to show different symbols for bearish and bullish fractals: Choose from 144 symbols (refer to table below) Colors, size and offset of fractals can be modified Fractal price bar or candle color can be changed Hide fractals and show fractal price bar only Frequency in fractal calculation can be changed
How to use 1. Select which symbols to use for bearish and bullish fractals; 2. Select which colors to use for bearish and bullis
FREE
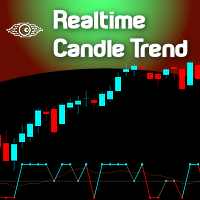
Seeing and interpreting a sequence of Candlesticks is easy to spot when you are a human... Higher Highs, Higher Lows, are the panorama of a Buying trend, at least in a short period of time... Seeing a current candlestick higher high and a lower candlestick low, as a human, you can immediately spot a "divergence", an "alert", a "starting range", but in the end and based on other analysis a human trader can understand and behave accordingly to this kind of candlestick data... But what about EAs (r
FREE
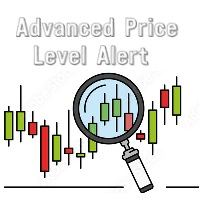
Advanced Price Level Alert The Advanced Price Level Alert is a powerful price-monitoring tool designed for traders who need reliable and customizable price-level alerts. This indicator combines visual price-level tracking with flexible alert mechanisms to keep you informed of important price movements without requiring you to constantly monitor your charts. Key Features Customizable Alert Frequencies – Choose from six different alert-frequency settings, ranging from 1 to 20 alerts per minute. Mu
FREE

Candle Status Pro – Multi-Timeframe Candle Status for MetaTrader 5 Candle Status Pro is a professional multi-timeframe indicator for MetaTrader 5 that displays the status of both the last closed candle and the current active candle across multiple timeframes in a clean and easy-to-read panel. Instead of displaying a countdown timer, the indicator visualizes the direction of each candle using colored candle icons. This allows you to instantly see whether the last or current candle of any selected
FREE
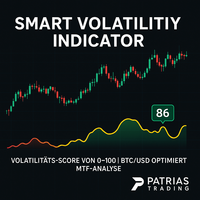
Smart Volatility Indicator – Precise Volatility Detection for MetaTrader 5 The Smart Volatility Indicator is an innovative tool for accurately measuring market volatility – specifically developed for MetaTrader 5. It combines candle range, wick ratios, and smart filtering logic into a clear, scalable volatility score from 0 to 100 . Perfect for traders who want to respond to breakouts, trend dynamics, or consolidating markets – manually or via Expert Advisors (EAs). Key Features Smart Volatility
FREE

This indicator is based on the Heiken Ashi indicator. It helps the user identifying whether to buy or sell. It comes with an alert that will sound whenever a new signal appears. It also features an email facility. Your email address and SMTP Server settings should be specified in the settings window of the "Mailbox" tab in your MetaTrader 5. Blue arrow up = Buy. Red arrow down = Sell. Line = Trailing Stop. You can use one of my Trailing Stop products that automatically move the Stop Loss and inc
FREE

Volume Color paints your candles by volume strength, so you can instantly see which price moves are backed by real participation — and which are just noise. No indicator window, no clutter. Just your normal chart, with candles color-coded right where you look. HOW IT WORKS Every candle is compared to the average volume of the last N bars and colored accordingly: - BRIGHT candle = high volume — strong participation, likely institutional activity. These moves matter. - NORMAL candle = average v
FREE
Session Bias & Trade Signals in one tool. Detects Asia, London & NY session trends, shows bias strength, alerts bias flips, and plots Entry/SL/TP levels with R:R. Simple dashboard for quick decisions. Simple but powerful trading assistant. This indicator automatically detects the market bias during the Asia, London, and New York sessions .
It helps traders stay on the right side of the trend, avoid neutral zones, and catch bias flips with alerts. Bias Detection – Shows session bias as Bullish
FREE

Trade Details Tracker is a lightweight yet powerful chart-panel designed to give traders instant visibility into their open positions. Instead of checking multiple terminal tabs, this indicator displays real-time trade statistics directly on the chart , helping you manage risk, monitor exposure, and make faster decisions. Key Features Real-Time Trade Overview
Instantly view Buy & Sell trade counts for the active symbol. Automatic Breakeven Calculation
Volume-weighted breakeven
FREE

Expert Advisors often use a channel around standard MAs. The indicator builds such a channel and has three buffers: MA, MA Channel Top and MA Channel Bottom.
Now with the help of this single indicator you can plot a channel around the MA on the chart similar to similar Envelopes or Bollinger Bands.
There are a lot of strategies for using it: on the breakout of borders or on the bounce from them.
FREE

QuantSystem Multi Timeframe Panel QuantSystem Multi Timeframe Panel is a free MetaTrader 5 indicator that displays the current market direction across several important timeframes in a clean chart dashboard. The indicator was developed to give traders a fast, clear and structured overview of the current multi-timeframe market situation. Instead of opening each timeframe manually and checking several indicators separately, the panel summarizes the most relevant information directly on the chart.
FREE
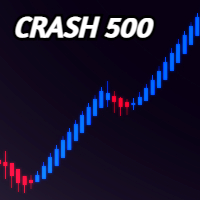
FOR CRASH 500 ONLY!! MT5
*This is a smooth heiken ashi setup meant to be used on CRASH 500 in combination with other indicators. *You are welcome to test it on other markets aswell. *I will be posting other indicators aswell to help with trading the crash 500 market. *You can use this to help smooth out price if you do struggle with reading the charts as is. * Just note heiken ashi doesnt represent real price action only smoothes it out for ease of read.
FREE

LZ Multi-Timeframe Candle Timer displays the remaining time before the current bar closes for multiple timeframes simultaneously on a single dashboard. Monitor up to 9 timeframes (M1, M5, M15, M30, H1, H4, D1, W1, MN1) without switching charts. The indicator uses server time, updates every second, and is optimized for smooth display with minimal CPU use.
Feature highlights
- Multi-timeframe display: select which timeframes to show (M1 through MN1) via boolean inputs. Display only the interval
FREE

The Forex Gangster Indicator allows you to determine the current trend. If the Forex Gangster Indicator line has moved below the price and turned blue, then you should open deals for an increase. If the Forex Gangster Indicator line has appeared above the price and turned red, then you should open deals for a decrease: The indicator is suitable for any time frames, but it needs to be supplemented with filtering indicators, since by itself it is late and does not have time to give an accurate si
FREE

Master SuperTrend for MetaTrader 5 Description Master SuperTrend is a technical indicator developed for MetaTrader 5 to provide a clear visual representation of market trend direction based on price movement and volatility. The indicator uses the classic SuperTrend calculation based on Average True Range (ATR). It combines current price behavior with market volatility to calculate a dynamic trend line that follows price movements on the chart. Trend Analysis Master SuperTrend automatically ident
FREE

About This Indicator: RSI vs SMA Oscillator: A Comprehensive Technical Analysis Tool for Better View of Market Price
The RSI vs SMA Oscillator is a powerful technical analysis tool designed to understanding Market Price Fluctuation for buy or sell signals. This user-friendly Oscillator good for both novice and experienced traders, providing valuable insights into market trends and price movements. Key Features: - RSI Cross Alert: The indicator is based on the Relative Strength Index (RSI), a pop
FREE
A Renko Tick chart based on continuously adjusting percentage.
Live Renko bricks formed by tick data
Adjustable brick width expert for indicator attached Scalp with a Renko, get weird.
The settings can and will break the script if you turn them up too high. Turning off outline mode will not look as nice, but can potentially allow for a larger number of bricks.
FREE

Smc Trend Heatmap The Smc Trend Heatmap is a free multi-timeframe bias dashboard for MetaTrader 5. It scans five timeframes simultaneously - M5, M15, M30, H1, and H4 - and shows the current trend direction on each using a three-condition EMA logic. The dashboard updates continuously in a corner panel and provides an overall bias summary across all active timeframes. The indicator does not draw lines or arrows on the price chart. It operates entirely as a panel and can be placed on any chart rega
FREE

Institutional Price Discovery & Automated Structure Mapping
The Adaptive Auction Range Engine MT5 is a professional-grade structural mapping tool engineered for traders who specialize in Auction Market Theory , Liquidity Sweeps , and Market Structure Shift (MSS) . Unlike standard fixed-period box drawing indicators that clutter your screen with dead data, this engine tracks the physical footprint of institutional volume footprint in real time. It uses a Price-Adaptive Algorithm that d
FREE
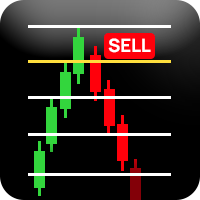
How the Sell Signal Works 1. Bollinger Band condition The current candle must close at or above the Upper Bollinger Band . This signals potential overbought conditions. 2. OBV confirmation (On Balance Volume) OBV must be falling → OBV_now < OBV_prev . Stronger confirmation: OBV decreasing for 2–3 consecutive bars. This shows that buying pressure is weakening . 3. ATR filter (Average True Range) Current ATR must be below its moving average (e.g., ATR_now < ATR_SMA(14) * 1.2 ). Purpose: avoid ente
FREE
️ IMPORTANT: EVALUATION VERSION - LIMITED SYMBOL SUPPORT This indicator is currently available for EVALUATION PURPOSES ONLY and supports only: EURUSD Volatility 50 (1s) Index The indicator will not function on any other trading symbols. Richchild Quarters Theory Indicator EVALUATION Professional Market Structure Analysis Tool Overview This is a professional trading indicator designed to analyze market structure using dynamic range calculations and quarter-based price analysis. The indicator
FREE

English Features I. Overview FAN PA Pro is a professional MT5 trading assistant indicator that integrates multi-timeframe mini candles, trend strength scoring, and key level alerts, helping traders quickly identify market structure and high-probability setups. II. Core Features Module Description Multi‑TF Mini Candles Displays three user‑defined timeframe mini charts (default M15/H1/H4) on the top‑right corner, allowing multi‑timeframe structure analysis without switching charts Trend Identifi
FREE

Path of Candle Stick (Version.2) — Advanced Multi-Bollinger Band Volatility Navigator. "Not flawless, but priceless in purpose."
*** Push notifications are now available in this second version. "เปิดใช้งานระบบแจ้งเตือนแบบ Push notification แล้วในเวอร์ชันที่สองนี้"
Path of Candle Stick - The Quad-Bollinger Band Signal for MT5. *** Stop guessing where the next candle will close! *** Stop trading inside messy, cluttered charts! Maps out the exact mathematical corridors of the market using
FREE

STAMINA HUD – Advanced Market & Trend Dashboard (MT5) STAMINA HUD is a professional market information panel designed for traders who want clarity, speed, and control directly on the chart. It provides a clean heads-up display (HUD) with essential market data and multi-timeframe trend direction , without cluttering the chart or generating trading signals.
What STAMINA HUD Shows Current Price
Spread (in real pips)
Today High–Low range (pips)
Average D
FREE
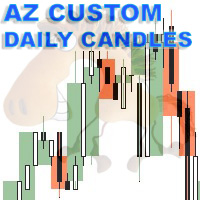
AZ_custom_daily_candle The indicator allows you to draw the contours of daily candles on small timeframes, plus you can customize the display of, for example, an H1 candle and see how it looks on the M5 chart (I think this is a useful setting for scalping). Further, it is possible to shift the beginning/end of drawing candles, change the background color, line thickness. Suggestions and wishes are welcome. v 1.05 (31/03/2025)
By demand, I have added the ability to turn on/off daily maximum/mini
FREE

MT5 Alert Indicator Please add Ema moving averages 60/100/200 & Rsi period 10 levels 30/70 to your chart. This indicator alert on a trend reversal strategy were - ema 60 > 100&200 - ema 100 < 200 And the Rsi is below 30 FOR BUY SIGNAL
Use this strategy in confluence with a larger timeframe trend in the same direction. This strategy identifies great entry opportunities to enter an early trend.
FREE
Sai perché MetaTrader Market è il posto migliore per vendere strategie di trading e indicatori tecnici? Non c'è bisogno di pubblicità o di protezione del software, nessun problema di pagamento. Tutto ciò è fornito da MetaTrader Market.

Ti stai perdendo delle opportunità di trading:
- App di trading gratuite
- Oltre 8.000 segnali per il copy trading
- Notizie economiche per esplorare i mercati finanziari
Registrazione
Accedi
Accetti la politica del sito e le condizioni d’uso
Se non hai un account, registrati