Conheça o Mercado MQL5 no YouTube, assista aos vídeos tutoriais
Como comprar um robô de negociação ou indicador?
Execute seu EA na
hospedagem virtual
hospedagem virtual
Teste indicadores/robôs de negociação antes de comprá-los
Quer ganhar dinheiro no Mercado?
Como apresentar um produto para o consumidor final?
Indicadores Técnicos para MetaTrader 4 - 26
Indicador Volume Profile Pro Este indicador é a ferramenta Volume Profile Pro , que ajuda a analisar "em que preço ocorre a maior negociação". Possui os seguintes recursos aprimorados: Modos de Exibição (Display Modes) Volume Profile (Normal): Mostra o volume total de negociação (Total Volume) em cada faixa de preço para identificar zonas importantes de suporte e resistência. Delta / Money Flow: Mostra a "diferença" entre a pressão de compra e venda (Buy vs Sell), indicando quem controla o merca

Necessary for traders: tools and indicators Waves automatically calculate indicators, channel trend trading Perfect trend-wave automatic calculation channel calculation , MT4 Perfect trend-wave automatic calculation channel calculation , MT5 Local Trading copying Easy And Fast Copy , MT4 Easy And Fast Copy , MT5 Local Trading copying For DEMO Easy And Fast Copy , MT4 DEMO Easy And Fast Copy , MT5 DEMO
The homeopathic indicator is also called the CCI indicator. The CCI indicator was proposed
FREE
The statistical indicator for the metatrader 5 TradingStatisticPro collects statistical data on your trade, which makes it easier to assess the effectiveness of trading, the profit received and the risks. The indicator is compactly placed in the corner of the main chart of the terminal and displays the following information: 1. The profit earned. 2. Maximum drawdown. 3. The recovery factor. 4. Profit factor. 5. The ratio of profitable and unprofitable transactions (winrate). 6. Average profit a
FREE
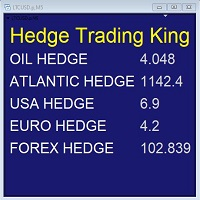
Hedge Trading Monitor e' il mio indicatore che monitora a colpo d'occhio la differenza o il ratio tra due asset utili per fare Hedge trading.
Come si utilizza + scaricare l'indicatore + applicare l'indicatore su un grafico aperto + si possono cambiare gli asset agendo nelle impostazioni.
Distribuzione + e' distribuito solo su MQL5.vom + licenza gratuita (FREE)
FREE

An indicator for visualizing time ranges of key trading sessions: Asian, European, and American. The indicator features functionality for setting the start and end times of each trading session, as well as an adjustable timezone of the trading server. The main advantages of the indicator include the ability to operate with minimal CPU load and memory usage. Moreover, it offers the option to specify the number of displayed historical days, providing the user with flexible market dynamics analysis
FREE

Description:
This indicator (with its algorithm) marks relative highs and lows, which have an array of useful applications.
This indicator will never repaint.
Features:
Marks relative highs and lows Use this to determine points of trend continuation i.e. where the trend may pull back before continuing higher or lower, past this point Or use this to determine potential points of reversal, particularly in ranging markets, or with other price action These highs and lows can sometimes be us
FREE
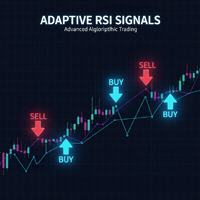
Powered by SVX Strategies Quant Team This is the full implementation of our "Self-Adaptive Trading Rules." It combines Market Structure (Dynamic Support & Resistance) with Adaptive RSI intelligence to generate high-probability buy and sell signals. Want this strategy fully automated?
Manual execution requires constant screen time. If you prefer to have our team manage the execution for you, copy our official algorithms: Copy "Friday Pulse" (Conservative/Stable) Copy "SVX AI Systems" (High Growt
FREE

There are time periods in the market, when trading is highly likely to be unprofitable. This indicator warns you about such non-trading situations and helps you preserve your money and time.
Parameters Remind about non-trading periods: Expiration week - remind about the expiration week Consumer index day - remind a day before the release of Consumer index day NON FARM - remind a day before the release of NON FARM Christmas - remind a day before Christmas New Year Days 25.12 - 15.01 - remind abo
FREE

Dominate the Market with CCI Crossover Master! Stop guessing and start trading with confidence ! The CCI Crossover Master indicator is your secret weapon for capturing high-probability moves based on proven momentum and trend analysis. It simplifies the complex " CCI Crossover Master " strategy, giving you crystal-clear Buy and Sell signals directly on your chart. Key Advantages That Drive Your Success: Precision Entry Signals: Never miss a high-potential trade again. The indicator generates sh
FREE

This is the Indicator is free to use and based on my "TheTurtleTrader" EA. Introducing the Turtle Traders Donchian Channel Indicator – inspired by an advanced trading system by the legendary Turtle Traders of the early 1980s, designed to bring authentic and diverse strategies to your trading portfolio.
Core Strategy:
This Indicator leverages a proven breakout strategy by displaying the highest high or lowest low over a defined period. Whether you prefer quick scalping trades or long holdin
FREE
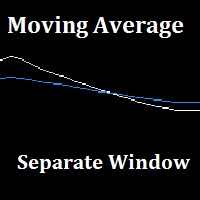
"Separate Moving Average" is a custom indicator made from the combination of 2 moving averages in a different window (the indicator window) for the goal of removing the clutter from the price chart, the indicator also has arrows to show the moving average cross either long or short. All the moving average parameters are customizable from the indicator input window.
FREE

Indicator overview Trend indicator usage Moving averages. Highest quality alerts that need no introduction. It is completely loyal to the original algorithm and uses other useful features.
Easy to trade Carry out all kinds of notifications It's not a new paint and it's not a back paint. Setting Indicator SMA50 in Time frame H1 for any pair currency and Gold Spot. EMA200 in Time frame H1 for any pair currency and more than EMA250 for Gold spot. Using it for maximum benefit Set up notification
FREE

This indicator provides a statistical analysis of price changes (in points) versus time delta (in bars). It calculates a matrix of full statistics about price changes during different time periods, and displays either distribution of returns in points for requested bar delta, or distribution of time deltas in bars for requested return. Please, note, that the indicator values are always a number of times corresponding price change vs bar delta occurred in history. Parameters: HistoryDepth - numbe
FREE
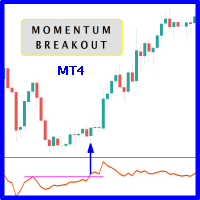
When prices breakout resistance levels are combined with momentum oscillator breaks out its historical resistance levels then probability emerges to record farther prices. It's strongly encouraged to confirm price breakout with oscillator breakout since they have comparable effects to price breaking support and resistance levels; surely, short trades will have the same perception. Concept is based on find swing levels which based on number of bars by each side to confirm peak or trough and in tu
FREE

Commodity Channel Index and Moving Average [CCI MA] A combination of CCI and MA to create a crossover trading setup Input parameters: signal mode: set it to true if you want to plug it into STAT (Signal Tester and Trader) arrow shift: distance between fast EMA line to arrow on chart price line filter CCI period CCI price method Moving average period Averaging method upper level lower level You can find the best setting for 4 hour EURUSD on this video
FREE

Melhore sua experiência de trading com o indicador Your Chart! Esta ferramenta gratuita e altamente personalizável permite que os traders combinem vários períodos de tempo em uma única exibição limpa de velas, sem alterar o gráfico original. Com o Your Chart, você pode ajustar o número de barras por cada vela personalizada – por exemplo, combinar cada 18 velas de M1 em uma só para ter uma visão mais ampla das tendências do mercado. Características principais: Formação de velas personalizadas : E
FREE

Título do produto Smart Alligator (MT4) – parte da série SmartView Descrição breve Indicador Alligator com experiência de usuário única na plataforma MetaTrader. Oferece capacidades avançadas não disponíveis anteriormente, como abrir configurações com duplo clique, ocultar e mostrar indicadores sem excluí-los, e exibir a janela do indicador em tamanho completo do gráfico. Projetado para funcionar perfeitamente com o restante da série SmartView Indicators. Visão geral A série SmartView oferece um
FREE

BB-Sub – Bandas de Bollinger na janela secundária BB-Sub é um indicador simples, porém poderoso, que exibe as Bandas de Bollinger de forma independente em uma janela secundária do gráfico. Diferente das Bandas de Bollinger padrão, que aparecem no gráfico principal, o BB-Sub funciona em uma subjanela separada. Isso evita sobreposição com candles ou outros indicadores, sendo ideal para quem deseja focar exclusivamente no movimento e nas mudanças de formato das bandas. Principais características Ex
FREE

“Gold Miner Robot” is a very powerful AI-Based robot designed and built to accurately analyze the market and trade on gold. Developed by “Keyvan Systems” after more than 3 years of research and development on each tick of the gold chart. "Gold Miner Robot" uses a complex algorithmic approach based on price analysis, trend analysis. We have also provided two other personalized indicators called "GoldMinerRobot SI 1" and "GoldMinerRobot SI 2" for better market analysis, which you can download free
FREE

"IF YOU'RE LOOKING UNIQUE TRADING INDICATOR… AT AN AFFORDABLE PRICE… YOU'VE COME TO THE RIGHT PLACE!" Additional bonus: You get the Forex Trend Commander Indicator absolutely free! Successful traders can turn any not-so-good trading system into a profitable one by using proper money management! With two built-in systems DayTradingArrow v1 generates a high percentage of successful trades. The indicator gives an incredible advantage to stay on the safe side of the market by anyone who uses it.
B

The Red Dragons Support and Resistance Levels indicator automatically determines support and resistance levels using the proprietary algorithm based on historical and current data, so the levels are dynamic, which allows you to adjust trading targets based on the current price movement. For this reason, we use this indicator in our advisors, for example, Red Dragons, which you can purchase here:
https://www.mql5.com/en/market/product/128713?source=Site +Market+MT4+New+Rating006
The panel also
FREE

This indicator is based on Mr. Mark Fisher's ACD strategy, based on the book "The Logical Trader."
- OR lines - A lines - C lines - Daily pivot range - N days pivot range - Customizable trading session - Drawing OR with the desired time Drawing levels A and C based on daily ATR or constant number - Possibility to display daily and last day pivots in color zone - Displaying the status of daily PMAs (layer 4) in the corner of the chart - Show the order of daily pivot placement with multi-day pi
FREE

This indicator integrates the Bollinger Band strategy in calculation with a volume-over-MA
calculation to further narrow down "Areas of Interest" levels for a potential re-test zone to the right of the chart.
We added a Moving Average calculation for a multi-level cloud and further broke down more conditions to highlight both
volume flow crossover on the High and Extreme High MA's and also high and extreme high volume spikes on set period average
without bull\bear conditions. Original Bull/Bear
FREE

RaysFX StochRSI Presentiamo un indicatore MQL4 sviluppato da RaysFX, un rinomato sviluppatore nel campo del trading algoritmico. Questo indicatore è una combinazione semplice ma potente di due indicatori popolari: RSI e Stocastico. Caratteristiche principali: RSI : Un indicatore di momentum che misura la velocità e il cambiamento dei movimenti dei prezzi. Stocastico : Un indicatore di momentum che confronta il prezzo di chiusura di un titolo con la gamma dei suoi prezzi durante un certo periodo
FREE

Представляем "Dragon_Structure_Filter" — это не просто индикатор. Это ваш личный аналитический отдел, встроенный в MetaTrader 4. Он находит мощнейший разворотный паттерн "Дракон" и пропускает его через 7 степеней защиты от убыточных сделок. Наша Технология Фильтрации: Как Мы Отсеиваем 95% "Мусорных" Сигналов Каждый фильтр — это ваш личный страж, который стоит на защите вашего депозита. Вот как они работают: Фильтр 1: Согласование с Глобальным Трендом (Market Structure Filter) Как работает?
FREE

Supply and Demand indicator does not repaint as it counts the number of tests/retests occurred in the past x number of times. As a trader you need a path to be able to place your buy and sell trades such as: Supply and Demand, Falling & raising channels . Experienced trades will draw the key levels and channels around the timeframes. But, they will not be able to draw them on the small time frames as the price changes too frequent. This indicator is based on Shved supply and demand indicator, b
FREE

Está cansado de perder tempo tentando descobrir o valor total das suas linhas de TP e SL nos gráficos do Metatrader? Não procure mais, porque temos a solução para você. Apresentamos nosso indicador MT4 gratuito que permite que você rastreie facilmente o total de SL e TP de suas posições em qualquer canto da sua tela. Com parâmetros X-Y personalizáveis e opções de cores, você pode personalizar sua tela para se adequar ao seu estilo de negociação. Diga adeus à complicação e confusão do monitoramen
FREE

TILLSON MOVING AVERAGE Também conhecido como indicador TMA ou T3. É uma média móvel que usa EMA e DEMA em sua fórmula e é calculada com uma expansão binomial de 3º grau . Prós; 1- sinais errados encontrados em outras médias móveis ( zig contínuo zag ) foi reduzido o máximo possível. 2- evitou os atrasos observados nas médias móveis clássicas . 3- Muito sucesso em tendências Contras 1- Não é eficaz em mercados horizontais. Parâmetros de configuração; period; Embora o valor
FREE

Advanced Renko & Point & Figure Indicator with Win/Loss Pattern Analysis This powerful indicator combines two proven strategies—Renko and Point & Figure (P&F)—into one comprehensive tool for trend identification, pattern recognition, and risk management. With dynamic Box Size calculation (Fixed or ATR-based), moving average filters, and win/loss pattern detection, traders can make smarter, data-driven decisions.
Key Features
Hybrid Renko + P&F System Renko: Noise-free price action with fixed
FREE

Após 7 anos, decidi liberar alguns dos meus próprios indicadores e EAs gratuitamente.
Se você os achar úteis, por favor Mostre seu apoio com uma avaliação de 5 estrelas! Seu feedback mantém as ferramentas gratuitas chegando! Veja também as minhas outras ferramentas gratuitas aqui
_________________________________ Indicador %B para Análise Avançada de Forex O Indicador %B, habilmente criado em MQL4, é uma ferramenta dinâmica destinada a revolucionar a análise de Forex. Utilizan
FREE

Features: Find these engulfing patterns: Simple Engulf Stick Sandwich Engulf Three Line Strike Rising Three Morning Star Doji Scanner is useful to make your strategy better. Don't always go by Win/Loss percentage. Because this tool is not based on past results. Basic Settings: For All Patterns You can set: First:Last Candle Ratio This will make sure that the earlier opposite candle is at least this given ratio in height as compared to the engulfing candle. This is not checked for Three Line Stri
FREE

"Capture the sleeping and waking alligator." Detect trend entrance/exit conditions - this indicator can also be tuned according to your trading style. You can adjust a confidence parameter to reduce false positives (but capture less of the trend). This is based on a modification of the Alligator indicator by Bill Williams, an early pioneer of market psychology. 2 main strategies: either the " conservative" approach to more frequently make profitable trades (at a lower profit), or the " high r
FREE

Indicator. Zones of support and resistance levels The most reliable tool in the hands of any technical analyst is support and resistance levels.It is these levels that magically work in the market, because the price then bounces off them, on the contrary, gaining maximum acceleration, punching them and striving for a new price point.However, in practice, many beginners face enormous difficulties in building them.This is due to the fact that the price may react quite differently to them, and ofte
FREE
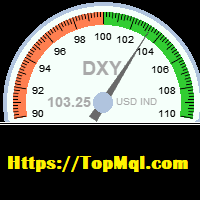
This indicator is used to calculate the dollar index according to the formula of currency pairs(EURUSD ,GBPUSD,USDJPY,USDSEK,USDCHF,USDCAD)Even if the broker does not have the dollar symbol. this Indicator displays the dollar index chart in a separate window at the bottom of the chart. It also displays the current dollar index graphically. In this indicator, it is possible to set the minimum and maximum value of the indicator as well as its size scale on the chart as an input parameter, and it
FREE

This Indicator is based on Mr. Dan Valcu ideas.
Bodies of candles(open-close) are the main component used to indicate and assess trend direction, strength, and reversals.
The indicator measures difference between Heikin Ashi close and open.
Measuring the height of candle bodies leads to extreme values that point to trend slowdowns. Thus quantifies Heikin Ashi to get earlier signals.
I used this indicator on Heiken Ashi charts but, it's possible to choose to calculate Body size based on Heik
FREE

A simple and highly effective Strength and Weakness currency indicator that can be used to aid your fundamental and technical analysis for winning trade decisions.
The indicator is very easy to use and can be applied to all time frames.
FX Tiger uses an advanced algorithm to calculate a score table for all major currencies. Each major currency will have a score from 7 to -7. A score of 5 and above indicates currency strength and a score of -5 and below indicates currency weakness. Once you ha
FREE

The indicator is based on the concept of price channels, which are formed by plotting the highest high and lowest low prices over a specified period of time. The Donchian Channel Indicator consists of three lines: an upper channel line, a lower channel line, and a middle channel line. The upper channel line represents the highest high over a specified period, while the lower channel line represents the lowest low. The middle channel line is the average of the two and can be used as a reference f
FREE

The purpose of this new version of the MT4 standard indicator provided in your platform is to display in a sub-window multiple timeframes of the same indicator. See the example shown in the picture below. But the display isn’t like a simple MTF indicator. This is the real display of the indicator on its timeframe. Here's the options available in the FFx indicator: Select the timeframes to be displayed (M1 to Monthly) Define the width (number of bars) for each timeframe box Alert pop up/sound/ema
FREE

SRP (Strong Retracement/Reversal Points) is a powerful and unique support and resistance indicator. It displays the closest important levels which we expect the price retracement/reversal! If all level are broken from one side, it recalculates and draws new support and resistance levels, so the levels might be valid for several days depending on the market!
Key Features You can use it in all time-frames smaller than daily! Displays closest significant support and resistance levels Update the le
FREE

Variable Index Dynamic Average (VIDYA) developed by Tushar Chande by default is contained in MT5 but not in MT4 platform and it is a dynamic EMA (Exponential Moving Average) that adjusts its Length (LB Period) automatically in response to Market Volatility originally measured through the Chande Momentum Oscillator(CMO). CMO value is used as the ratio to the smoothing factor of EMA ( The New Technical Trader by Tushar Chande and Stanley Kroll, John Wiley and Sons, New York, 1994). The higher th
FREE

Este indicador é baseado no original “ Time Segmented Volume (TSV) ” desenvolvido pela Worden Brothers, Inc . No entanto, adicionei alguns recursos extras a este. Pode-se escolher o preço a ser aplicado, em vez de ter apenas o preço de fechamento padrão usado pelo original. Também é possível escolher qual ponderação de volume a utilizar, incluindo um pseudo-volume baseado no intervalo real, ou nenhuma ponderação de volume.
FREE

Price Difference O indicador mostra a diferença entre os preços de abertura e fechamento. O indicador em uma janela separada é a diferença entre os preços de abertura da barra atual e os preços de fechamento da barra anterior. O quadro no canto superior esquerdo é a diferença entre os preços de abertura e fechamento da barra atual.
Configurações Count_Bars - o número de barras para exibir os dados do indicador, em 0 ele é exibido em todas as barras disponíveis; display - habilita a exibiç
FREE

Use GANN 369 to use a combination of 30's,60's,90's time to cross 3's,6's,9's. Any larger combination of these cross smaller combinations of these
Using GANN 369 Method for Trading Reversals The GANN 369 method, inspired by the works of W.D. Gann and Nikola Tesla's 3, 6, 9 numerical patterns, can be employed to identify potential reversals in financial markets. By combining specific periods (30, 60, and 90) with the numbers 3, 6, and 9, traders can seek opportunities for trend changes.
FREE

It's a simple but useful tool for creating a grid based on Bollinger Bands .
Only 2 parameters can be set: 1) "Period" - the period of all visible Bollinger Bands (i.e. 4) and 1 Moving Average (axis of all Bollinger Bands), 2) "Deviations Distance" - the distance between Bollinger Bands.
Naturally, the colors of all 9 lines can be changed as desired. It works with everything that is available in your Market Watch.
Good luck!
FREE

Highlights trading sessions on the chart
The demo version only works on the AUDNZD chart!!! The full version of the product is available at: (*** to be added ***)
Trading Session Indicator displays the starts and ends of four trading sessions: Pacific, Asian, European and American. the ability to customize the start/end of sessions; the ability to display only selected sessions; works on M1-H2 timeframes;
The following parameters can be configured in the indicator:
TIME_CORRECTION = Correct
FREE

ITS FREE I Recommend www.CoinexxBroker.com as a great broker and the one I personally use Asia session 1:00 to 9:00 (6pm est to 2 am est) Eur means London Session 10:00 to 18:00 (3 am est to 11 am est) USA means New York Session 15:00 to 23:00 (8 am est to 4 pm est) Session indicator highlights the start of each trading session. You can show all sessions or edit the settings to only show the hours you want highlighted (Asia) means Asian Session ,(Eur) means London Session , (USA) means New
FREE

The RSI Arrows MTF indicator is based on the RSI indicator. Represents input signals in the form of arrows. It has 6 types of calculation. All signals are generated on the current bar of the selected period.
Signals do not redraw in the first 4 modes! But it is possible to redraw in cases of a sharp change in market movement.
All signals in MTF mode correspond to signals of the period specified in MTF. It is maximally simplified to use both for trading with only one indicator and for using t
FREE

Eu criei este indicador simples enquanto estava aprendendo sobre o TheStrat de Rob Smith e o achei tão útil que pensei em compartilhá-lo com você. Se você achar útil, veja os outros indicadores que publiquei no MQL5. O indicador simplesmente desenha uma única linha no gráfico mostrando o nível de preço que você seleciona em um período de tempo mais alto. Usando as configurações, você tem controle total sobre o período de tempo exibido, mas, por padrão, ele calcula o período de tempo mais alto,
FREE

Título do produto Smart ADX (MT4) – parte da série SmartView Descrição breve Indicador ADX com experiência de usuário única na plataforma MetaTrader. Oferece capacidades avançadas não disponíveis anteriormente, como abrir configurações com duplo clique, ocultar e mostrar indicadores sem excluí-los, e exibir a janela do indicador em tamanho completo do gráfico. Projetado para funcionar perfeitamente com o restante da série SmartView Indicators. Visão geral A série SmartView oferece uma experiênci
FREE

This indicator displays each bar's volume in points as a histogram. The second version of the indicator. Now it is represented as an oscillator. It is more informative and functional. At that it does not load the main chart. GitHub It displays: bar's volume in points as a histogram (buffer 0) average value of the volume for the whole period (buffer 1) bars upper than the client average value with another color (buffer 2) average value of the amount of bars set by a user (buffer 3) Also: setting
FREE

FractZigER calculates reversal vertices on the chart and connects them by lines individually for High and Low and complements the chart with lines by bottoms for High and Low in a similar way. Only one parameter is used for setup (ReachBars - number of neighbouring bars for plotting a vertex), as well as one parameter for drawing into history (DRAWs - number of bars in history to be used in calculation). Use the indicator the same way you previously used ZigZags and indicators based on fractals,
FREE

This indicator displays potential price levels, support and resistance levels, highest and lowest price levels for Asian, European and American sessions. It works for the day that you select from user interface. It is suitable for gold, bitcoin, all currencies, commodities, crypto currencies and all investment instruments on the metatrader. You can use on the your day trade transactions easily. This indicator is for metatrader4 platform.
FREE
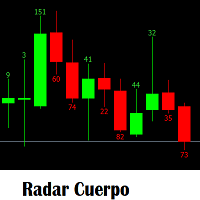
Indicador que sirve mirar el tamaño de velas segun el tamaño te genere alerta para hacer entradas manuales. Aprovechenlo al maximo que una plantea estrategia a vaces del tamñao de la vela anterior o de la misma vela actual. para entran a comprar y vender. Es un indicador que es necesario para cualquier analisis que se tome para una entrada nueva. Sera su herramienta preferida.
FREE

Enhance your price action strategy: inside bar breakouts at your fingertips
This indicator detects inside bars of several ranges, making it very easy for price action traders to spot and act on inside bar breakouts. [ Installation Guide | Update Guide | Troubleshooting | FAQ | All Products ] Easy to use and understand Customizable color selections The indicator implements visual/mail/push/sound alerts The indicator does not repaint or backpaint An inside bar is a bar or series of bars which is/a
FREE
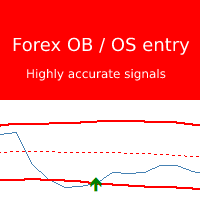
Forex overbought / oversold entry indicator is based on a very powerfull strategy which give very accurate entry arrows. The indicator place arrows on "new candle" and does NOT repaint! This indicator is a MUST HAVE if you trade with a reversal strategy. This indicator can easely be combined with your other trading indicators to confirm reversals or bottoms. If you have ever had any trouble finding correct entries this indicator is the best available for you! Standard overbought and oversold str
FREE
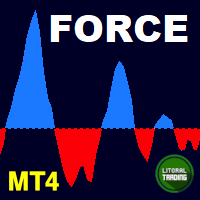
Para quem gosta de tendencia Force será um indicador muito útil. Isso por que ele é baseado no famoso ADX, que mede a força de uma tendencia, porém sem as 3 linhas confusas dele. Force tem sua interpretação muito simples: se o histograma estiver acima do nível zero a tendência é de alta, do contrário é queda. Você pode utilizá-lo para encontrar divergências também, algo muito lucrativo. Se tiver alguma dúvida ou sugestão, por favor, me contate. Faça bom uso!
Versão para o MT5: https://www.mql5
FREE

50% off. Original price: $60 Support and Resistance zones indicator for MT4 is a multi-timeframe panel and alert that finds support and resistance zones and pivot points for all timeframes of MetaTrader 4 and gives alert when price has interaction with them. Download demo version (works on GBPUSD, EURJPY and NZDUSD symbols) Read the full description of scanner parameters in the blog page . Many unique features in one indicator:
Integrating support and resistance zones and pivot points in one i

Indicator Description If you need to know future volatility for trading, this indicator is what you need! With the Predictor of the ATR you trading system will be more perfect. This indicator predicts future volatility, and does it quite well. Prediction accuracy is up to 95% at a distance of up to 5 bars into the future (on the period H1). The average forecast accuracy is about 85%, the number of predicted bars is limited by your imagination only. There are five methods used for prediction. The
FREE

...................................................................................................................... ............rsi................ ...........................................rsi for times M30 and D1............................................. ...............................almost every one uses rsi at 1 time frame but.............................. ..................................when we have 2times rsi what can see .....
FREE

The purpose of this new version of the MT4 standard indicator provided in your platform is to display in a sub-window multiple timeframes of the same indicator. See the example shown in the picture below. But the display isn’t like a simple MTF indicator. This is the real display of the indicator on its timeframe. Here's the options available in the FFx indicator: Select the timeframes to be displayed (M1 to Monthly) Define the width (number of bars) for each timeframe box Alert pop up/sound/ema
FREE

IceFX Heatmap is a special indicator that shows the places where the price has been staying and ranging over the past few days. These sites will be displayed in a "Heatmap style", with which you can clearly see the main formed bands. The main rates (where the price has "lingered/stayed" much) are indicated in bright colors (in case of black-and-white view) or red color (in case of color view).
Settings Days - the number of days the heat(map) is calculated for. Resolution - resolution rate. 10 =
FREE
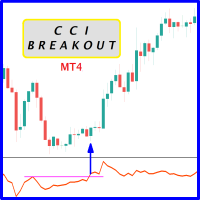
Probability emerges to record higher prices when CCi oscillator breaks out oscillator historical resistance level when exhibit overbought values. Since, oscillator breakout of support and resistance have similar effect as price breaks support and resistance levels, therefore, its highly advised to confirm price breakout with oscillator breakout; certainly, will have the same output in short trades. Concept is based on find swing levels which based on number of bars by each side of peak or trough
FREE

Este indicador baseia-se na experiência prática.
Insira a data/hora do seu topo/base.
Calcula o nível mais visitado desde o topo/base até ao momento atual.
Actualiza-se automaticamente a cada nova vela. Pode utilizar simultaneamente vários indicadores para diferentes tendências e períodos de tempo.
O comprimento é sempre traçado desde o início do seu período até ao presente.
Ferramenta PRO útil.
FREE

This indicator is based on the ADX indicator and indicates the trend very easily.
You can customize the indicator to your needs: ADXPeriod ADXSignal_Level BarWidth CandleWith HeikenAshi
The Adx color candles indicator is fully FREE and compatible with the other part of the system; the Acc arrow >>>> https://www.mql5.com/en/market/product/33770 ENJOY and check out my other indicator: https://www.mql5.com/en/market/product/32111
FREE

This indicator draws regular bullish and bearish divergences in real-time onto the charts. The algorithm to detect those divergences is based on my 10+ years experience of detecting divergences visually. The divergences are drawn as green and red rectangles on the charts. You can even do forward testing in the visual mode of the strategy tester. This FREE Version is restricted to EURUSD and GBPUSD. The full version without restrictions is here: https://www.mql5.com/en/market/product/42732
Param
FREE

The Signal Premium Pro System SMART ANALYZER SYSTEM V3 (2025) – Next Generation Market Intelligence for Traders Smart Analyzer System V3 is a professional trading indicator for Forex, Gold (XAUUSD), and Indices. It provides real-time buy/sell signals, automatic levels, multi-timeframe analysis, and adaptive trading modes for scalping, intraday, and swing strategies. Trade smarter with precision, clarity, and confidence.
forex indicator, xauusd, gold trading, mt4 indicator, mt5 indicator,
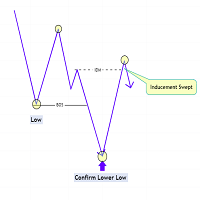
The Market Structure with Inducements & Sweeps indicator is a unique take on Smart Money Concepts related market structure labels that aims to give traders a more precise interpretation considering various factors.
Compared to traditional market structure scripts that include Change of Character (CHoCH) & Break of Structures (BOS) -- this script also includes the detection of Inducements (IDM) & Sweeps which are major components of determining other structures labeled on the chart.
SMC & pri

What is Macro Kill Boxer? Macro Kill Boxer is a technical analysis indicator developed for the MetaTrader platform. It visualizes market movements during specific time intervals (e.g., Asia, London Open/Close, New York AM/PM) by drawing colored boxes on the chart. Each box represents the high and low price levels within the defined time period, often associated with macroeconomic events or high-volatility sessions. What Does It Do? Time-Based Analysis : Displays price movements as boxes for 58 c
FREE

Double Exponential Moving Average ( DEMA ) is a moving average (MA) that gives the most weight to recent price data.Like exponential moving average (EMA), it is more reactive to all price fluctuations than a simple moving average (SMA) and so DEMA can help traders to spot reversals sooner, because it is faster responding to any changes in market activity. DEMA was developed by Patrick Mulloy in an attempt to reduce the amount of lag time found in traditional MAs. ( TASC_Feb. 1994 ). DEMA can al
FREE

Indicador Heiken Aish que gera alertas nas mudanças de direção do mercado. Ameniza a visualização da volatividade do mercado, levando mais calma nas tomadas de decisões. Azul sendo compra e Amarelo sendo venda. Candle sem mecha indica forte tendência, ou seja, candles azuis sem mechas na parte inferior, forte tendência de compra e vice-versa, amarelo sem mecha na parte de cima, forte tendência de baixa.
FREE
O Mercado MetaTrader oferece um local conveniente e seguro para comprar aplicativos para a plataforma MetaTrader. Faça download de versões de demonstração gratuitas de Expert Advisors e indicadores a partir do seu terminal para testes no Testador de Estratégia.
Teste os aplicativos em diferentes modos para monitoramento do desempenho e assim fazer um pagamento para o produto que você deseja, usando o sistema de pagamento MQL5.community.
Você está perdendo oportunidades de negociação:
- Aplicativos de negociação gratuitos
- 8 000+ sinais para cópia
- Notícias econômicas para análise dos mercados financeiros
Registro
Login
Se você não tem uma conta, por favor registre-se
Para login e uso do site MQL5.com, você deve ativar o uso de cookies.
Ative esta opção no seu navegador, caso contrário você não poderá fazer login.