Press review - page 571


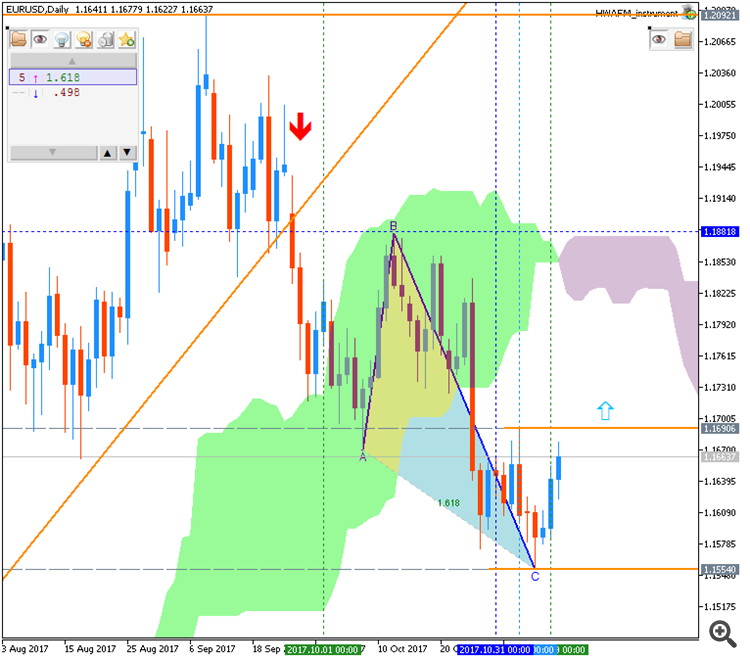
EUR/USD - intra-day bearish ranging within narrow levels for direction (based on the article)

Intra-day H4 price is on narrow ranging to be below Ichimoku cloud: the price is on primary bearsh trend for the ranging within bullish reversal levet at 1.1637 and the bearish continuation support at 1.1553.


  • "On an intraday basis, we can identify an impulse wave lower. Impulse waves can make up larger impulse waves or they can be embedded in the sub-structure of a corrective wave. Regardless of the larger pattern EUR/USD is building, we can count the five wave impulse as completed. The Relative Strength Index divergence on the 4 hour chart is consistent with a fifth wave. Therefore, the higher probability move is a bounce back to 1.17."
  • "Bottom line, the higher probability EUR/USD move is a bounce higher towards 1.17. Depending on the structure higher will then begin to eliminate the continued bullish pattern or if the bearish resolution prevails."

==========

The chart was made on H4 timeframe with standard indicators of Metatrader 4 except the following indicators (free to download):

DailyFX Home
DailyFX Home
  • www.dailyfx.com
On an intraday basis, we can identify an impulse wave lower. Impulse waves can make up larger impulse waves or they can be embedded in the sub-structure of a corrective wave. Regardless of the larger pattern EUR/USD is building, we can count the five wave impulse as completed. The Relative Strength Index divergence on the 4 hour chart is...
 

A 5-year annualized S&P 500 return of 10% or more has never produced an annualized return of over 10% during the next 5 years (based on the article)

Price on the daily chart is on bullish breakout for 2,593 resistance level to be breaking for the bullish trend to be continuing.


  • "One of the biggest challenges facing investment advisors and professional investment managers today is a simple aspect of human nature: getting their clients to avoid emotional extremes in their view of investment returns.  Investment emotions often take on an air of “short-term-ism” whereby recent returns are extrapolated forward.  That is, investors assume that what just happened over the past X weeks, months or years will repeat itself in the next X weeks, months or years.  In stock market history, such an assumption is about as far away from reality as it gets.  So, I conducted a study to put into numbers what my team and I have seen over and over in our collective investment careers."
  • "Specifically, I looked at the 5-year annualized return of the S&P 500 Index as of the end of each month (also known as “rolling” 5-year periods) since 1995.  There were 182 such time periods, so plenty of data from which to draw conclusions.  I divided those 182 periods into two groups: those in which the 5-year annualized return of the S&P 500 was at least 10% (let’s call this Group A), and those in which it was less than 10% (let’s call this Group B).  I wanted to see to what extent a 5-year run of strong returns could continue, since that is what many confident investors are thinking will happen from here forward.  For a current reference point, the S&P 500’s 5-year return as of 7/31/17 is 12.36%, so it lands solidly in Group A.  After all, anyone who has invested in an S&P 500 index fund for the past 5 years must be thrilled."

==========

Chart was made on MT5 with Brainwashing system/AscTrend system (MT5) from this thread (free to download) together with following indicators:

Same system for MT4:

  1. Brainwashing. Trades: manually and using EAs (MT4)
  2. Brainwashing EAs - the thread (MT4)
  3. Brainwashing: system setup for trading manually and for EAs (MT4) - the thread 
  4. Brainwashing: system development (MT4) - the thread
 

Facebook vs. Alibaba = bullish breakout (based on the article)


  • "On Facebook my nose is clear. No fishy smell here and in Alibaba. Actually, after 50 years ciphering, I’ve rarely encountered such high voltage momentum. Maybe Syntex, Polaroid and Xerox in their primacy, but it didn’t hold and they morphed into also-rans, discards and even moribund in Polaroid’s case. The life of a growth stock stands 5 years, rarely 10. Alphabet is a 10 and counting."
  • "Alibaba’s a different business, but comparable meteoric metrics. It’s e-commerce footprint is enormous, some 575 million active customers, still expanding, currently at a 4% sequential rate. This pivotal metric denotes viability of BABA’s franchise. What more could you want?"
  • "So… we’ve got BABA and Facebook pretty much as the same stock in terms of valuation, earnings growth, EBITDA multipliers, employee compensation, research and development spend. You name your own pet metric, it doesn’t change the basic conclusion."

============

Chart was made on MT5 with BrainTrading system (MT5) from this thread (free to download) as well as the following indicators from CodeBase:

All about BrainTrading system for MT5:


USD/CNH Intra-Day Fundamentals: China CPI and range price movement 

2017-11-09 01:30 GMT | [CNY - CPI]

  • past data is 1.6%
  • forecast data is 1.8%
  • actual data is 1.9% according to the latest press release

if actual > forecast (or previous one) = good for currency (for CNY in our case)

[CNY - CPI] = Change in the price of goods and services purchased by consumers. 

==========

From rttnews article :

  • "Consumer prices in China were up 1.9 percent on year in October, the National Bureau of Statistics said on Thursday."
  • "The bureau also said that producer prices advanced an annual 6.9 percent - unchanged from the previous month but topping forecasts for 6.6 percent."

==========

USD/CNH M15: range price movement by China CPI news event 


==========

Chart was made on MT5 with Brainwashing system/AscTrend system (MT5) from this thread (free to download) together with following indicators:

Same system for MT4:

  1. Brainwashing. Trades: manually and using EAs (MT4)
  2. Brainwashing EAs - the thread (MT4)
  3. Brainwashing: system setup for trading manually and for EAs (MT4) - the thread 
  4. Brainwashing: system development (MT4) - the thread
 

Nikkei 225 - long-term bullish trend since the beginning of September this year (based on the article)

Intra-day H4 price is located above Ichimoku cloud in the bullish area of the chart: the price is testing the resistance level at 2,342 to above for the bullish trenbd to be continuing.


  • "The Nikkei 225 has powered up to 26-year highs this week and this is only the latest chapter of an astonishing run higher which began in early September."
  • "Fundamentally the Tokyo equity benchmark’s vigour is partly explained by the return of Prime Minister Shinzo Abe in October’s snap election. A better-than-expected second-quarter earnings season has also helped. Around 62% of listed companies managing to beat estimates, with heavyweights like Sony, Honda and Toyota all pleasing the crowds. Wall Street’s succession of highs and a rising US Dollar have done the rest, taking the index up by more than 20% for the year so far. "
  • "Despite such chunky gains the index appears to be retaining its vigour. Indeed, Thursday’s trade could see it break the uptrend channel which has contained the climb since September the 8- to the upside."

==========

The chart was made on H4 timeframe with standard indicators of Metatrader 4 except the following indicators (free to download):

DailyFX Home
DailyFX Home
  • www.dailyfx.com
The Nikkei 225 has powered up to 26-year highs this week and this is only the latest chapter of an astonishing run higher which began in early September. . A better-than-expected second-quarter earnings season has also helped. Around 62% of listed companies managing to beat estimates, with heavyweights like Sony, Honda and Toyota all pleasing...
 

AUD/USD - daily ranging bearish; 0.7627 is the key (based on the article)

Daily price is below Ichimoku cloud for the ranging within 0.7728 resistance level for the bear market rally to be started and 0.7627 support level for the bearish trend to be resumed.


  • "The Australian Dollar is perched at trend-defining support, with the currency yet to decide on near-term direction against its US counterpart. A series of descending highs and lows argues for a bearish near-term bias but the longer-term view warns that recent losses might have been corrective within a larger advance."
  • "Support is in the 0.7611-25 area (October 27 low, 23.6% Fibonacci expansion), with a daily close below that exposing the 38.2% level at 0.7538 and arguing for a structural tone shift in favor of the downside. Alternatively, a breach of the 23.6% Fib retracement at 0.7743 targets the 38.2% mark at 0.7816."
==========

Chart was made on MT5 with Brainwashing system/AscTrend system (MT5) from this thread (free to download) together with following indicators:

==========

Same systems for MT4/MT5:

The beginning

  1. ASCTrend system, the beginning, part #1
  2. ASCTrend system, the beginning, part #2
  3. ASCTrend system, the beginning, part #3
  4. ASCTrend system, the beginning, part #4 
  5. Digital ASCTrend (Digital Filters with ASCTrend system combined).
  6. LabTrend (LabTrend indicators, LabTrendZigZag, templates, Labtrend EAs) - the thread 

After

DailyFX Home
DailyFX Home
  • www.dailyfx.com
The Australian Dollar is perched at trend-defining support, with the currency yet to decide on near-term direction against its US counterpart. A series of descending highs and lows argues for a bearish near-term bias but the longer-term view warns that recent losses might have been corrective within a larger advance. Support is in the...
 

AUD/USD Intra-Day Fundamentals: Reserve Bank of Australia Monetary Policy Statement and range price movement 

2017-11-10 00:30 GMT | [AUD - RBA Monetary Policy Statement]

[AUD - RBA Monetary Policy Statement] = It provides valuable insight into the bank's view of economic conditions and inflation - the key factors that will shape the future of monetary policy and influence their interest rate decisions. 

==========

From theaustralian article :

  • "The Reserve Bank of Australia has flagged a likely increase in near-term volatility for mineral exports and prices because of uncertainty surrounding China's growth outlook and its decision to cut steel production."
  • "In so far as these policies affect the supply side as well as demand side of commodity markets - through their effects on China's domestic production - they create uncertainty in both directions around the trajectory for the terms of trade."

==========

AUD/USD M1: range price movement by RBA Monetary Policy Statement news event 


==========

Chart was made on MT5 with Brainwashing system/AscTrend system (MT5) from this thread (free to download) together with following indicators:

Same system for MT4:

  1. Brainwashing. Trades: manually and using EAs (MT4)
  2. Brainwashing EAs - the thread (MT4)
  3. Brainwashing: system setup for trading manually and for EAs (MT4) - the thread 
  4. Brainwashing: system development (MT4) - the thread
Statement on Monetary Policy – November 2017 | RBA
  • www.rba.gov.au
The Statement on Monetary Policy sets out the Bank's assessment of current economic conditions, both domestic and international, along with the outlook for Australian inflation and output growth. A number of boxes on topics of special interest are also published. The Statement is issued four times a year.
 

GBP/USD - daily bearish ranging near Senkou Span reversal level (based on the article)

The price on the daily chart is on ranging below Ichimoku cloud: price is within the following support/resistance levels:

  • 1.3027 support level located in the beginning of the bearish trend to be resumed, and
  • 1.3213 resistance level located near Senkou Span line on the border of the primary bullish reversal to be started.

By the way, 1.3027 is the weekly support level, and if the price breaks this level to below on close weekly bar so the long-term bearish reversal will be started with the secondary ranging way.


  • "GBPUSD: Retail trader data shows 58.6% of traders are net-long with the ratio of traders long to short at 1.42 to 1. In fact, traders have remained net-long since Nov 01 when GBPUSD traded near 1.30522; price has moved 0.7% higher since then. The number of traders net-long is 4.5% lower than yesterday and 21.2% lower from last week, while the number of traders net-short is 10.5% lower than yesterday and 1.9% higher from last week. "
  • "We typically take a contrarian view to crowd sentiment, and the fact traders are net-long suggests GBPUSD prices may continue to fall. Positioning is more net-long than yesterday but less net-long from last week. The combination of current sentiment and recent changes gives us a further mixed GBPUSD trading bias."

==========

The chart was made on D1 timeframe with Ichimoku market condition setup (MT5) from this post (free to download for indicators and template) as well as the following indicators from CodeBase:

DailyFX Home
DailyFX Home
  • www.dailyfx.com
GBPUSD: Retail trader data shows 58.6% of traders are net-long with the ratio of traders long to short at 1.42 to 1. In fact, traders have remained net-long since Nov 01 when GBPUSD traded near 1.30522; price has moved 0.7% higher since then. The number of traders net-long is 4.5% lower than yesterday and 21.2% lower from last week, while the...
 

Weekly Outlook: 2017, November 12 - November 19 (based on the article)

The US dollar was somewhat on the backfoot in a relatively slow week. Will it continue sliding? The upcoming week features the all-important inflation and retail sales figures from the US as well as housing data and more. Here are the highlights for the upcoming week.


    1. FOMC’s Harker talks: Monday, 00:10. Philly Fed President Patrick Harker will speak early in the week and can have an outsized impact due to low liquidity.
    2. German GDP: Tuesday, 7:00. A revised figure for the all-European number will be influenced by this publication.
    3. UK inflation: Tuesday, 9:30. 3.1% is forecast now.
    4. Yellen, Draghi, Carney, and Draghi speak Tuesday, 10:00. The governors of the US FED, the ECB, the BOE and the BOJ will all speak at a panel at the ECB’s conference in Frankfurt. The topic is communication, which has been an important part of central banks’ policies. Any comments about these all-important CBs policies could impact the USD, EUR, GBP, and the BOJ. Draghi will also speak on Friday at 8:30, but the panel with his peers on Tuesday is more important.
    5. US PPI: Tuesday, 13:30. Headline PPI is expected to rise by 0.1% and core PPI by 0.2%.
    6. Japanese GDP: Tuesday, 23:50. A slower growth rate of 0.4% is projected now.
    7. US CPI: Wednesday, 13:30. Headline CPI is expected to rise by 0.1% m/m and core CPI by 0.2% m/m.
    8. US retail sales: Wednesday, 13:30.
    9. Australian jobs report: Thursday, 00:30. An increase of 18.9K is estimated and the unemployment rate is forecast to remain unchanged at 5.5%.
    10. FOMC’s Brainard talks: Thursday, 14:30. Lael Brainard is a permanent voter at the FOMC. She does not make many public appearances and her opinions certainly matter. Her speech at Ann Arbor could provide hints about future monetary policy.
    11. US housing data: Friday, 13:30. Small rises are likely now: building permits to 1.25 million and housing starts to 1.19 million.
     

    Weekly EUR/USD Outlook: 2017, November 12 - November 19 (based on the article)

    EUR/USD managed to tick up amid OK data from Europe and weakness in the US dollar. GDP data stands out in a busier week. Here is an outlook for the highlights of this week.


    1. German GDP (preliminary): Tuesday, 7:00. The so-called “locomotive” of the euro-zone has enjoyed a growth rate of 0.6% q/q in the second quarter of 2017. Q3 should be similar.
    2. German CPI (final): Tuesday, 7:00. The final read will likely confirm this number.
    3. German WPI: Tuesday, 7:00. Prices at the wholesale level eventually reach the consumers.
    4. Italian GDP (preliminary): Tuesday, 9:00. The number for Q3 could be better.
    5. Flash GDP: Tuesday, 10:00.
    6. German ZEW Economic Sentiment: Tuesday, 10:00. The all-European number stood at 26.7 points.
    7. Industrial Production: Tuesday, 10:00. A drop is on the cards now.
    8. French Final CPI: Wednesday, 7:45. The data will probably be confirmed now.
    9. Trade Balance: Wednesday, 10:00. A rise to 21.6 billion was recorded in August and a similar figure is probable now.
    10. CPI (final): Thursday, 10:00.
    11. Current Account: Friday, 9:00. The 19-country currency bloc had a wide surplus of 33.3 billion euros in August, reflecting a widening surplus. Similar to the narrower trade balance publication, Germany’s contribution is crucial.
    Reason: