One Order Block Was Never Enough: A Before/After Look at Adding Confirmation

This is the fourth post in the order block series. The last one was a checklist for auditing any zone indicator, including ours, and it ended with an exercise: pick a chart, fix your rules in advance, and tally what actually happens after every zone touch for two weeks. This post is about the pattern that shows up in that tally once you have one — and about the single change that did the most to clean it up. It is a before-and-after story, and I will be specific about what the "after" costs, because it is not free.
The tally that does not add up
Run the two-week exercise and something uncomfortable appears. Two zones, built by the same rule, both fresh, both respectable-looking. Price returns to the first one, reacts within a few bars, and leaves. Price returns to the second one and goes through it like it was never there. Zone quality does not explain the split. The construction rule was identical. The freshness state was identical. Whatever separated those two outcomes was not in the zone.
That is the core problem with trading order blocks on their own, and it took me an embarrassingly long tally to phrase it plainly: a zone answers where price is likely to react. It says nothing about whether the rest of the chart agrees that a reaction makes sense right now. The zone was never broken. It was just alone.
Before: what naked zone trading actually looks like
The routine is familiar. Mark the zone, set the touch alert, wait. Price comes back, you enter off the zone with a stop behind the far edge. Sometimes it is clean. When it is not, the failures are not random — over enough touches they cluster into three repeatable shapes.
First, the context steamroll. An M15 demand zone sitting inside an H4 markdown leg. The zone is real — someone did absorb the selling there — but the higher timeframe is actively selling through it. You are catching a local footprint in the path of a larger flow, and the larger flow usually wins.
Second, the hot touch. Price does not drift into the zone, it accelerates into it, momentum still expanding at contact. First touch pierces, the stop behind the edge goes, and the actual reaction — if it comes — comes from deeper, after you are out. The zone "worked" in hindsight. Your entry did not, because the approach was wrong, not the location.
Third, the dead-hours tap. The same level behaves differently when it is touched during a quiet session with thin participation than when it is hit while a major session is active. A zone that gets tested when nobody is trading tells you very little, and taking every touch as equal treats it as if it told you everything.
Notice what these three have in common: none of them are visible in the zone itself. You cannot fix any of them by drawing better zones. They are all failures of agreement — trend, momentum, timing — and the zone was never designed to carry that information.
The manual fix, and why it decays
The obvious repair is a pre-entry checklist. Before taking a touch, answer five questions. Is the higher timeframe trending with this zone or against it? Is momentum decelerating into the level, or still expanding? Is the zone aligned with the most recent structure break, or fighting it? Is an active session in play? Has the level already survived a test, or is this first contact? Two extra charts open, roughly ninety seconds per touch.
I want to be honest about what happens to that checklist in practice, because this is the part nobody writes down. Week one, you run all five questions on every touch. Week two, you run three of them and eyeball the rest. Week three, a clean-looking zone gets touched while you are busy and you take it on pattern memory alone — which is exactly the undisciplined trade the checklist existed to prevent. The checklist does not fail because it is wrong. It fails because it relies on a human running it manually at the precise moments — fast markets, stacked alerts — when humans are worst at running checklists.
After: what enforced agreement changes
The "after" condition is simple to state: no touch gets taken unless several independent reads agree with it, checked at the same bar, every bar, with no exceptions granted for zones that look pretty. Two things change immediately, and only one of them is comfortable.
The uncomfortable one first: the trade count drops, and it drops a lot. Most touches do not arrive with broad agreement behind them. Some of the touches you skip would have worked anyway — price does not owe the framework anything, and a zone can hold with momentum against it and the session dead. Enforced agreement means watching a few of those leave without you. Anyone who tells you a confirmation filter costs nothing is describing a filter that filters nothing.
What you buy with that cost is specific: the three failure shapes above largely stop appearing in the tally. That is not a coincidence and it is not a win-rate promise — those shapes are disagreement, by definition. The context steamroll is a higher-timeframe veto. The hot touch is a momentum veto. The dead-hours tap is a session veto. Demand agreement and you have not made your winners bigger; you have thinned out a repeatable class of losers. The distribution changes shape at the ugly end. That is the entire claim, and you can verify it on your own chart the same way as before: two weeks naked, two weeks with agreement enforced, same fixed rules, count everything.
Doing it with software instead of willpower
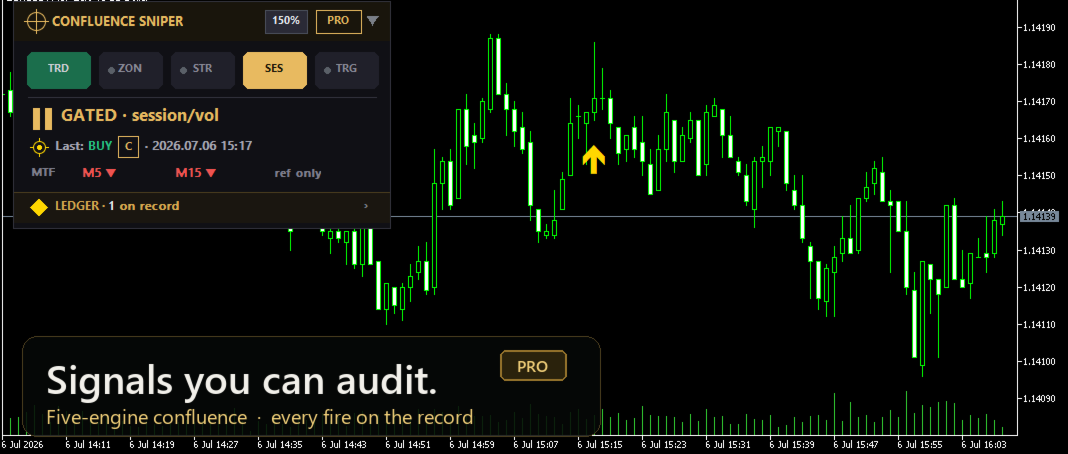
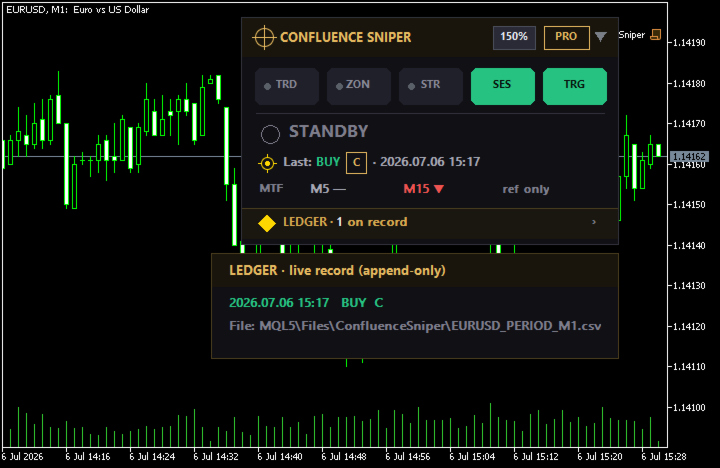
What I actually wanted was that checklist run on every closed bar without me opening two extra charts and interrogating myself at one in the morning. That is the job Confluence Sniper was built to do: five independent engines — trend consensus, zone context, currency strength, session and volatility, and a price-action trigger — read the chart, and an arrow prints only when enough of them agree on the same closed bar. The agreement threshold is yours to set — demand more votes and it prints rarely, relax it and it speaks up more often. The free version runs all five engines.
Because this series has already spent so much ink on repainting, one more word about receipts. Every live signal is written to a local CSV ledger the moment its bar closes, and the arrows you see on history are replayed from that file, never recomputed — the model's guess about older bars it never saw live is drawn as a separate hollow arrow so the two cannot be confused. When you run your own before-and-after tally, the "after" column is coming out of a record the indicator itself never goes back and rewrites, which is the only way a comparison like this means anything.
And if zones are your starting point — they were mine — the two tools divide the work naturally. Order Block Zones answers where the footprint is. The agreement engine answers whether the rest of the tape backs that footprint at the moment it is touched. Where over there, whether over here.
The arc, and your homework
The series so far: find the zone, judge the zone, audit the tool that draws it. This post adds the step that took me the longest to accept — one order block, however clean, was never enough on its own. If you have already run the two-week tally from the checklist post, extend it: same chart, same rules, but require agreement before you count a touch as takeable, and compare the two columns yourself.
If your tally disagrees with mine — if enforced confirmation is not thinning out the steamrolls and hot touches on your feed — that is exactly the kind of comment I want on the product page. I read every one.




