

Welcome to ENTRY IN THE ZONE AND SMC MULTI TIMEFRAME
Official Website : Explore More Tools & Indicators : https://www.fableedge.net
YouTube Channel : 24/7 LIVE SIGNALS : https://www.youtube.com/@FableEdgeView
Table of Contents
1️⃣What is Smart Money Concepts (SMC)?
2️⃣ Why Choose Entry In The Zone & SMC Multi Timeframe?
3️⃣ Key Features
4️⃣ Dashboard Overview
5️⃣ Single Timeframe vs Multi Timeframe Analysis
6️⃣ Real-Time Alerts & Mobile Push Notifications
7️⃣ User Interface & Chart Customization
8️⃣ Swing Zig Zag Settings
9️⃣ What is the difference between the Indicator Version and the Utility Version (Risk Per Trade)
🔟 Risk Per Trade Calculator Feature (Utility Version Only)
1️⃣1️⃣ Trading Workflow Using Smart Money Concepts
1️⃣2️⃣The FABLE Pro Suite User Guide & Current Tool Version Check
1️⃣3️⃣ Step-by-Step Guide to Purchasing, Installing, and Updating
📌 The FABLE Pro Suite — Free Supporting Indicators Provided for Customers — Available for download here. 🎁
- Adaptive_Rsi_Filter
- Fable_Bar_Count_Down
- Multi Trendlines – Breakout Signal Alerts
- Price_Action_Radar
- Smart_Strength
- Volume_Profile
- Adapt_Nadaraya_MTF
I recommend using Smart Strength, Adaptive RSI Filter, Volume Profile, and Multi Trendlines – Breakout Signal. As for the other tools, you can choose whichever ones you would like to use.
1️⃣What is Smart Money Concepts (SMC)?
Smart Money Concepts (SMC) is a price action analysis approach focused on understanding how large market participants, or institutional traders, drive the market.
Rather than relying solely on traditional technical indicators, SMC analyzes the market through Market Structure, Liquidity, and key Points of Interest to identify high-probability trading opportunities.
The core components of Smart Money Concepts include:
-
Market Structure (BOS and CHoCH)
-
Liquidity
-
Order Blocks
-
Supply & Demand Zones
-
Fair Value Gaps (FVG)
-
Premium & Discount Zones
These concepts help traders understand not just where price is moving, but also why it is moving that way.
Instead of chasing every price swing, SMC allows traders to see the overall market structure, identify areas where Smart Money is likely to buy or sell, and capture high-probability trading opportunities based on price action.
However, applying Smart Money Concepts manually — analyzing and drawing every component by hand — can be quite time-consuming. Traders need to continuously identify Market Structure, mark Order Blocks, locate Liquidity, and switch between multiple timeframes to make informed trading decisions.
This is exactly why Entry In The Zone & SMC Multi Timeframe was developed — to simplify and streamline this entire analysis process.
2️⃣ Why Choose Entry In The Zone & SMC Multi Timeframe?
We designed the indicator to be easy to use, simple, and well-structured, helping users learn SMC faster, reduce the steps required for market analysis, and use it conveniently over the long term.
The system can automatically detect and display:
-
SMC Market Structure (BOS, CHoCH, mBOS, and mCHoCH)
-
Major Trend and Minor Trend
-
Swing High and Swing Low
-
HH, HL, LH, and LL
-
Order Blocks (OB) / Volumized Order Block : https://docs.google.com/document/d/1n9G_8MucTQmBrq8tKbhZT9hTyJ9UX9dO9cW-izLYdzo
-
Supply & Demand Zones
-
Fair Value Gaps (FVG)
-
Liquidity and Liquidity Sweep (LQS)
-
Equal High and Equal Low
-
PDH and PDL
-
PWH and PWL
-
Premium & Discount Zones
-
Auto Fibonacci : https://docs.google.com/document/d/1MypF87AEbqv0Z1SL60MCQ5YmM6dwokkeRzseQIAELP0
-
Trading Sessions
3️⃣ Key Features of Entry In The Zone & SMC Multi Timeframe
📍Market Structure Comes First
Market Structure is the foundation of Smart Money Concepts (SMC). If the market structure is misidentified, the interpretation of other SMC components such as BOS, CHoCH, Liquidity, Order Blocks, and Supply & Demand can also become misleading.
Do not evaluate the quality of an indicator solely by the number of features or the visual appearance of the chart. Instead, consider whether the entire analysis is built upon a consistent and well-defined market structure.
When the foundation is correct, the entire analysis becomes more reliable and helps traders make more logical and systematic trading decisions.
Key Features
Smart Money Concepts (SMC) Market Structure
The system automatically detects market structure based on Smart Money Concepts (SMC) principles (BOS, CHoCH, mBOS, and mCHoCH), while clearly identifying the Major Trend and Minor Trend. It also automatically detects Swing Highs and Swing Lows, along with Market Structure Labels such as (HH, HL, LH, and LL.)
The system supports both Single Timeframe Analysis and Multi Timeframe Analysis, providing a clearer overall view of market conditions.
Key Price Zones (Points of Interest)
The system automatically detects high-probability Points of Interest (POI), including:
-
Order Blocks
-
Supply & Demand Zones
-
Fair Value Gaps (FVGs)
All zones are plotted automatically in real time, based on Smart Money Concepts (SMC) principles.
All Essential Market Data in One Tool
To support comprehensive and efficient market analysis, the system consolidates all essential market data into a single indicator, including:
-
Liquidity
-
Equal Highs & Equal Lows
-
Previous Day High / Low (PDH / PDL)
-
Previous Week High / Low (PWH / PWL)
-
Premium & Discount Zones
-
Auto Fibonacci
-
Trading Sessions
In addition, the system automatically detects Liquidity Sweeps (LQS), Equal Highs / Equal Lows, Previous Day High / Previous Day Low (PDH / PDL), Previous Week High / Previous Week Low (PWH / PWL), Swing Highs, and Swing Lows — providing a more complete and accurate picture of market structure.
Real-Time Signal & Alert System — No Repaint
The built-in signal engine generates BUY and SELL signals in real time, strictly following a No-Repaint policy. The system is designed to help reduce false signals, minimize trading risk, and improve the overall quality of trading opportunities.
Signals are only displayed once all defined conditions have been fully confirmed.
The system also sends alerts whenever a significant market event occurs, including:
-
BUY / SELL signals
-
Reversal signals within trading zones
-
Break of Structure (BOS) / Change of Character (CHoCH)
All alerts can be sent directly to your mobile phone via Push Notifications, ensuring you never miss an important market event.
Designed for Traders of Every Level
Financial markets are constantly changing, so your trading tools need to adapt as well.
This indicator continuously updates all its calculations using live market data, making it suitable for a wide range of trading styles, including:
-
Scalping
-
Intraday Trading
-
Swing Trading
Whether you're just starting to learn Smart Money Concepts or you're an experienced trader, this indicator is designed to simplify market analysis while still allowing you to customize it to fit your own trading style.
Beginners can more easily learn market structure and the core components of Smart Money Concepts, without spending months practicing how to draw every element manually.
Experienced traders can save analysis time by letting the indicator automatically detect Market Structure and Points of Interest, allowing them to focus fully on planning entries, exits, and risk management.
4️⃣ Dashboard Overview
Customizable Chart Display
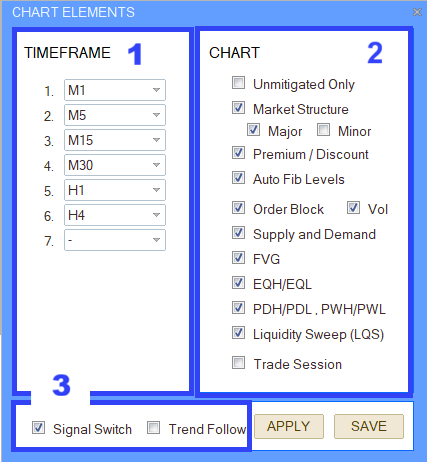
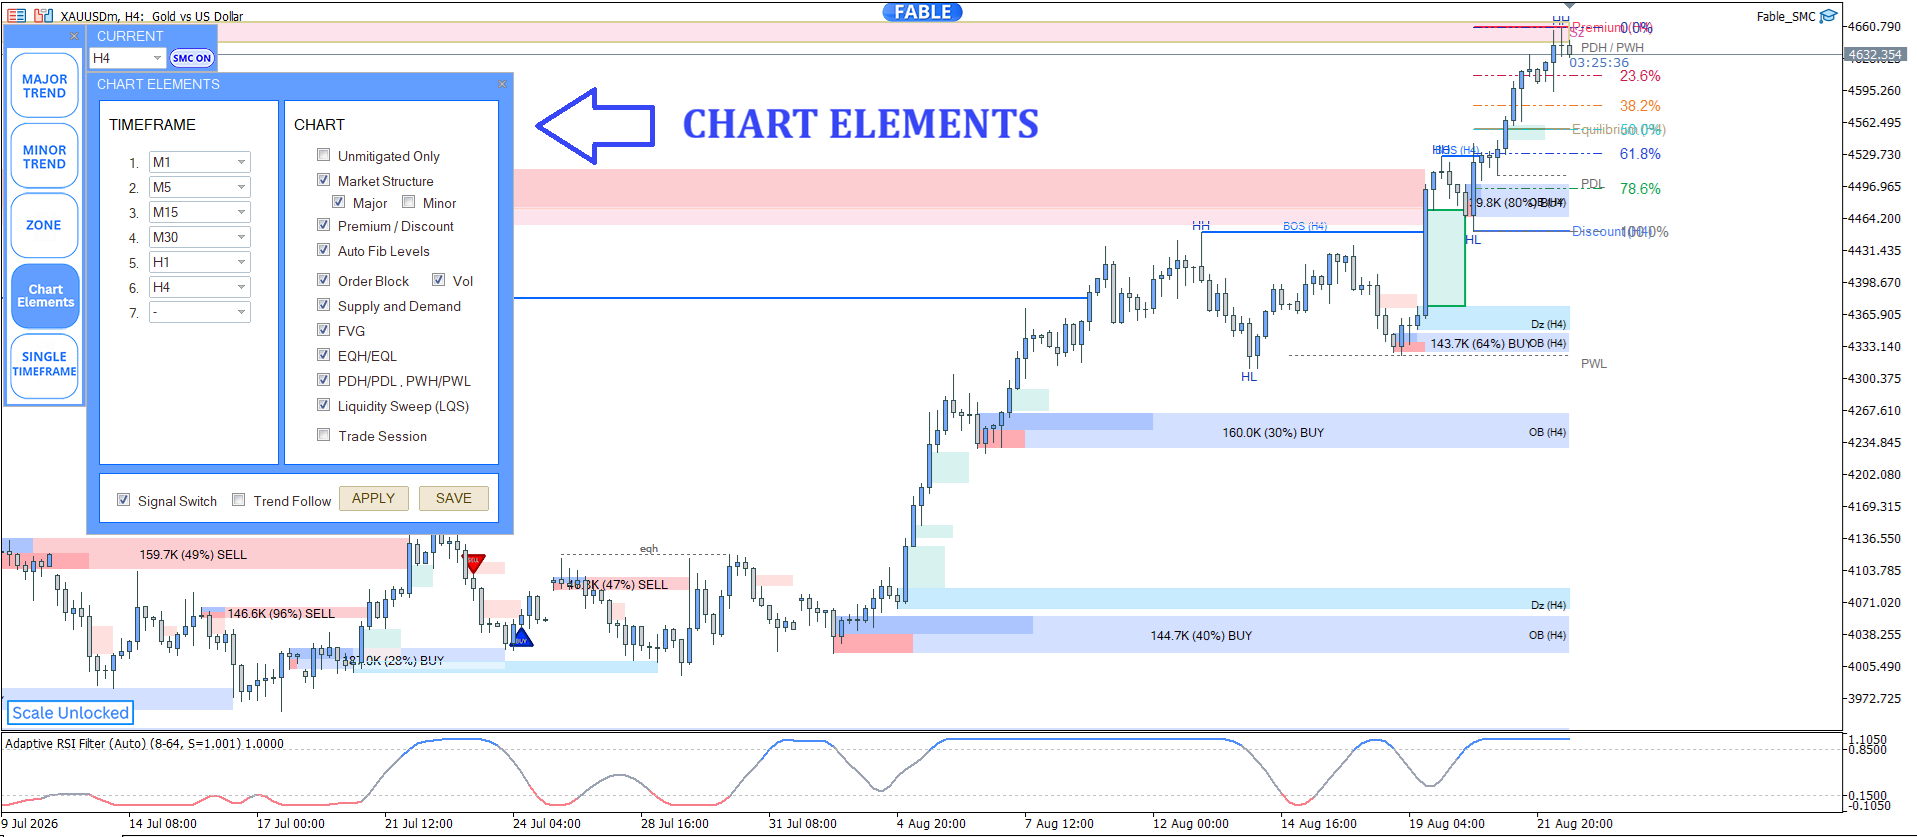
Every trader has a different workflow and chart layout preference. Entry In The Zone and SMC Multi Timeframe lets you turn each chart feature on or off as needed.
Available display options include:
1. Time Frame
-
Selected Timeframe Dashboard
2. Chart
-
SMC Market Structure (Major Trend) / (Minor Trend)
-
Premium & Discount Zones
-
Auto Fibonacci
-
Order Blocks (OB) / Volumized Order Blocks (VOB)
-
Supply & Demand Zones
-
Fair Value Gaps (FVG)
-
Equal Highs & Equal Lows
-
Previous Day & Previous Week Levels
-
Liquidity Sweeps (LQS)
-
Trading Sessions
3. Signal Switch / Trend Following
-
BUY / SELL Signals
This flexibility keeps your chart clean, organized, and focused only on the information that matters most.
1. Time Frame
Select the timeframes you want displayed on the dashboard and receive real-time alerts whenever price reaches a key zone.
You only need to set up your preferred timeframes on the dashboard once.
2. Chart Settings
You can turn each chart element on or off to match your trading style, based on the following options:
2.1 Unmitigated (Unused Zones)
- Enabled: Displays only zones that have not been used (Unmitigated Zones).
- Disabled: Displays all zones, both mitigated and unmitigated.
2.2 Smart Money Concepts (SMC) Market Structure
Enable or disable the display of SMC Market Structure.
-
Major: Displays only the Major Trend market structure (primary trend).
- Minor: Displays only the Minor Trend market structure (short-term trend within the Major Trend).
2.3 Premium / Discount
Enable or disable the display of Premium and Discount zones.
Using Premium / Discount in Trading Decisions
-
Uptrend: Look for buying opportunities in the Discount Zone.
-
Downtrend: Look for selling opportunities in the Premium Zone.
2.4 Auto Fib Levels
Enable or disable the display of automatic Fibonacci Levels.
Fibonacci automatically calculates from the latest market structure and updates its levels in real time whenever a new market structure is confirmed (BOS or CHoCH) to remain aligned with the current market conditions.
2.5 Order Blocks (OB) / Volumized Order Blocks (VOB)
Enable or disable the display of Order Blocks.
📌Note: Previously mitigated Order Blocks may remain visible, as they can later function as Breaker Blocks (BB). Keeping these zones on the chart helps identify potential support, resistance, and price reversal areas.
📌Note: The latest zone may briefly flash as the system continuously recalculates to ensure the most accurate and valid zone based on its conditions.
2.6 Supply and Demand (Sz / Dz)
Enable or disable the display of Supply and Demand Zones.
2.7 FVG (Fair Value Gap)
Enable or disable the display of Fair Value Gaps.
2.8 EQH / EQL (Equal Highs / Lows)
Enable or disable the display of Equal Highs and Equal Lows.
Equal Highs / Equal Lows : Price levels where the market has repeatedly reacted, commonly serving as areas where retail traders place their stop-loss orders.
2.9 PDH / PDL / PWH / PWL
Enable or disable the display of Previous Day High/Low and Previous Week High/Low levels.
PDH / PDL (Previous Day High/Low)
The previous day's high and low, often targeted by Smart Money to trigger stop hunts and mislead retail traders.
PWH / PWL (Previous Week High/Low)
The previous week's high and low, key zones where large clusters of stop-loss orders are often found, making them primary targets for liquidity sweeps by institutional traders.
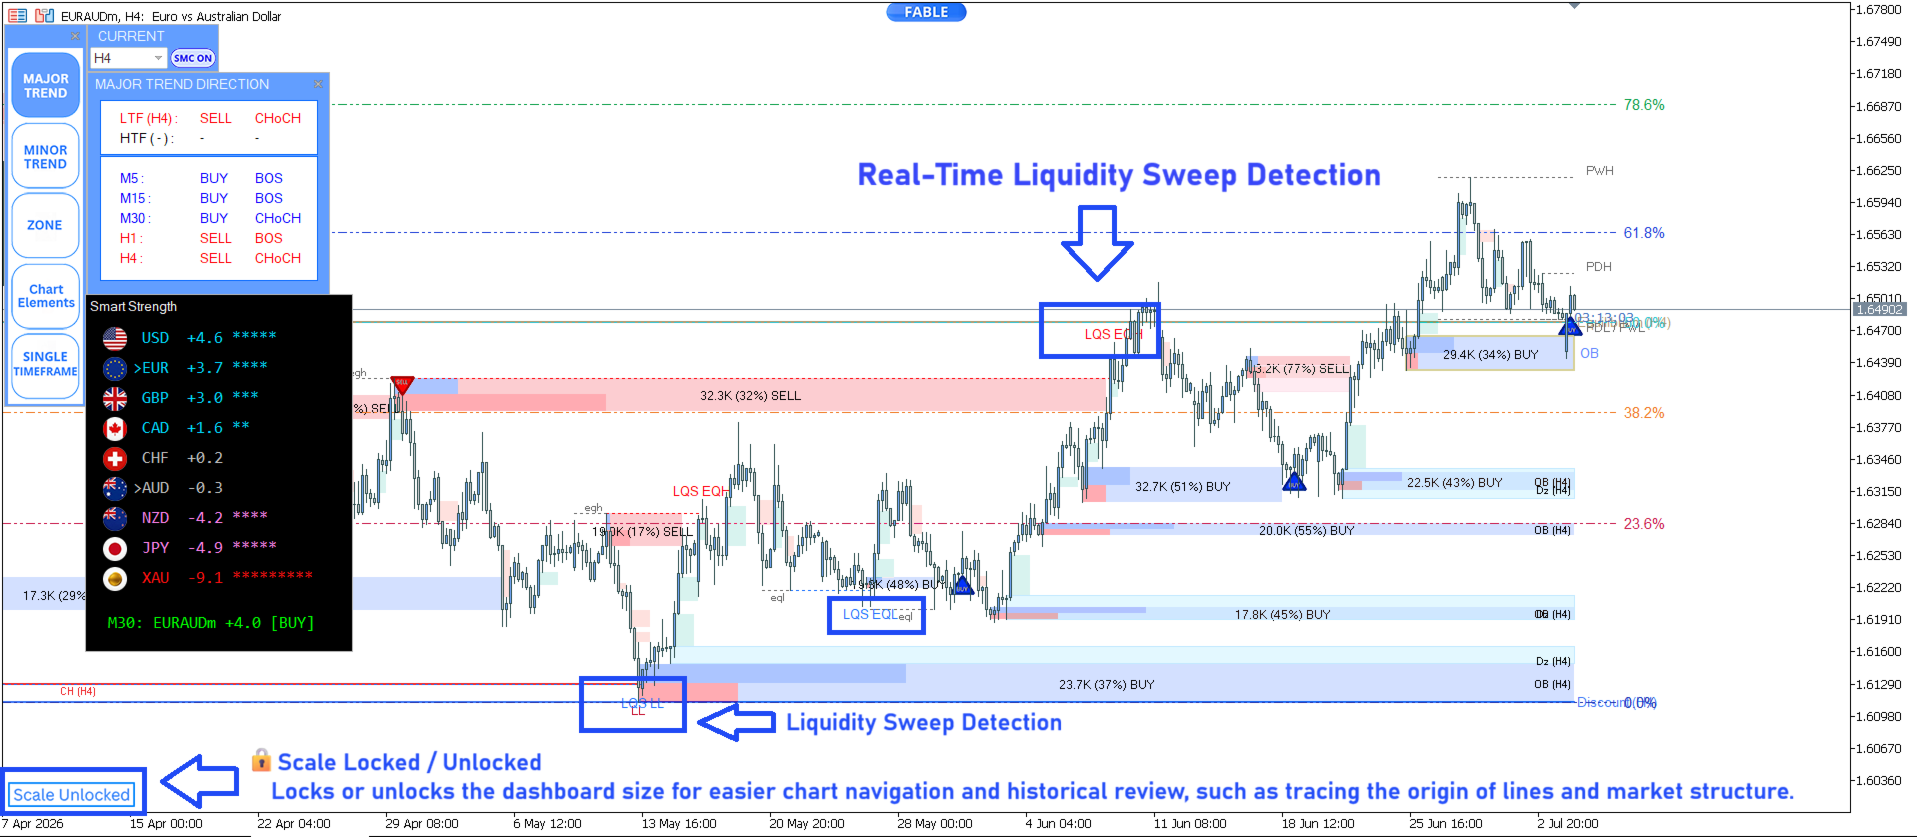
2.10 Liquidity Sweep (LQS)
Enable or disable the display of Liquidity Sweeps and related liquidity levels.
Automatically detects Liquidity Sweeps, Equal Highs/Lows, Previous Day High/Low (PDH/PDL), Previous Week High/Low (PWH/PWL), Swing Highs, and Swing Lows, displaying them on the chart in real time to support market structure analysis based on Smart Money concepts.
-
Liquidity Sweeps: Price movements that sweep above/below key levels to grab liquidity before reversing.
-
Equal Highs / Equal Lows: Price levels where the market has repeatedly reacted and where stop losses are commonly placed.
-
PDH / PDL (Previous Day High/Low): The previous day's high and low, often targeted by Smart Money for stop hunts.
-
PWH / PWL (Previous Week High/Low): The previous week's high and low, key zones with large clusters of stop-loss orders.
-
Swing Highs / Swing Lows: Significant highs and lows used to identify market structure and potential reversal zones.
2.11 Trading Sessions
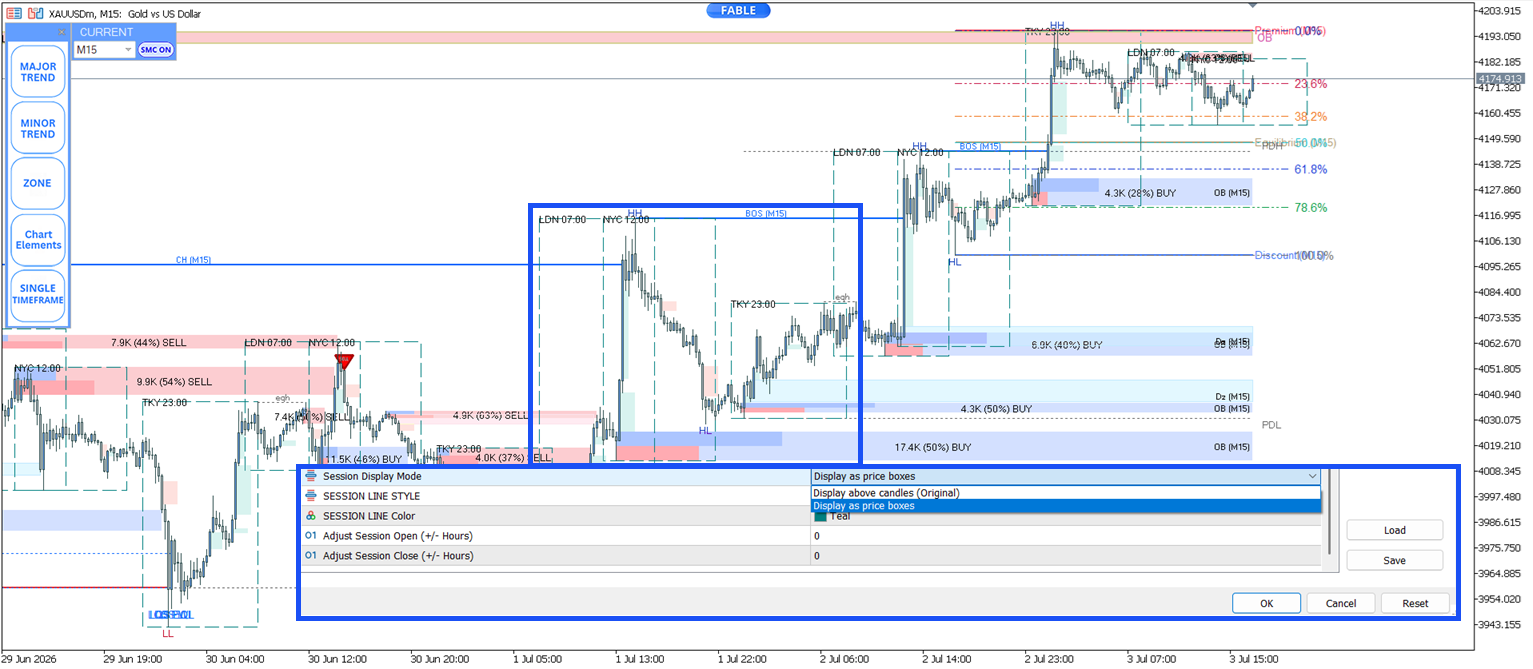
Enable or disable the display of major trading sessions (Tokyo, London, and New York).
Trading sessions are extremely important in financial market trading because they affect several key factors that traders must consider, including liquidity, volatility, economic news, and selecting the appropriate trading instruments.
Trading Sessions can be displayed in two different modes: Above Candles or Price Boxes.
- Above Candles
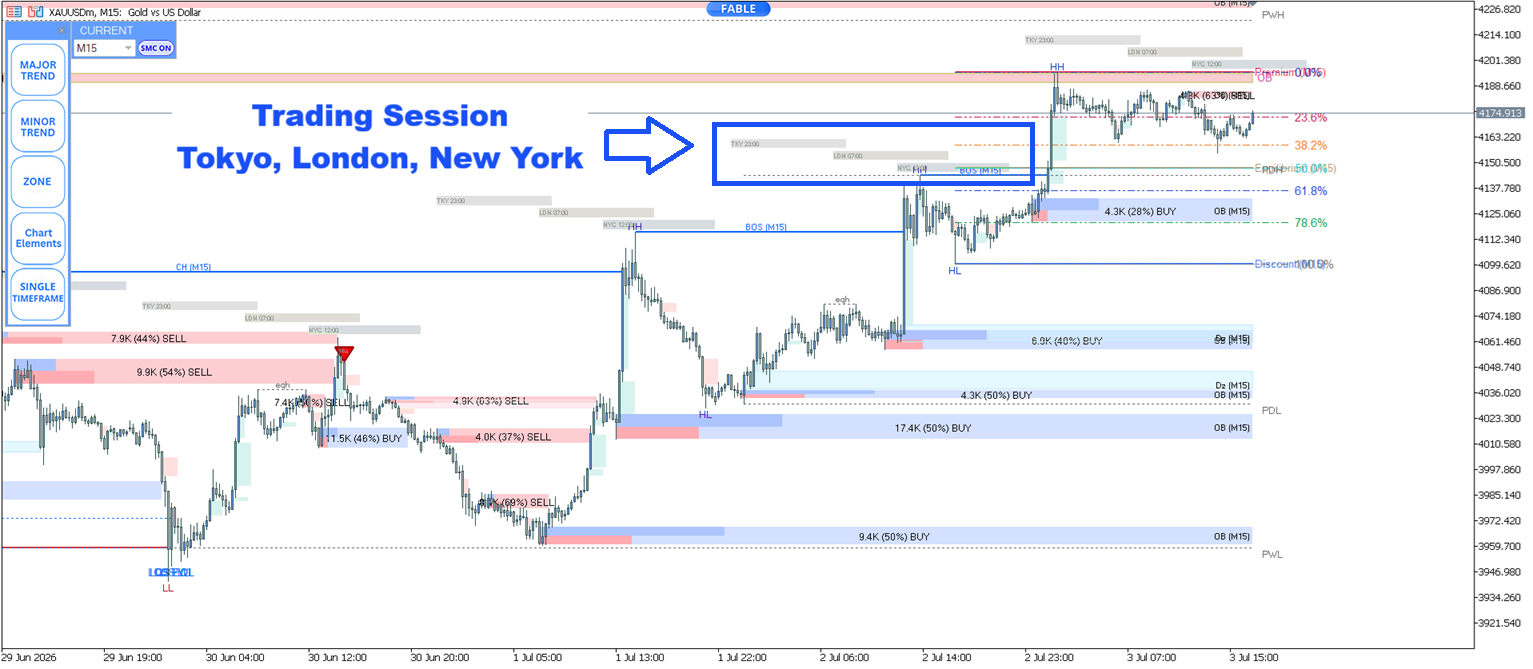
- Price Boxes.
3. Signal Switch
Enable or disable the display of trade signals.
3.1 Trend Follow
Trend Follow → Controls the signal filtering function based on the market trend direction, referencing the SMC system structure.Dashboard Overview
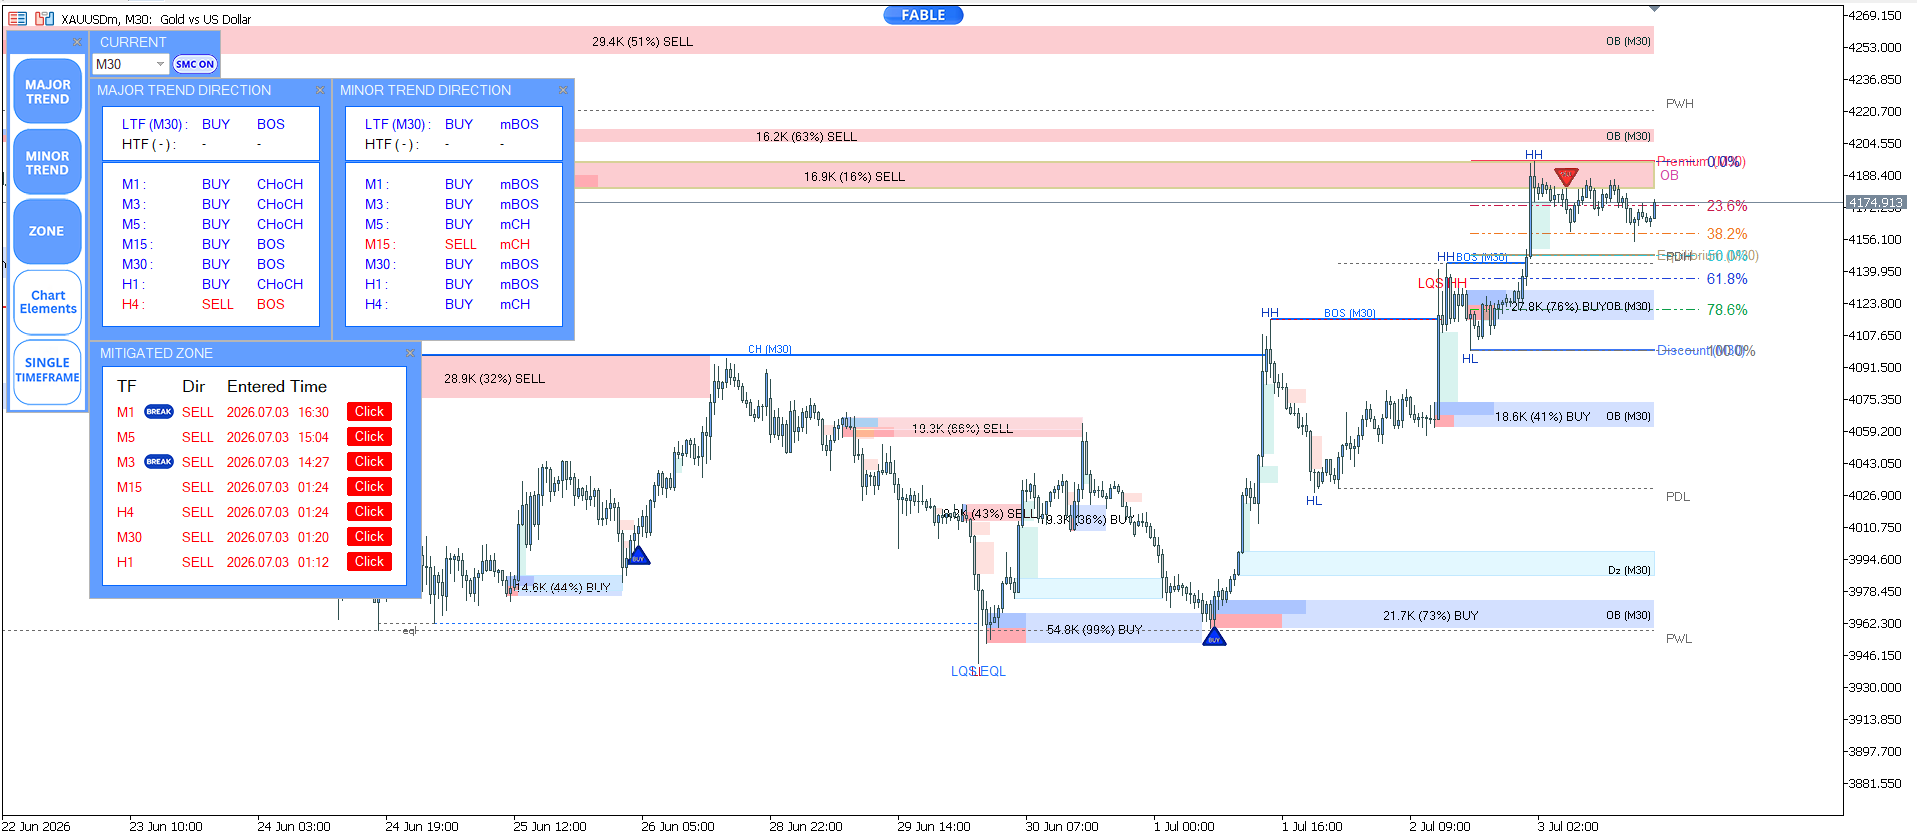
Why the Dashboard Matters
One of the biggest challenges retail traders face is information overload across multiple timeframes. Constantly switching between charts makes it difficult to see the overall market picture, causing traders to miss trading opportunities or enter trades against the trend without realizing it.
The Dashboard Overview was designed to solve this problem by bringing the most important information together in a single window, allowing you to analyze the market more quickly and efficiently.
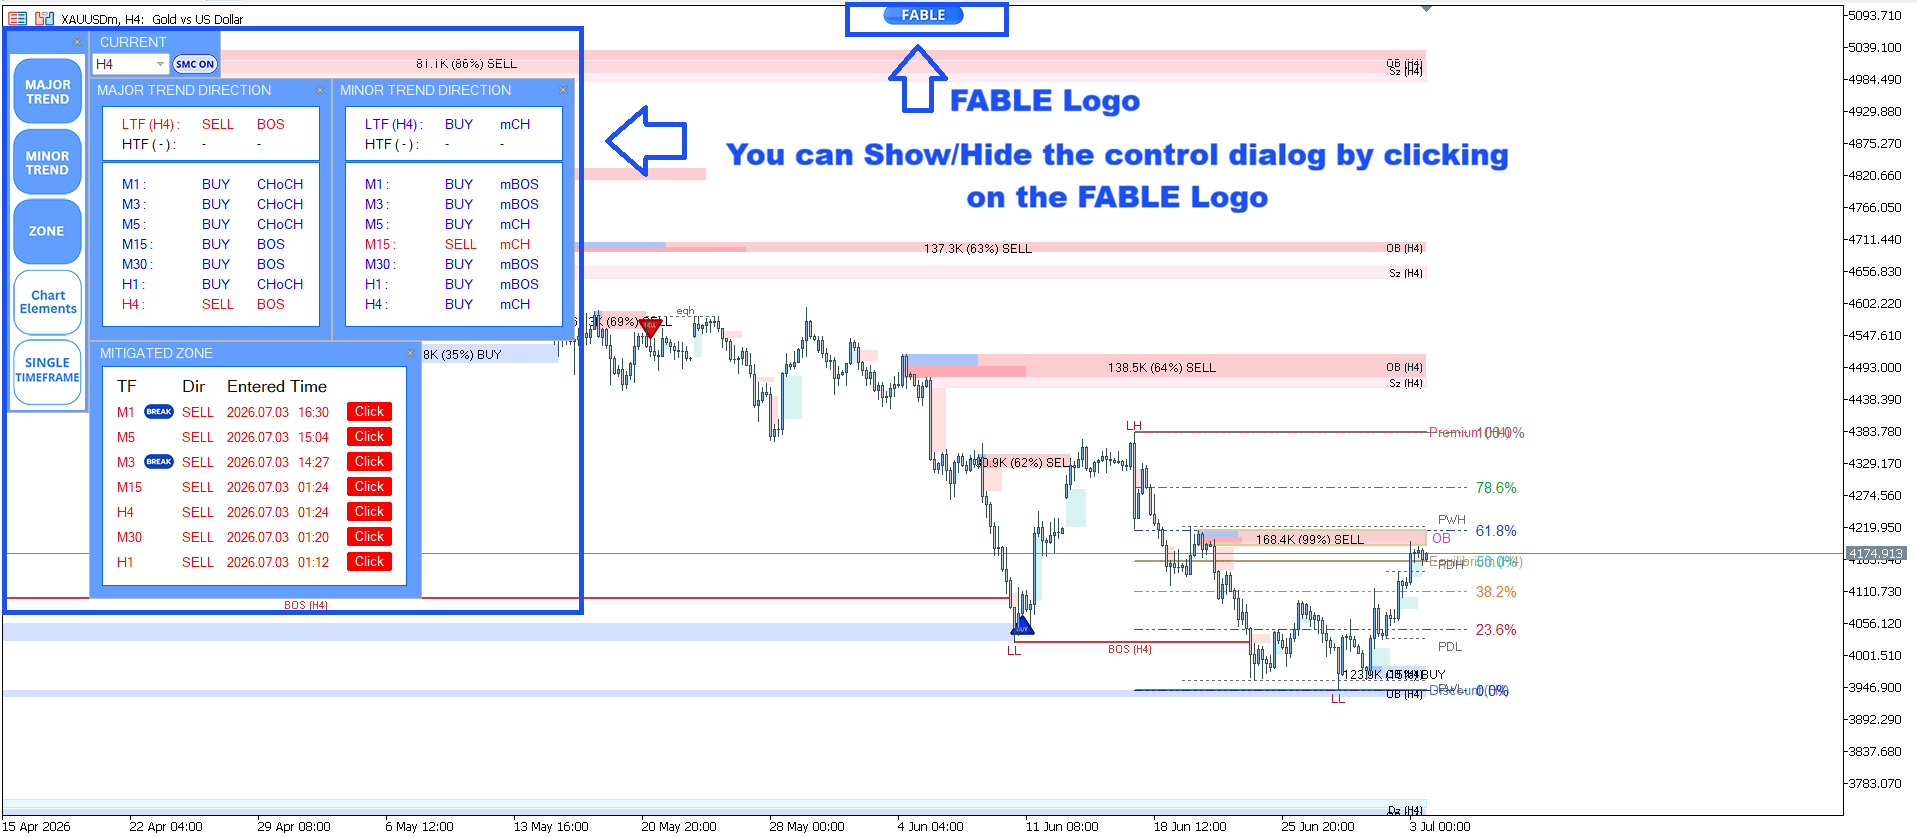
The dashboard consists of three main sections:
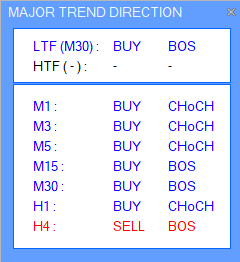
Major Trend Direction
This window displays the Major Trend direction across all selected Timeframes, allowing you to quickly evaluate the overall market trend in each timeframe.
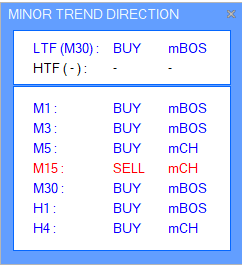
Minor Trend Direction
This window displays the Minor Trend, or short-term trend, across all selected Timeframes, allowing you to quickly monitor short-term trend changes in each timeframe.
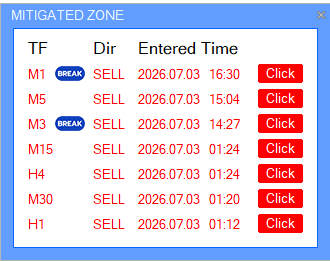
Mitigated Zone
This window displays all Mitigated zones from the selected Timeframes, sorted from the most recent to the oldest. It allows you to quickly identify the most important zones and see which zones price is currently reacting to across all selected Timeframes. Press the Click button to switch between different Timeframes.
5️⃣ Single Timeframe vs Multi Timeframe Analysis
Two Powerful Analysis Modes
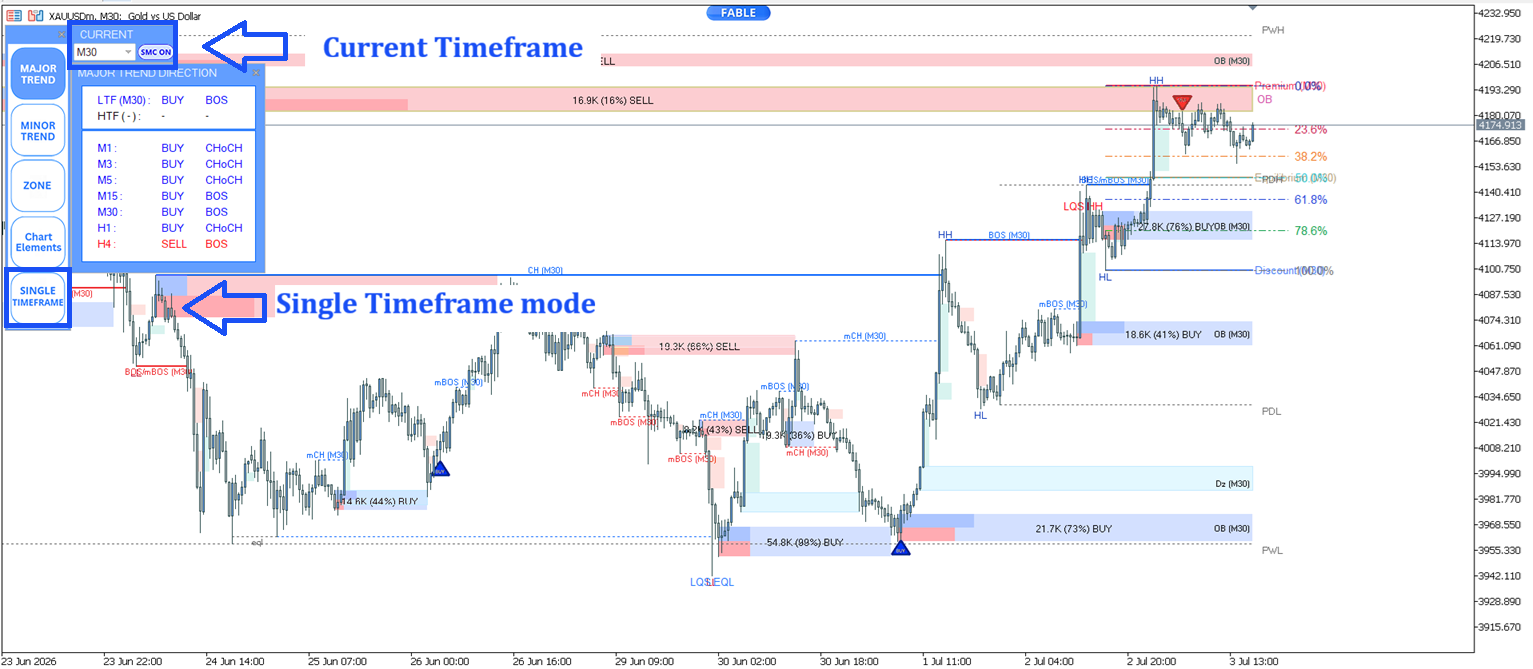
- Single Timeframe Analysis
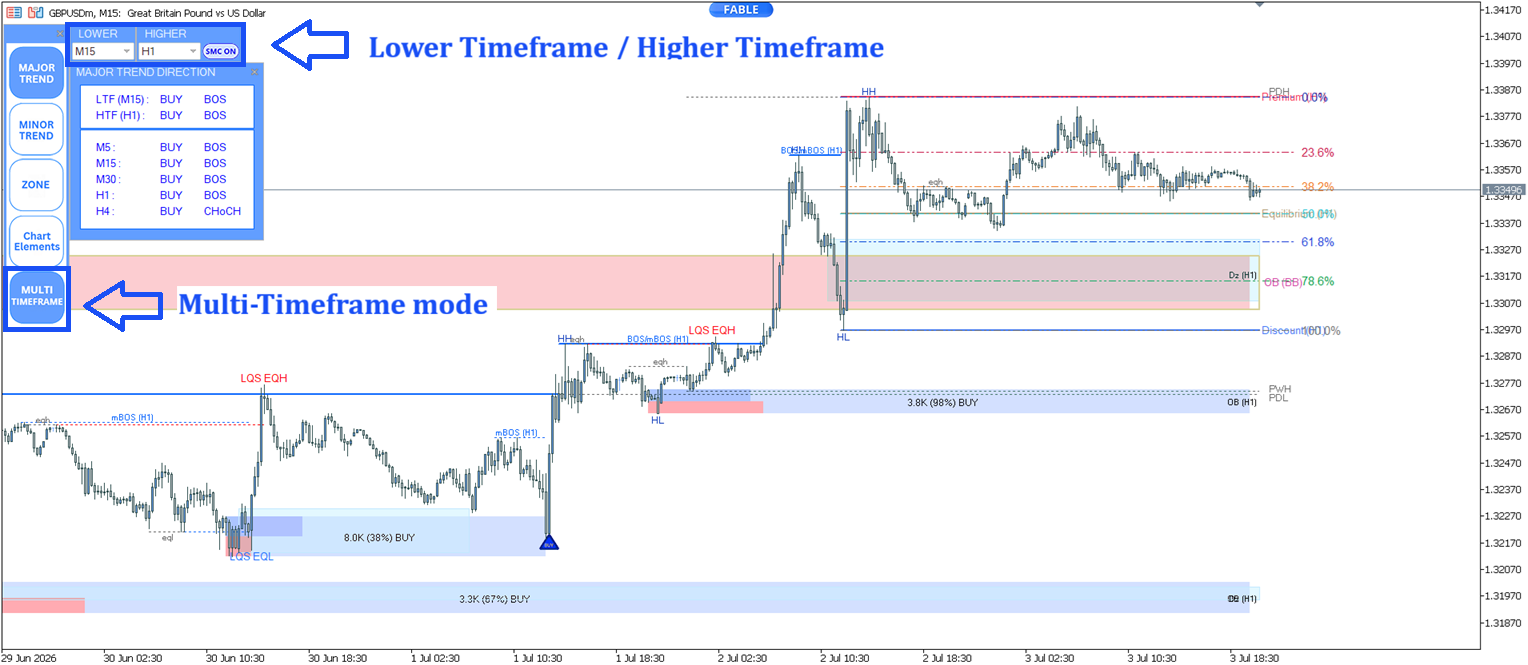
- Multi Timeframe Analysis
Single Timeframe View
Market Structure, all zones, and all trade signals are based on the current active timeframe.
This mode is ideal for traders who prefer a simple, focused trading approach centered on a single timeframe.
Multi Timeframe View
Multi-Timeframe Analysis is more than just displaying multiple timeframes on the dashboard. It performs true Higher Timeframe analysis by automatically projecting SMC Market Structure Analysis and key Smart Money Concept (SMC) zones—such as Order Blocks (OB), Supply & Demand Zones, Liquidity, and other essential SMC elements—from higher timeframes directly onto your current chart. This provides a clearer view of the overall market structure.
For example:
-
If you set H1 as the Higher Timeframe, all displayed Market Structure and zones will be based on H1.
-
If you set M15 as the Lower Timeframe, trade signals will be generated from M15.
This approach allows traders to track the major trend on a higher timeframe while using a lower timeframe to find more precise entry points — enabling tighter stop losses and improving the potential Risk-to-Reward (RR) ratio.
Single Timeframe Analysis
Single Timeframe Analysis is a method of analyzing the market using only one timeframe to observe an asset's price and trend. This means the trader considers all information — such as the major trend, entry/exit points, and trade signals — within that single timeframe only.
Analysis Steps
Choose an appropriate timeframe
Traders should select a timeframe that suits their trading style — for example, H4 or Daily for medium- to long-term trading, or M15 and M5 for short-term trading.
Analyze the trend within that timeframe
Use the selected timeframe to analyze Market Structure, identify price direction, and look for high-probability trading opportunities using Points of Interest (POI), Liquidity, Premium & Discount zones, Auto Fibonacci levels, and trade signals.
Determine entry and exit points
Decide where to enter and exit the trade, including setting Stop-Loss and Take-Profit levels, all within the same timeframe, to control risk and manage trades effectively.
Multi-Timeframe Analysis
Multi-Timeframe Analysis is a market analysis technique that combines multiple timeframes to provide a clearer view of the overall major trend while identifying more precise entry and exit points.
Analysis Steps
Analyze the major trend using a higher timeframe
For example, the 4-hour (H4) or Daily chart, to determine the market's overall direction (uptrend, downtrend, or sideways).
Find entry and exit points using a lower timeframe
For example, the 1-hour (H1) or 15-minute (M15) chart, to identify suitable trading opportunities that align with the major trend.
Confirm signals across multiple timeframes
Signals on the lower timeframe should align with the trend from the higher timeframe, increasing confidence before entering a trade.
6️⃣ Real-Time Alerts & Mobile Push Notifications
Never Miss an Important Market Event Again
The indicator supports instant alerts for:
-
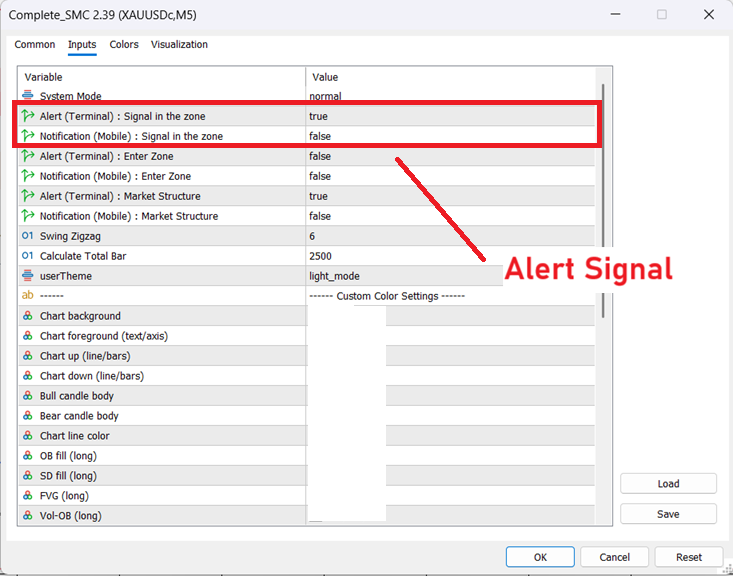
Alert Signal
-
Alert Mitigation Zone
-
Market Structure Change Alert (BOS and CHoCH)
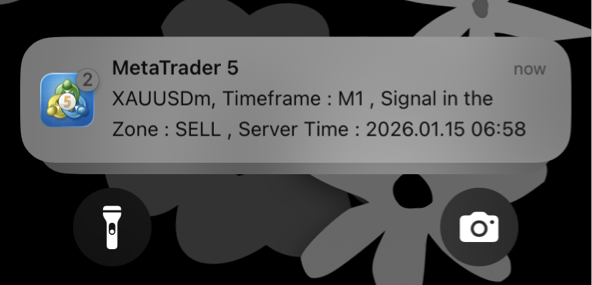
All alerts can be sent directly to both your desktop MetaTrader 5 and your mobile device via push notifications.
-
Alert Signal
-
Alert Mitigation Zone
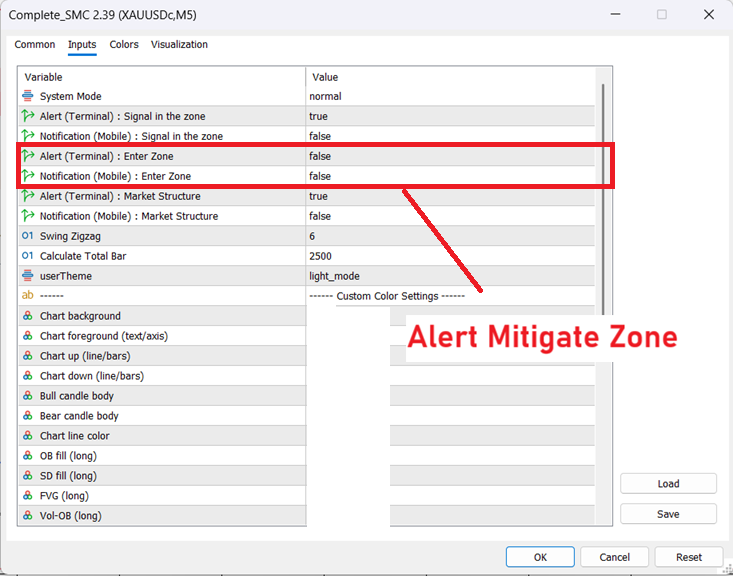
-
Market Structure Change Alert (BOS and CHoCH)
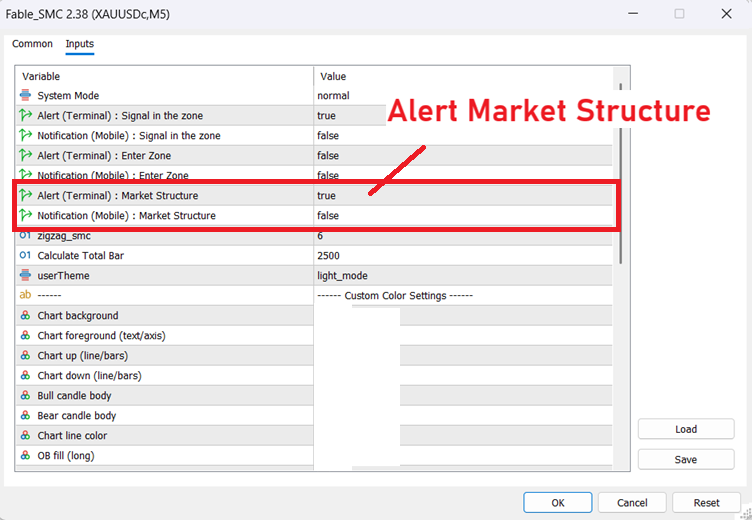
- All alerts can be sent directly to both your desktop MetaTrader 5 and your mobile device via push notifications.
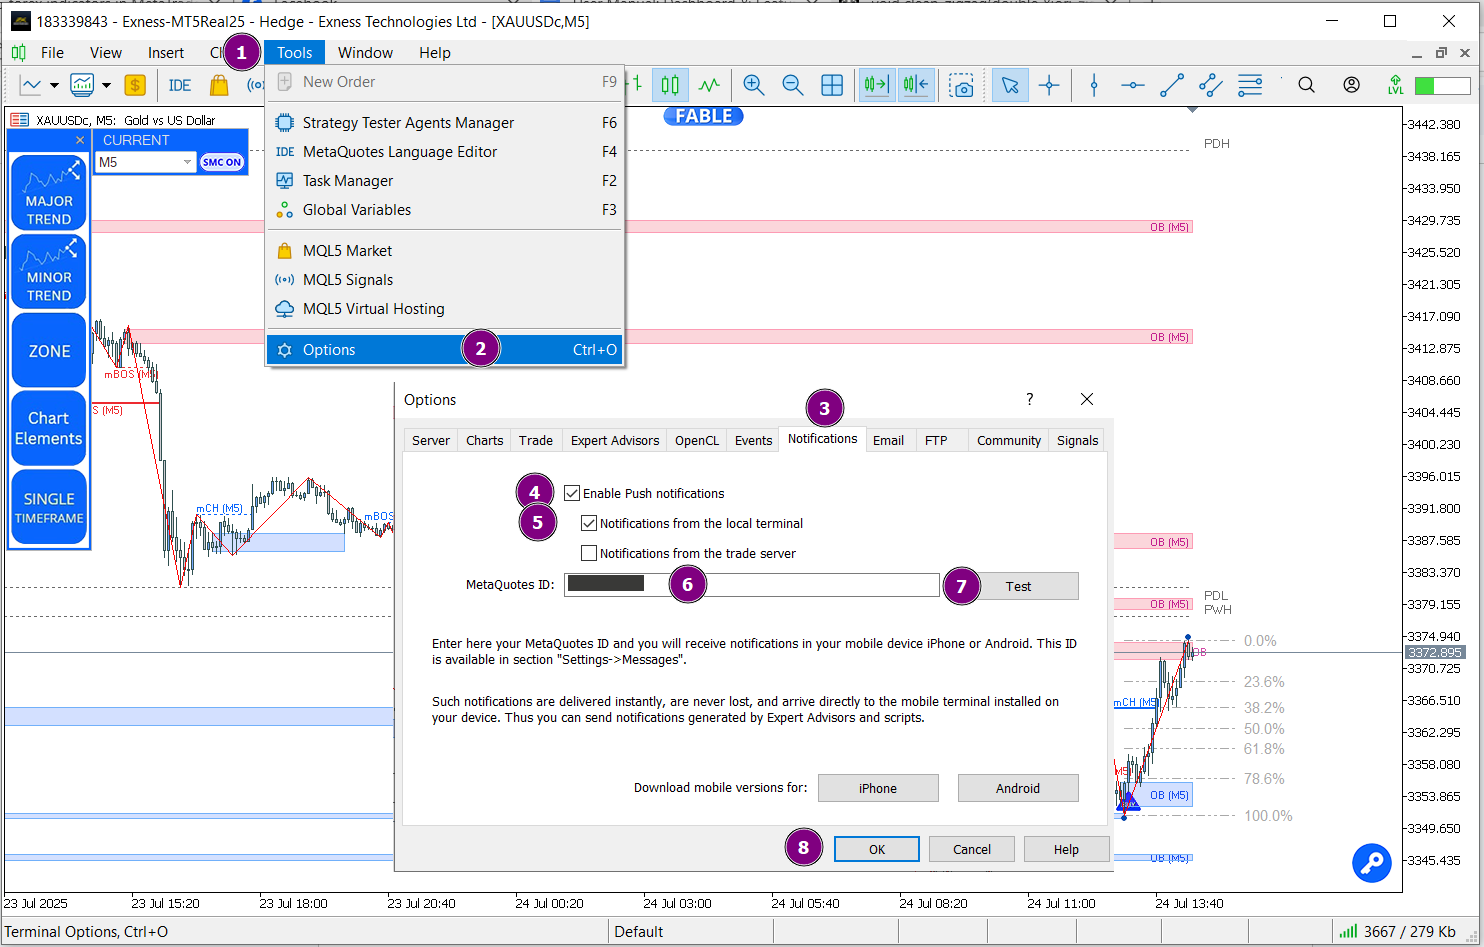
Steps to Set Up Notifications from MT5 to Your Mobile Device
1. Open MT5 on Your Computer (PC)
-
Go to Tools > Options.
-
Open the Notifications tab.
-
Enable Push Notifications.
-
Enter your MetaQuotes ID from the MT5 mobile app (see the next step).
2. Find Your MetaQuotes ID on Your Mobile Device
-
Open the MetaTrader 5 app on your smartphone.
-
Go to Settings.
-
Scroll down to find your MetaQuotes ID.
-
Copy the MetaQuotes ID and paste it into the corresponding field in MT5 on your PC.
3. Test the Notification
-
Click Test.
-
If everything is set up correctly, a test notification will be sent to your mobile device immediately.
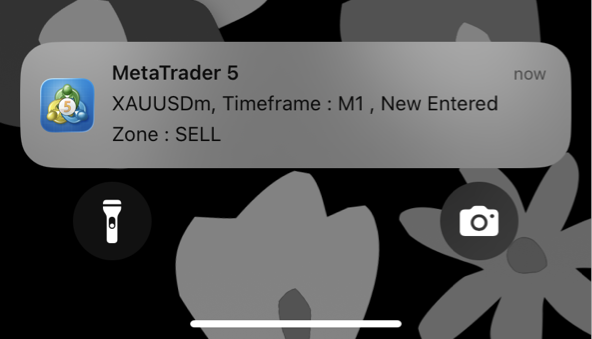
7️⃣User Interface & Chart Customization
Available features include:
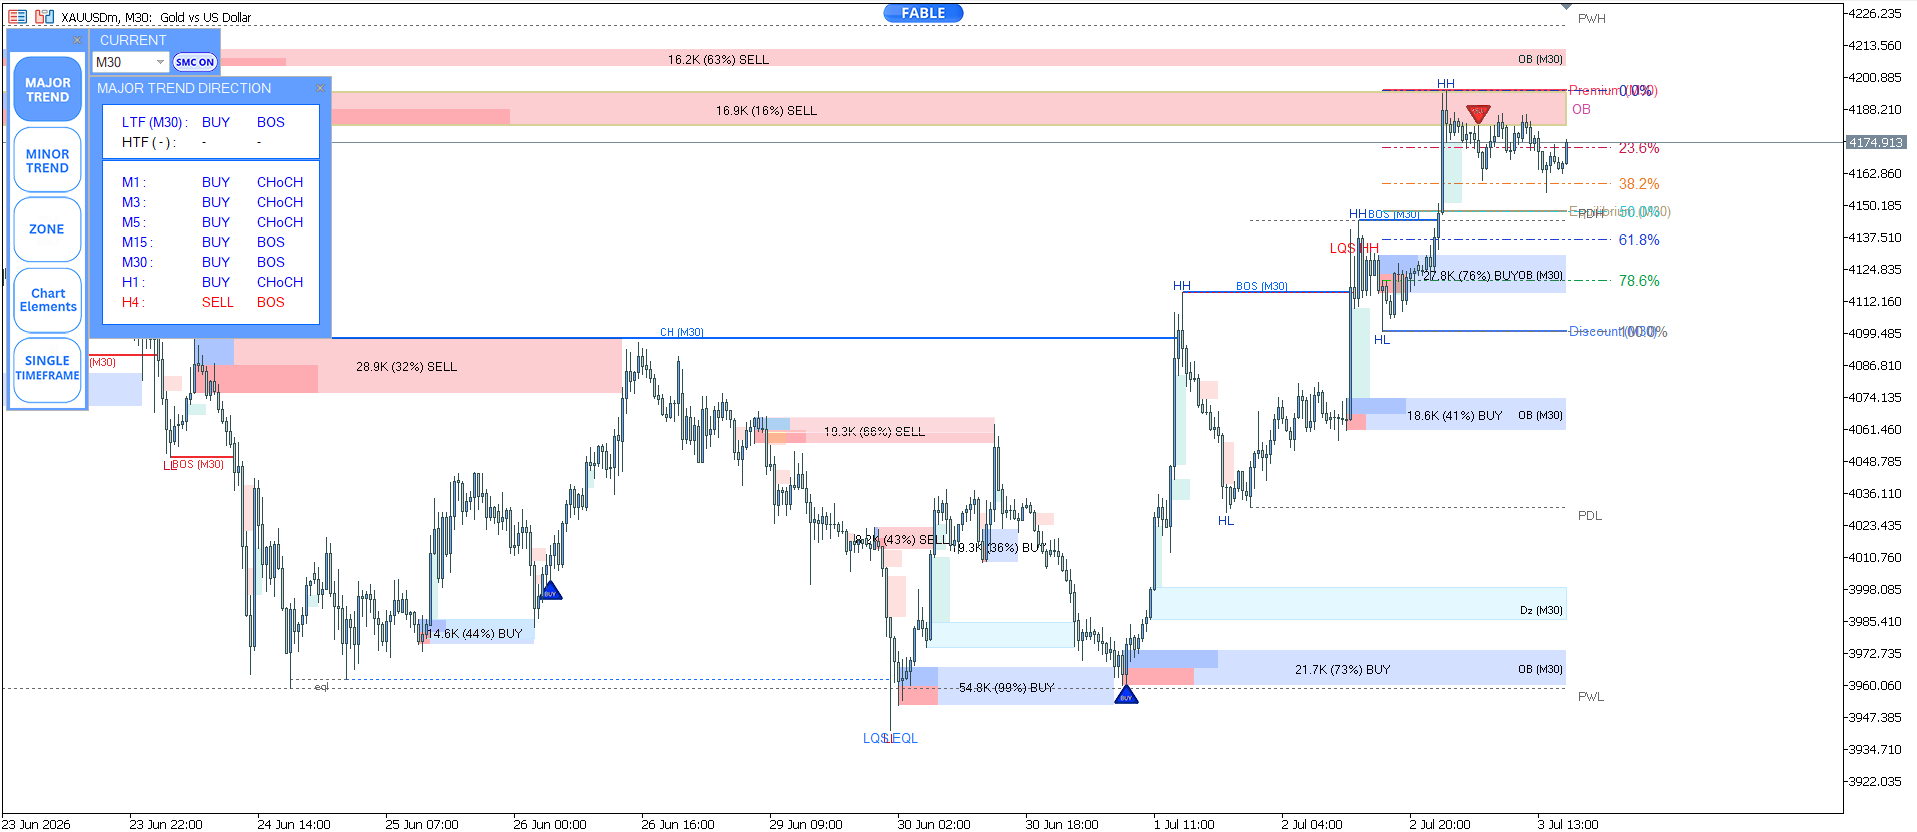
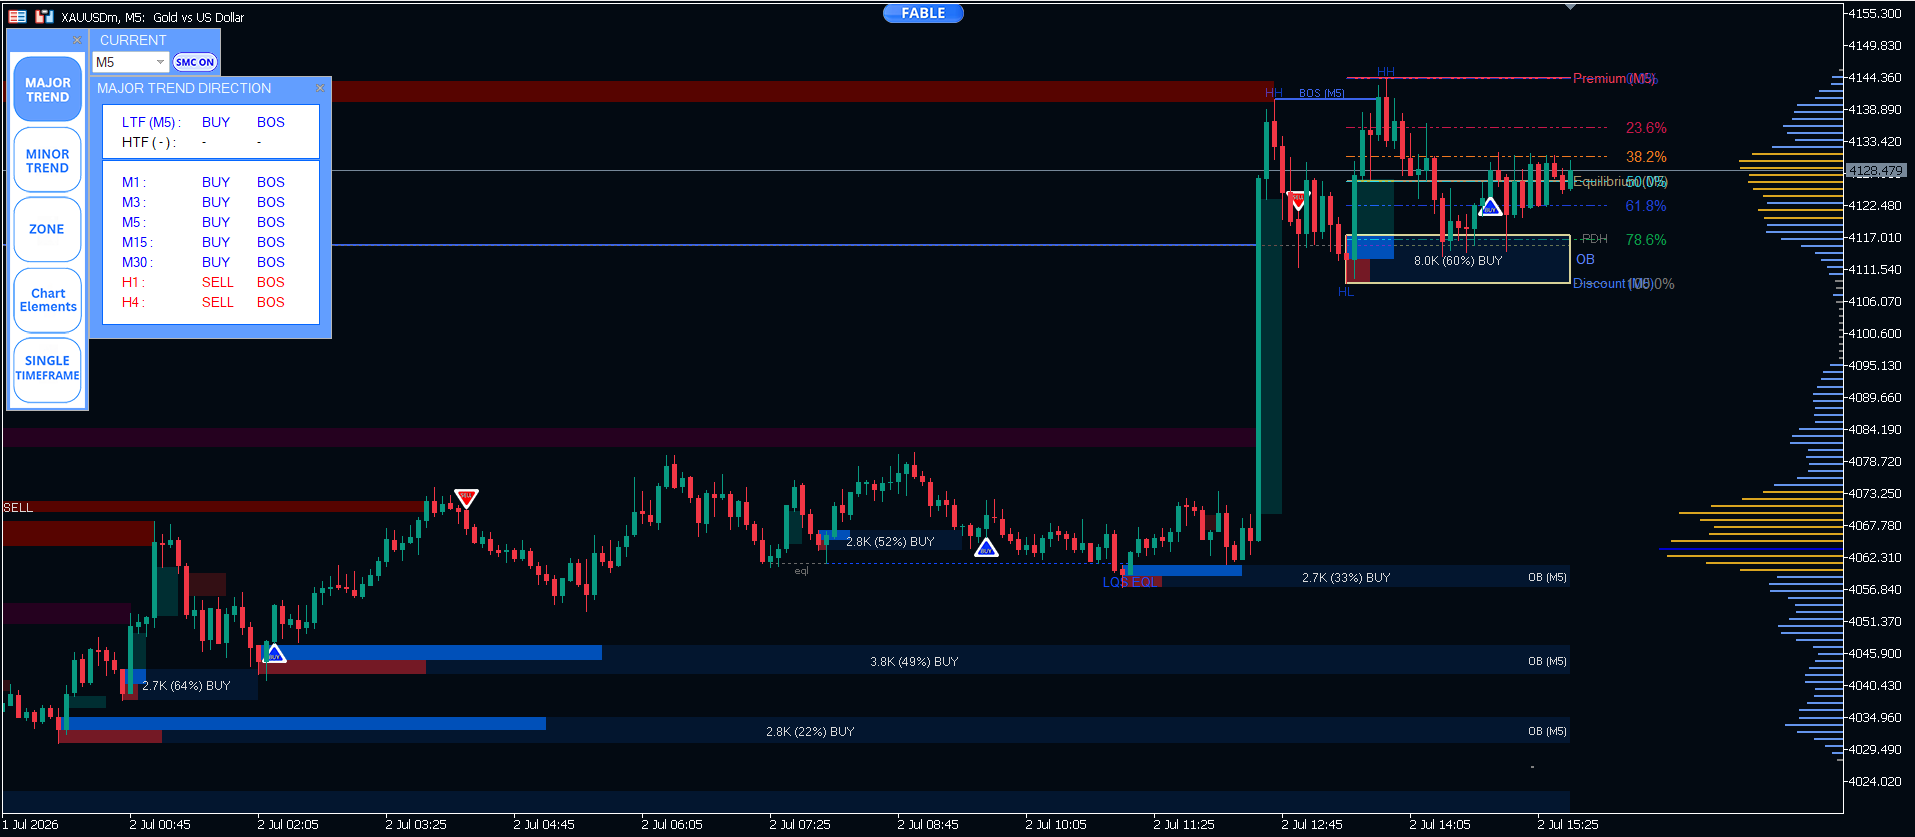
- Theme Settings
-
Light Mode
-
Dark Mode
-
Fully customizable themes
- One-click show/hide control panel
- Dashboard Lock / Scale Locked / Unlocked
-
Light Mode
-
Dark Mode
-
Fully customizable themes
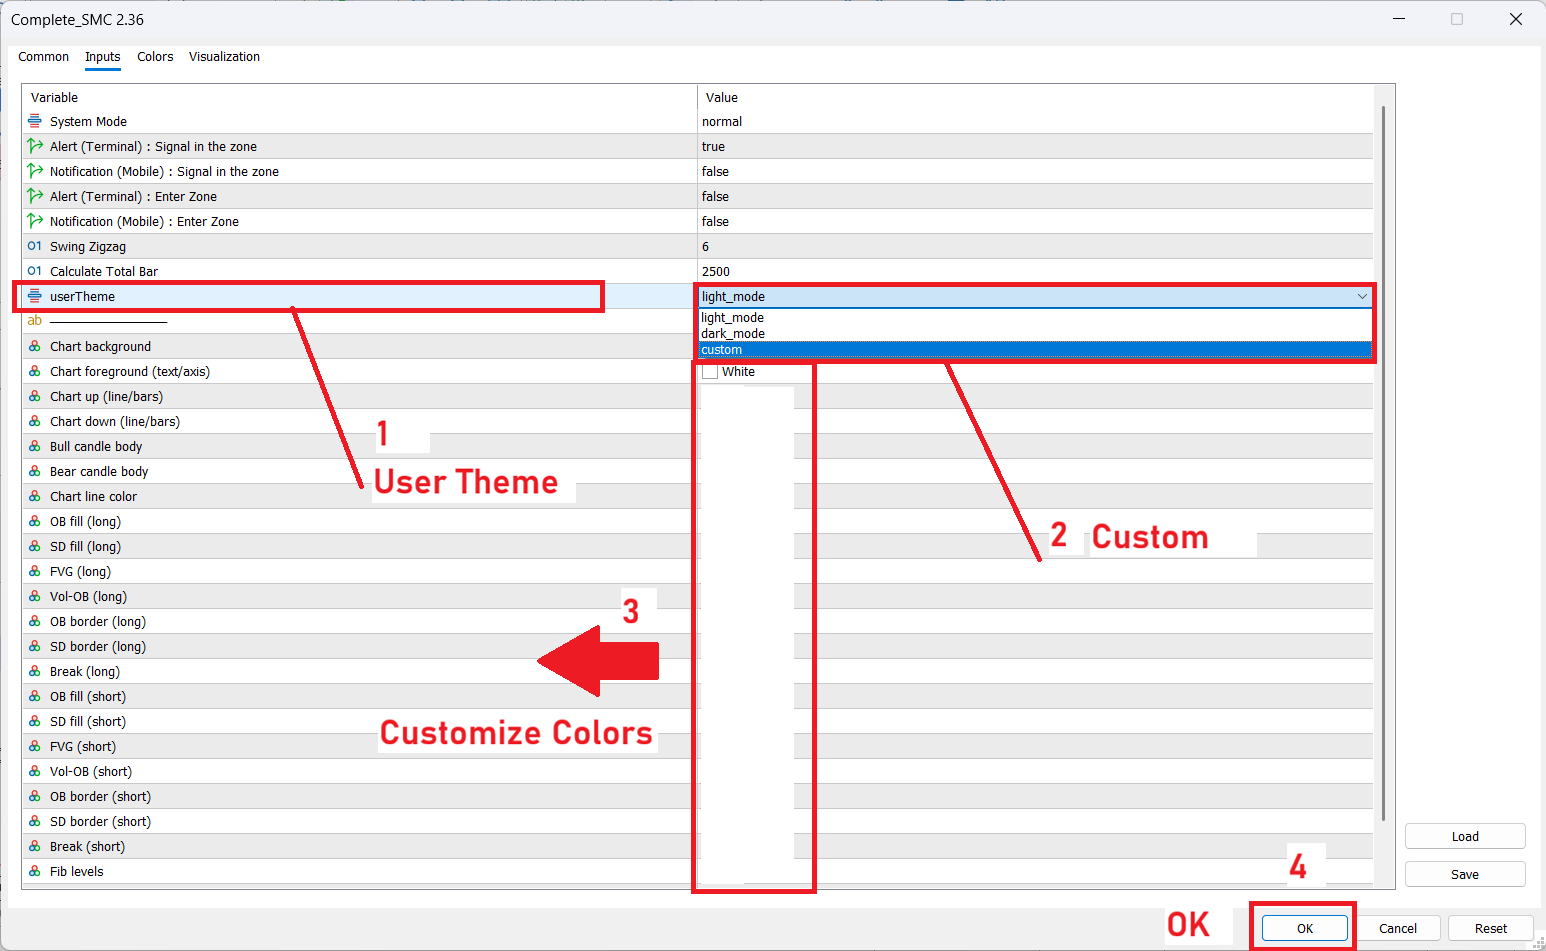
How to Use Custom Mode
1. Select User Theme
-
Go to the Inputs menu.
-
Locate the userTheme option.
2. Switch to Custom Mode
-
Click the Value field for userTheme.
-
Select Custom.
-
This mode allows you to fully customize the colors of all elements.
3. Customize Colors
Once Custom mode is selected, you can adjust the colors of various elements, such as:
-
Chart background
-
Other chart components listed in the settings
Click each color field to choose the colors that match your trading style.
4. Save the Settings
After finishing your customization, click OK at the bottom to confirm and apply the settings immediately.
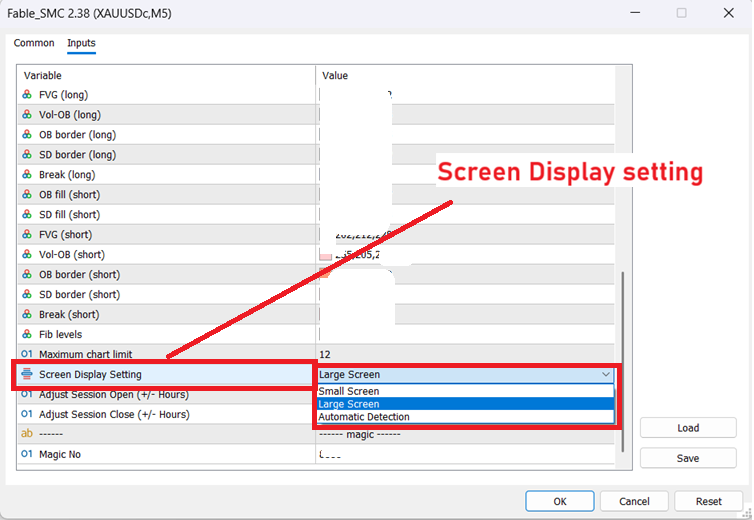
Screen Display Adjustment
Choose the display mode that best matches your screen size.
-
Small Screen
-
Large Screen
-
Automatic Detection
- Showing/Hiding the Control Panel
You can show or hide the Control Panel by clicking the FABLE LOGO.
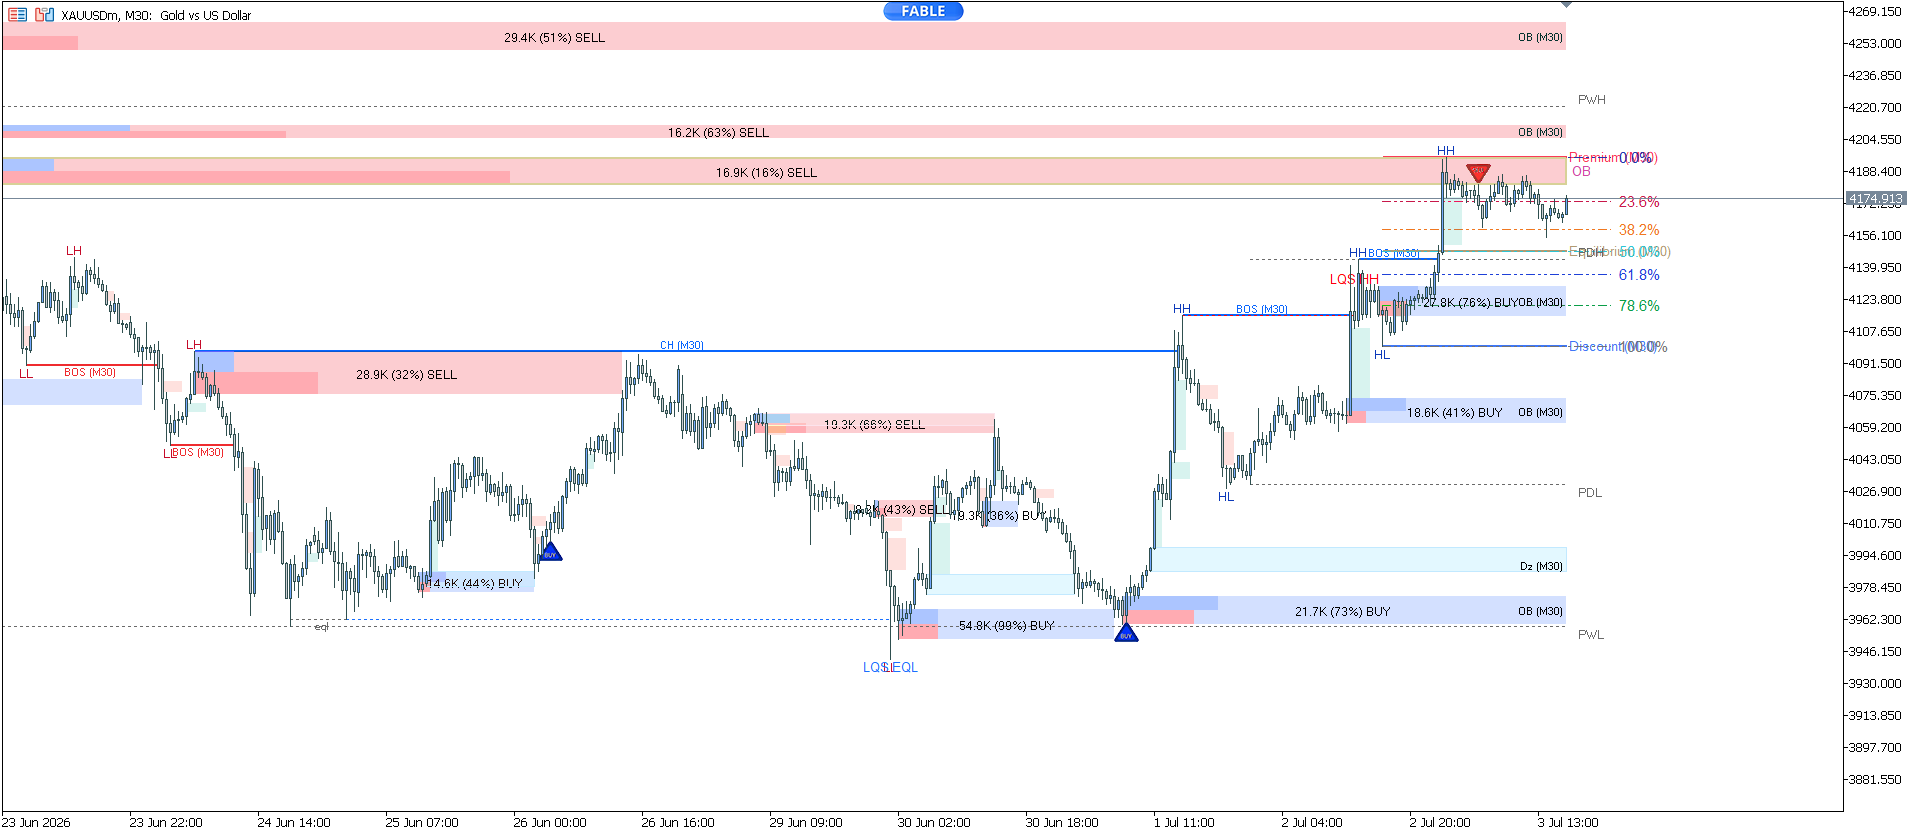
-
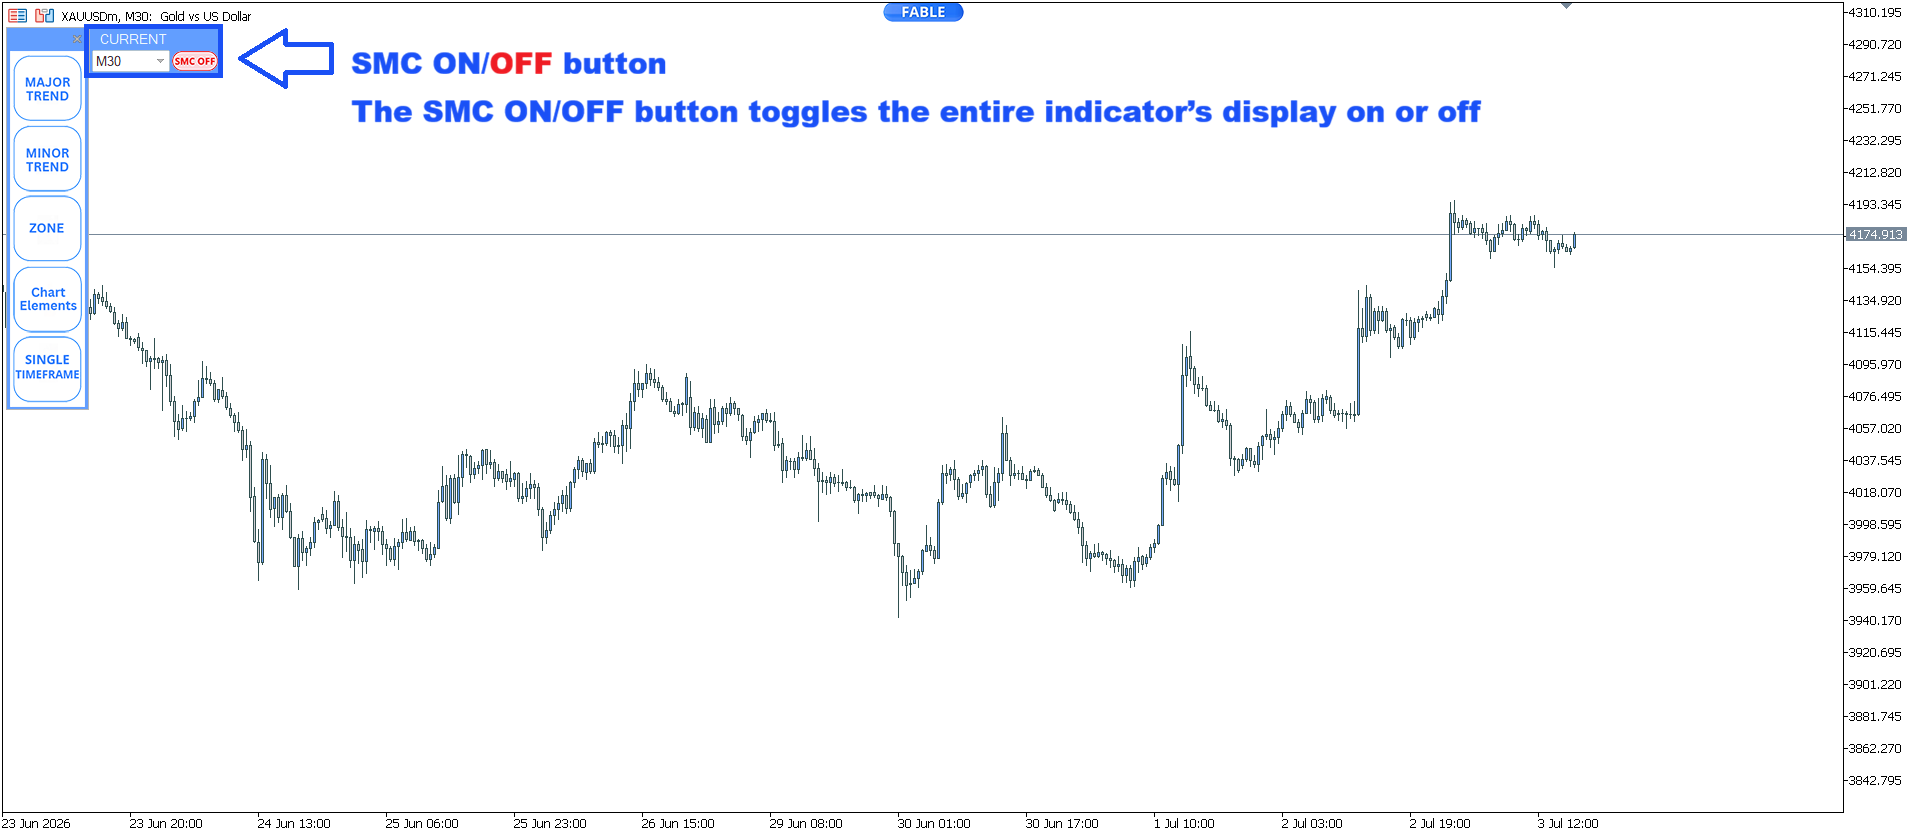
The system allows you to show or hide all SMC components on the chart with a single click. Use the SMC ON/OFF button to show or hide the entire indicator.
-
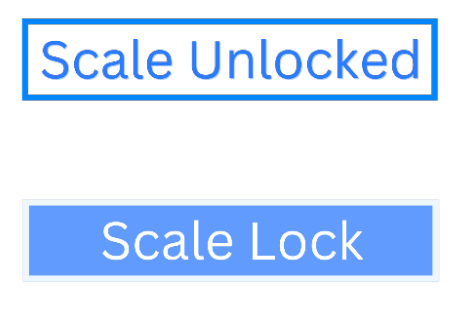
Scale Locked / Unlocked
Locks or unlocks the dashboard size for easier chart navigation and historical review, such as tracing the origin of lines and market structure.
8️⃣Swing Zig Zag Settings
The default Swing Zig Zag setting has already been optimized for most trading instruments (default value: 6).
You can use the default mode right away, but for traders who want additional flexibility, the Zig Zag value can be adjusted to suit different market conditions and trading styles.
It is generally recommended to set the value between 6 and 12 for balanced market structure analysis.
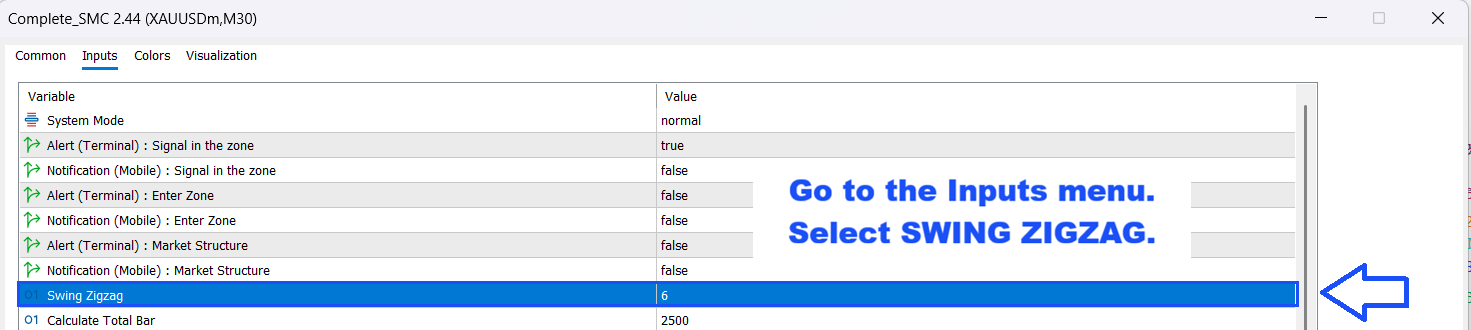
How to Adjust the SWING ZIGZAG / Calculate Total Bar Setting
-
Go to the Inputs menu.
-
Select SWING ZIGZAG or Calculate Total Bar.
-
Adjust the value as desired.
-
Click OK to apply the changes.
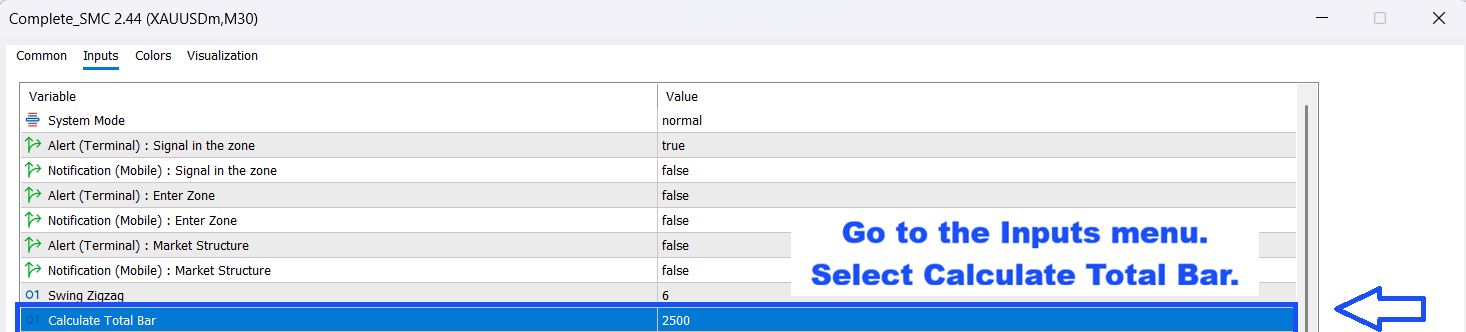
During back testing, you can adjust the Calculate Total Bar setting to control the number of candles displayed. After completing your backtesting, remember to restore the Calculate Total Bar setting to its default value to maintain optimal program performance.
📌9️⃣What is the difference between the Indicator Version and the Utility Version (Risk Per Trade)?
Both versions include exactly the same core SMC trading features. The only difference is that the Utility Version includes the Risk Per Trade tool. All other features are identical.
- Indicator Version: Recommended for users who use or plan to use other Trade Assistant tools in the future, as it allows additional Trade Assistant tools to be attached to the same chart.
- Utility Version (Risk Per Trade): Includes the built-in Risk Per Trade tool but does not support using other Trade Assistant tools on the same chart. Its advantage is a simpler, all-in-one setup.
⚠️ Important: Once activated, the version cannot be changed. Please make sure you select the correct version before activation.
🔟 Risk Per Trade Calculator Feature (Utility Version Only)
The Utility version includes a built-in Risk Per Trade Calculator for faster and more precise trade execution.
Features include:
-
Automatic lot size calculation
-
Risk-to-Reward calculation
-
Automatic order type detection
-
Pending Orders
-
Market Execution
-
Visual Trade Management
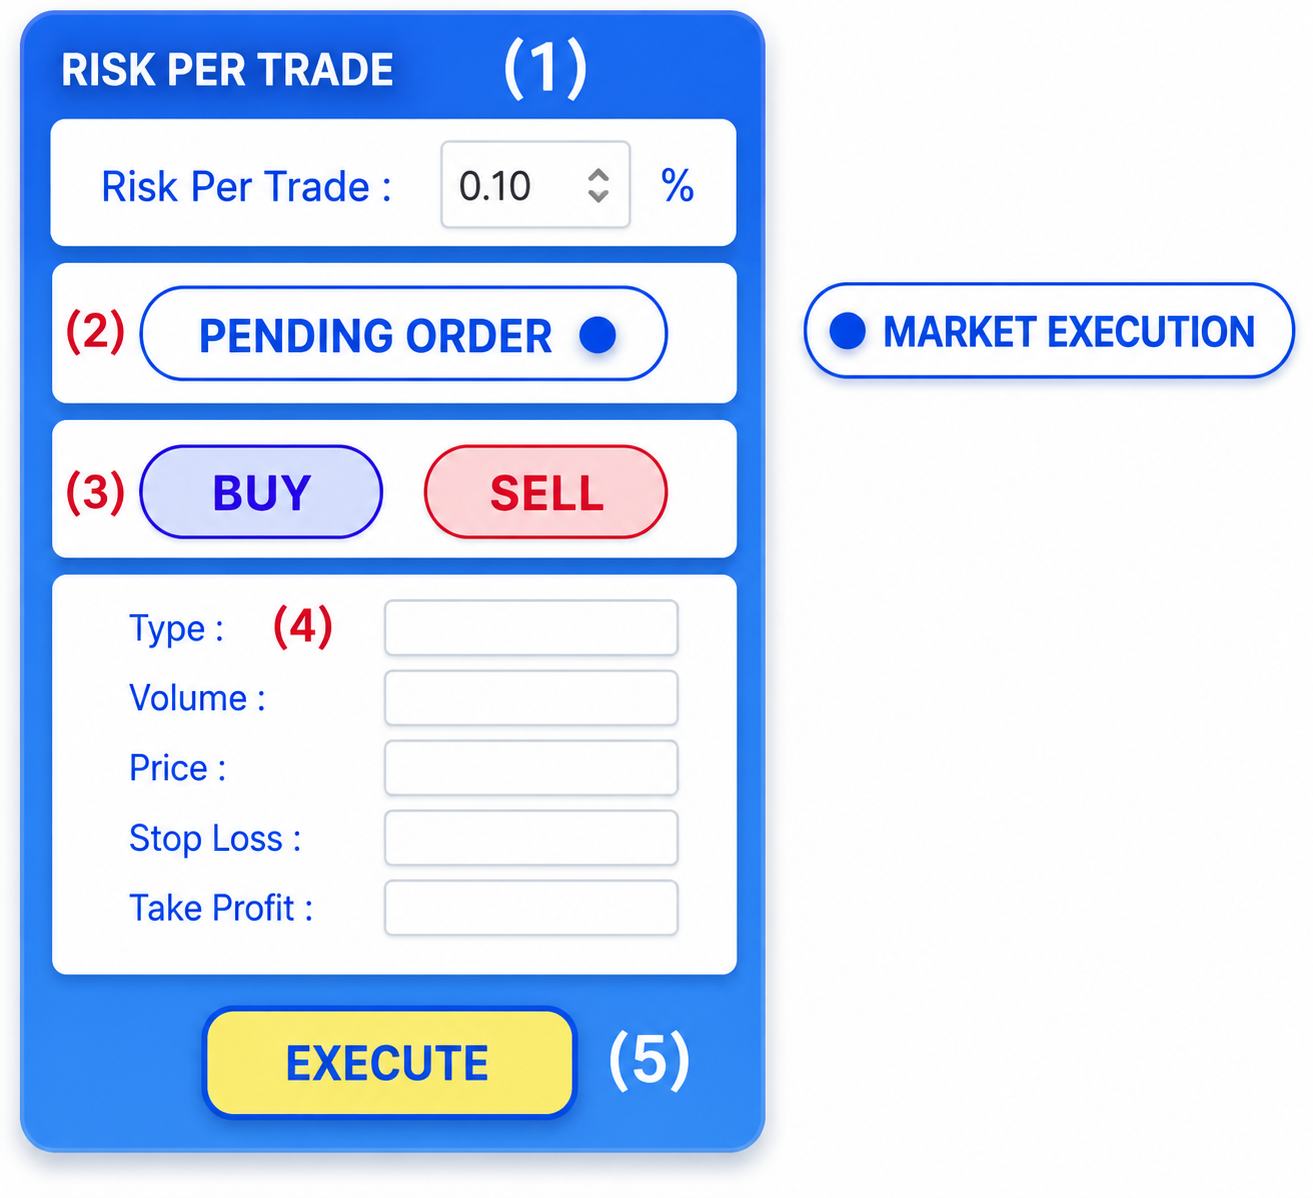
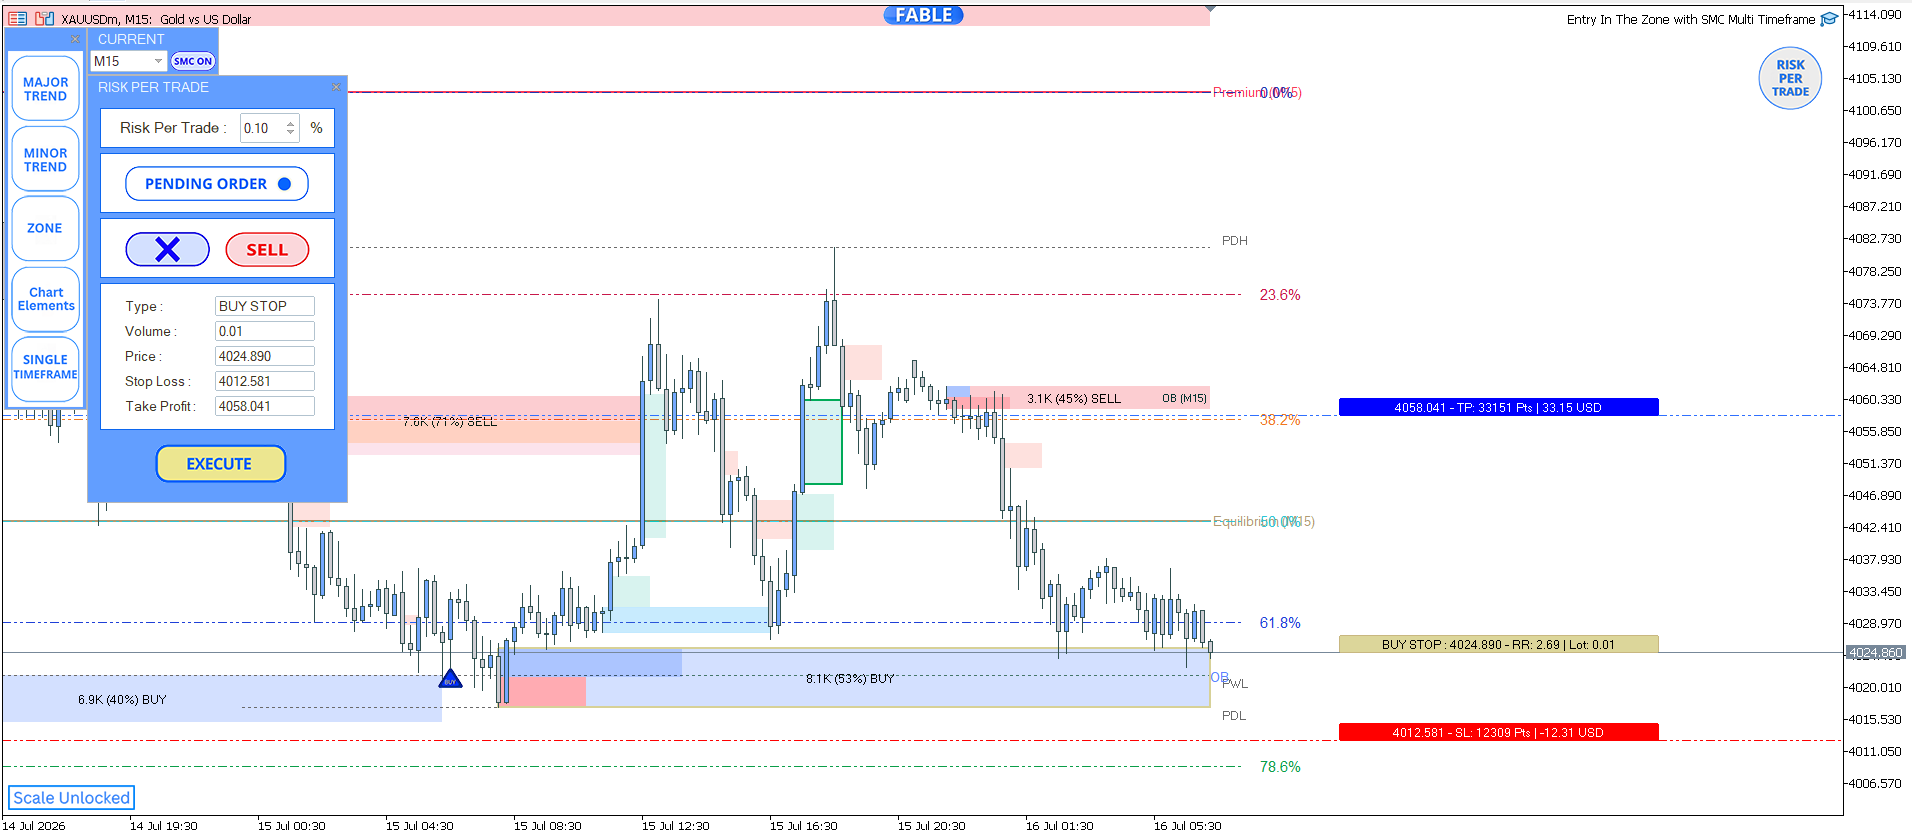
Simply set your risk percentage and drag your desired entry level — the calculator handles the rest of the calculations automatically.
-
Enter the percentage of your acceptable loss (Risk).
-
Order Types
2.1 Pending Order : Examples: Buy Limit, Sell Limit, Buy Stop, Sell Stop
2.2 Market Execution : The opening price will be at the current market price.
The system will automatically determine whether it is a Limit or Stop order.
-
Order Type: Buy or Sell
-
Order Details include:
- Type
- Volume
- Price
- Stop Loss
- Take Profit
-
Press the Execute button to place the order.
Risk management made simple with the built-in Risk Per Trade Calculator.
The system automatically calculates the appropriate lot size based on your selected Stop Loss level and risk percentage — while assigning the correct order type accordingly.
Simply drag to your desired price level and the system will automatically select Type: AUTO.
It analyzes the current price position and classifies the order as Stop or Limit under the appropriate conditions.
Fewer steps. Reduced errors. Greater execution precision.
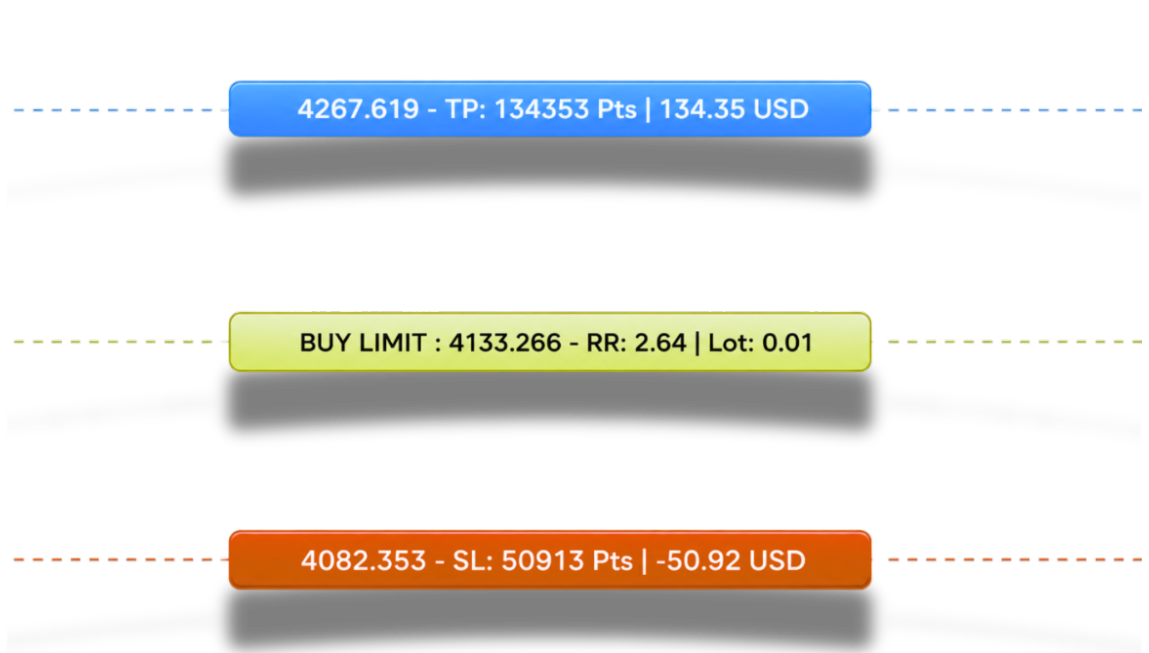
Gold Box: Represents the opening price line. Displays Order Type, Price, Risk-Reward (RR), and Lot size.
Blue Box: Represents the Take Profit price line. Displays Price, Number of Points, and the expected profit amount.
Red Box: Represents the Stop Loss price line. Displays Price, Number of Points, and the amount of money at risk.
For the Risk Per Trade Calculator Feature (Utility Version Only)
Installation and User Guide
Check the Following Options
-
2.1 Allow modification of Signal settings
-
2.2 Allow Algo Trading
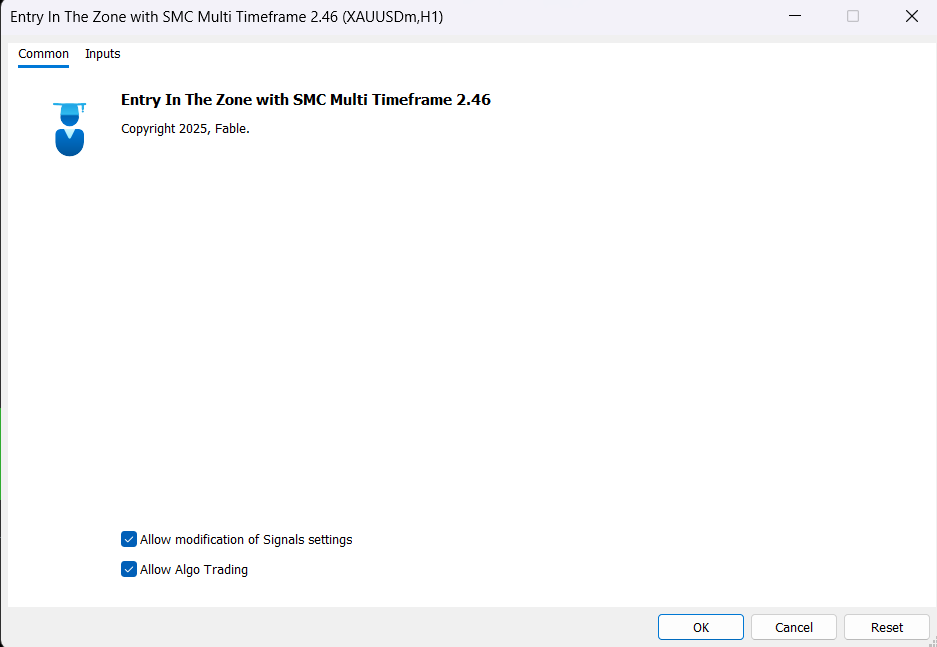
Click the Algo Trading button.

1️⃣1️⃣ Trading Workflow Using Smart Money Concepts
SMC 5-Step Trading & Analysis: A Systematic Approach to Analyzing and Entering Trades with Smart Money Concepts
Many traders are familiar with Smart Money Concepts (SMC) as a theory, but when it's time to actually sit in front of the charts, they often don't know where to start — should you look at market structure first, or POI first? And how do you know when to wait versus when to enter?
This article breaks down the SMC trading approach into 5 practical, actionable steps — from reading the bigger picture to managing risk.
Step 1: Identify Market Structure — The Bigger Picture Shows Direction, the Smaller Picture Shows Timing
Every SMC trade begins by answering one key question: "What is the market doing right now?"
-
Identify the major trend: Uptrend (consecutive HH/HL), Downtrend (consecutive LH/LL), or Sideways/Range.
-
Watch for a Structure Shift (CHoCH) as a signal to prepare — not as an immediate entry signal.
-
Clearly define your timeframes: Higher timeframes (H1/H4/D1) are used to read context and the overall direction, while lower timeframes (M15/M5/M1) are used to find precise entry timing.
The simple rule: never trade against the bigger picture, no matter how attractive the smaller picture may look.
Step 2: Map Points of Interest (POI) — Plan Ahead Where Smart Money Is Likely to Be
Once the direction is clear, the next step is to mark zones with a high probability of large capital movement.
-
Identify Order Blocks (OB), Supply/Demand Zones, and Fair Value Gaps (FVG).
-
Look for Liquidity : EQH/EQL, PDH/PDL, PWH/PWL — areas price is often drawn toward before reversing.
-
Use the Premium/Discount Zone together with Fibonacci levels (50 / 61.8 / 78.6) to assess whether the current price is in an "expensive" or "cheap" zone.
-
Mark zones that are still Unmitigated (not yet retested), as these carry more weight than zones price has already passed through.
This step is essentially "setting the trap in advance" and then waiting for price to come to you.
Step 3: Wait for Price & Evaluate Context — Don't Chase Price, Let Price Come to You
One of the most common mistakes beginner traders make is entering too early, before price has reached the planned zone.
-
Wait for price to reach the POI marked in Step 2.
-
Watch for a Liquidity Sweep above/below EQH-EQL or PDH/PDL / PWH/PWL before a reversal occurs — this signals that Smart Money may be "sweeping liquidity" before entering a real position.
-
Consider the current Trading Session (Tokyo, London, New York) and major news events, since different sessions have different characteristics in terms of volatility and liquidity.
Step 4: Confirm Entry (Lower Timeframe) — Clear Signal, Clear Entry
Once price has reached the zone and the context aligns, this step involves confirming the signal on a lower timeframe before entering the trade.
-
Reversal: Look for CHoCH/mCHoCH, indicating a structural change.
-
Continuation: Look for BOS/mBOS, confirming the existing trend continues.
-
A common pattern: Sweep → Return into Range → CHoCH/BOS.
-
Enter near an OB/SD/FVG, confirmed by its position within a Discount Zone (for Buy) or Premium Zone (for Sell).
Step 5: Execute Trade & Manage Risk — Trade with Discipline, Manage Risk Systematically
The final step is putting everything into practice with clear risk management rules.
-
Entry: Enter only after confirmation at the POI.
-
Stop Loss: Placed below/above the zone, or below/above the most recent swing point.
-
Take Profit: Set at the next OB/SD/FVG, or use market structure/Fibonacci to define multiple target levels.
-
Risk Management: Maintain a Risk:Reward ratio of at least 1:2 (adjustable to your own strategy), and consider using Partial Close or Trailing Stop to lock in profits.
Doing These 5 Steps Manually vs. Letting the System Help You
The 5 steps above represent the correct mindset for SMC trading — but in practice, each step demands significant time and screen monitoring, especially Steps 1–2, which require watching multiple timeframes simultaneously, and Step 3, which requires waiting in real time for a Liquidity Sweep.
This is exactly why Entry In The Zone and SMC Multi Timeframe was designed to work directly in line with these 5 steps:
-
Step 1 (Market Structure) → The system automatically detects BOS, CHoCH, mBOS, mCHoCH, Major/Minor Trend, and labels HH/HL/LH/LL — across both Single-Timeframe and Multi-Timeframe modes.
-
Step 2 (Map POI) → The system instantly identifies Order Blocks (Volumized), Supply/Demand Zones, FVGs, and Liquidity (EQH/EQL, PDH/PDL, PWH/PWL), along with Premium/Discount Zones and Auto Fibonacci.
-
Step 3 (Wait & Evaluate) → Displays Trading Sessions and alerts you when price approaches a key zone, while detecting Liquidity Sweeps in real time.
-
Step 4 (Confirm Entry) → No-Repaint BUY/SELL signals with instant alerts as soon as a BOS/CHoCH occurs, helping you enter with confidence.
-
Step 5 (Execute & Backtest) → Every zone is displayed on historical data, supporting backtesting so you can systematically test and refine your own risk management strategy.
In short, this 5-step framework is still something you need to understand and decide on yourself — but the most time-consuming work, such as drawing structure, identifying POIs, and watching the screen for signals, can be left to Entry In The Zone and SMC Multi Timeframe, working for you in real time.
Smart Money Concepts (SMC) : https://docs.google.com/document/d/1ziu41g5PueYSo1DudkBWyXKbhJmU07qu8tyDAT_i0iE
1️⃣2️⃣ The FABLE Pro Suite
The FABLE Pro Suite User Guide :
https://docs.google.com/document/d/1ScE7YST6PCaenRpSxr1ZpV-_Dk9htGrqyEP4R6GAbM4
📍 Current Indicator Versions
| Tool Name | Category | Version | Last Update | |
|---|---|---|---|---|
| 1 | Auto Multi Trendlines – Breakout Signal Alerts | TREND | V 1.1 | 11 Jun 2026 |
| 2 | Price Action Radar | PRICE ACTION | V 1.2 | 22 May 2026 |
| 3 | Smart Strength | STRENGTH | V 1.6 | 28 Jul 2026 |
| 4 | Adaptive RSI Filter | MOMENTUM | V 1.0 | 17 Nov 2025 |
| 5 | Auto Volume Profile | VOLUME | V 2.6 | 28 May 2026 |
| 6 | Bar Count Down | TIMING | V 1.2 | 18 Jul 2026 |
| 7 | Adaptive Nadaraya MTF | TREND | V 1.75 | 12 Mar 2026 |

Multi Trendlines – Breakout Signal Alerts
Multi Trendlines is an indicator that automatically draws Trendlines by detecting Swing Highs and Swing Lows across up to 3 Timeframes, helping you analyze market trends more clearly, cover multiple timeframes, and gain a better overall view of the market.
Features
-
Supports Multi-Timeframe analysis (up to 3 Timeframes simultaneously)
-
Alerts when a Trendline Breakout occurs
-
Enable or disable Breakout Signal Alerts through the Inputs Settings menu
Price Action Radar
A multi-timeframe pattern scanner that detects key price action signals across multiple timeframes in real time. It highlights recent structure formations and provides a clear top-down view, helping traders quickly identify high-probability setups and align entries with overall market context.
Patterns Detected by the Indicator
-
CRT (Candle Range Theory)
-
ENG (Engulfing)
-
PIN (Pin Bar)
-
TTL (Turtle Soup)
-
TWZ (Tweezer)
Smart Strength
is a market force analysis tool that measures currency and asset strength across the entire market, helping traders identify where money is flowing in real time. It highlights strength imbalances between instruments, providing clear market context to support smarter trading decisions.
Includes support for Gold (XAU).
Adaptive RSI Filter
An adaptive momentum filter that adjusts its responsiveness to market conditions, helping confirm entry timing and reduce false signals without repainting.
Auto Volume Profile
is an analysis tool that displays the distribution of trading volume across price levels, independent of time intervals. It helps identify the price levels with the highest accumulated trading volume, allowing traders to clearly recognize areas of genuine buying or selling interest. It is designed to align with Market Structure principles to support more effective market analysis.
The visibility and Line Style of VAH, VAL, and POC can be turned on/off and adjusted from the Inputs menu.
Bar Count Down
A real-time candle countdown that helps traders manage timing, avoid premature entries, and execute trades with greater precision.
Adaptive Nadaraya Multi-Timeframe
A non-repainting, auto-tuned multi-timeframe trend indicator designed to keep traders aligned with continuous market flow.
1️⃣3️⃣ Step-by-Step Guide to Purchasing, Installing, and Updating
https://docs.google.com/document/d/1U9SXYaN16YhXGv31vbnqbdpMLp0YULdYSUjQs9aY6WI
⚠️ RISK DISCLAIMER
Trading CFDs, commodities, and other leveraged financial products involves a high level of risk. Users should carefully assess their own risk tolerance and consider consulting a licensed financial professional before making any investment decisions.


