
Structure First: Why I Check XAUUSD Zones Before RSI or MACD?

I still use RSI. I just stopped letting it choose the location.
An oversold reading near a well-tested H4 support is one thing. The same reading somewhere in the middle of a daily range is usually just noise - and on gold, noise is expensive. XAUUSD can stay overbought or oversold far longer than any oscillator-based setup expects, especially when it's trending hard.
This took me longer to accept than it should have. I was adjusting entry parameters, tweaking thresholds, testing different period settings - when the actual problem was simpler and more embarrassing: I was trading in the wrong location.
Structure did not make the losing trades disappear. Nothing does. What it gave me was a better way to separate an area worth watching from a random point somewhere in the middle of a move.
That is still how I think about indicators now: location first, confirmation second.
🌟 What Indicators Are Actually Doing
Most oscillators are derivatives of price. RSI measures the ratio of recent gains to losses. MACD measures the distance between two moving averages. Bollinger Bands measure volatility relative to a moving average.
They describe what price has done. They do not tell you whether where price is sitting right now is a location that other participants care about.
They cannot know whether a swing high has been tested twice and held, or whether price is approaching an area that caused a sharp reversal on the weekly chart six months ago. A structural level carries context from prior interaction. An RSI reading carries none of that.
When price reverses near an RSI extreme, the indicator did not cause the reversal. Something in the location did. The RSI happened to reach an extreme at a point where the price structure was already worth paying attention to. Trade the indicator in the middle of nowhere and you find out quickly how often that relationship fails.

🌟 Gold Makes This Harder Than Most Markets
XAUUSD in 2025 into 2026 has been a difficult environment for indicator-only logic.
The run from the mid-$2,600s in early 2025 to above $5,000 in early 2026 - with the ATH near $5,595 before the correction - kept momentum indicators in extended overbought territory for weeks at a time. Fading RSI 70+ without structural context in that environment was a consistent way to lose money. The mean-reversion logic that might work in a ranging market became a sequence of stop-outs during trend continuation.
Then during the sharp correction phases, intraday ranges expanded fast. Spreads on what are normally tight ECN accounts widened considerably during the most volatile sessions - conditions that a signal firing from RSI or MACD cannot account for. The signal sees the price move. It does not see the spread at the moment of execution, or the fact that the stop you planned assumes a spread that no longer exists during that hour.
A structural zone at a major prior swing does not care what the spread is. Whether you can trade it profitably at current spreads is a different question - but the zone itself does not move because conditions changed.
🌟 Two Months of Drawing Zones by Hand
After recognizing the problem, I stopped trading for a while and spent time doing nothing except mapping XAUUSD levels manually. Weekly highs and lows. Monthly pivots. Areas where price had made clear, multiple-touch rejections. Areas where the character of price action changed - where candles went from clean directional bodies to messy wicks sitting inside a tight range.
Tedious work. No automation. Just chart time.
What came out of it was a usable map - not a guaranteed trade plan, but a picture of where the interesting things tend to happen versus where price is just in transit between levels.
That distinction changed how I look at execution. In transit areas, where there is no structural significance, fills tend to be less consistent during fast moves. Liquidity concentrates at areas that are visible to a wider group of participants. I cannot verify the full order picture from a standard MT5 feed, but I can see where repeated reactions have occurred - and that is the part I actually care about.
🌟 The Problem That Made Me Start Building Tools
Drawing zones manually worked while I had the time. Forty-five minutes every weekend, recalibrating, updating levels that had broken or been retested and held.
The moment life got busier, that maintenance slipped. And stale levels are worse than no levels. A zone that was strong support in January, cleanly broken in March, and sitting as resistance in May - if you missed the break, your tools still show it as support. That is not a bug in the code. It is an information problem that compounds over time.
Automating zone detection sounds simpler than it is. Price does not break levels cleanly. It probes, closes slightly beyond, comes back, probes again. The decisions that are obvious in hindsight - was that a genuine break, or a false break that reversed? - required explicit definitions once I started putting them in code.
How many bars? What penetration depth? When does the retest confirmation expire? These are judgment calls in manual trading. In code, you have to define them precisely, which forces you to be honest about what you actually believe.
Coding it became messier than I expected. Some of the rules I thought were clear turned out to be vague when I tried to write them down.
🌟 One Timeframe Is Never Enough
Early in automating structure detection, I worked purely on M15.
M15 zones are noisy. Many of what look like clean levels on the smaller chart are just congestion between meaningful H4 or D1 areas. When M15 and H4 structure are aligned, the setups tend to behave better. When an M15 zone sits in the middle of a higher-timeframe range - between two more significant levels - it tends to fail in ways that are hard to backtest out of, because the failure mode is not random. It is structural.
Adding higher-timeframe context to every M15 level changed which setups I acted on. Some of what looked like good entries from the M15 perspective became non-entries once I checked the D1. This is obvious in retrospect. It was not obvious when I was filtering signals only from the chart I had open.
🌟 Break, Retest, or Rejection - These Are Not the Same Setup
There are two fundamentally different things that can happen at a structural zone, and treating them the same has cost me setups and created bad entries.
Price approaches a zone and rejects cleanly. Setup logic: fade the move, stop beyond the zone, target the prior swing.
Price breaks through, consolidates, then retests the broken level from the other side before continuing in the direction of the break. Setup logic: enter in the direction of the break on the retest, stop back through the zone.

These require different entries, different stop placement, and different timing. A zone indicator that does not distinguish between an unbroken zone, a freshly broken zone, and a confirmed retest is collapsing three different states into one display. It looks clean on the chart. It creates execution confusion in practice.
The period between the break and the retest is where bad decisions tend to happen - you see the break, the momentum looks strong, and the temptation is to enter immediately rather than wait for the retest that confirms the level has flipped. Sometimes that works. Sometimes price breaks, fails to hold, and reverses hard back through the original level.
Waiting for the retest is slower. It misses some setups entirely. I have made peace with that.
🌟 Regime Context: The Same Zone Behaves Differently
Zone detection does not exist by itself. A zone that caused a clean rejection during a ranging week may see price run straight through it when a trend is accelerating.
This is the problem with applying any structural rule without knowing what kind of market you are currently in. Trend conditions favor continuation through structure. Range conditions favor rejection at structure. Choppy, news-driven days behave differently from both.
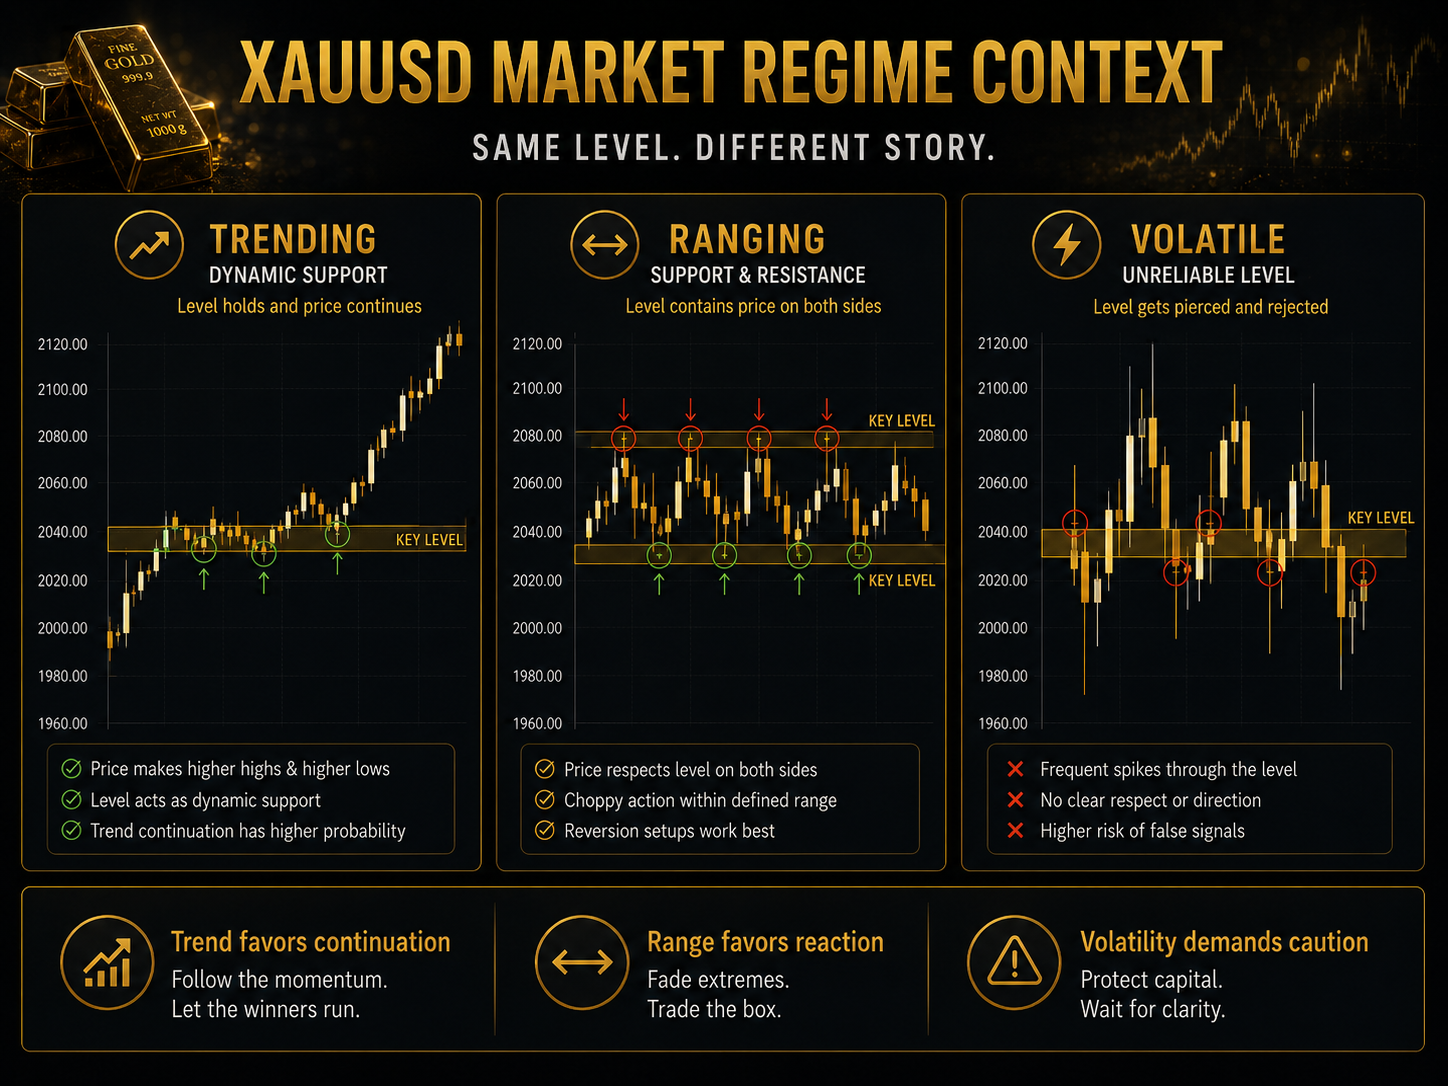
An automated approach that treats every zone the same way regardless of the broader environment is going to generate signals in conditions that do not favor them. Filtering by regime - identifying whether gold is currently trending, ranging, or in a volatile, uncertain state - does not eliminate losing setups. It reduces the proportion of setups taken in environments where the structural logic is least likely to hold.
This is the layer that sits above zone detection. Location first. Context second. Confirmation third.
🌟 What Backtests Do Not Show
Zone detection in backtests is clean because historical data is fixed. In live trading, the bar you are analyzing is still forming. A rejection that looks obvious on a completed candle was ambiguous three minutes before the close. Alert-on-close confirmation avoids this problem; alert-on-formation creates it.
News events destabilize structural analysis temporarily. On major macro releases - particularly those affecting USD or risk sentiment - gold can gap through levels that would normally provide meaningful reaction. My current rule is no new entries during the 60 minutes before and the first 30 minutes after a scheduled high-impact release. Not because structure becomes irrelevant, but because execution in that window is unpredictable enough that the edge from structural alignment disappears.
VPS quality affects results more than most algo traders want to admit. Running the same indicator on different server setups, closer and further from execution, produced noticeably different alert timing during fast-moving sessions. This is not catastrophic on a zone indicator. But if the workflow depends on acting quickly after an alert fires, the latency difference matters.
One execution rule that has stuck: if the current spread exceeds 40% of the intended stop distance, I skip the setup regardless of how well the structural location looks. This is a personal operating rule, not a universal threshold - but it keeps execution cost from quietly eating setups that look profitable on the screen.
🌟 How the Workflow Actually Looks Now
Weekend: mark D1 and H4 zones, note which have been recently broken and are now flipped, remove invalidated levels.
Each morning: check whether gold is trending, ranging, or uncertain based on overnight behavior and the economic calendar. This changes which structural signals I act on.
During the session: indicators for confirmation - momentum slowing on the approach to a zone, or aligning with the directional bias. Not as triggers. As additional weight.
The result is not exciting. Some days there are no entries. Some weeks have two or three trades, of which one or two are small losses. Drawdown does not disappear. But it tends to come from setups that made structural sense, which means when the analysis fails, I usually understand why. That is worth more than the alternative.
🚀 On the Tools
I built three indicators that address different parts of this workflow directly.
Gold Market Structure PRO MT5 handles multi-timeframe zone detection and alignment - classifying structure from M5 through D1 and flagging zones with multi-timeframe confirmation versus those isolated on a single chart.
Support Resistance Break Zones PRO tracks zone state as price interacts with it - unbroken, freshly broken, or confirmed retest - so the display reflects where in the price-structure story each level currently sits.
Gold Bias Regime Filter handles the regime layer: identifying trending, ranging, and volatile market states so that structural signals can be read in context.
None of these guarantee a profitable setup. They address the information gaps that made manual structure trading unsustainable for me at scale. What the tools define and how they define it matters more than how the chart looks - so if you are evaluating any structure indicator, check what it calls a break, what it calls a retest, and what invalidates a zone. Those rules are the actual methodology.
🎁 New to Gold Algo Lab?
Start with the Gold Algo Lab Tool Map - a practical guide that organizes our MT5 tools into 6 connected stages: market context, setup selection, risk planning, trade execution, position management and account protection.
→ Gold Algo Lab Tool Map: Where to Actually Start With MT5 Tools for XAUUSD
https://www.mql5.com/en/blogs/post/771930
Do not choose a tool by its name alone. Start with the part of your trading process that needs the most control, then build your workflow one layer at a time.
Gold Algo Lab builds practical, risk-first MT5 tools for serious XAUUSD traders - shaped by 8 years of building and trading real systems, with no hype, no profit guarantees, and no unrealistic promises.


")