Most traders rely purely on technical analysis. They stare at charts, draw lines, and look for patterns. But they still lose money.
Why? Because charts only show half the story.
The real driving force behind the market is fundamental data. Every major price swing is fueled by economic releases like inflation, employment, and central bank decisions. Trying to trade currency pairs like EURUSD using technicals alone is like driving blindfolded.
The problem is that tracking global economic data manually is exhausting. It takes hours to analyze reports, calculate surprises, and figure out what it actually means for the US Dollar.
That is why the USD Economic Strength Index changes everything.
This automated MQL5 tool processes real-time macroeconomic data instantly. It cuts through technical noise and gives you an unshakeable market edge.
-
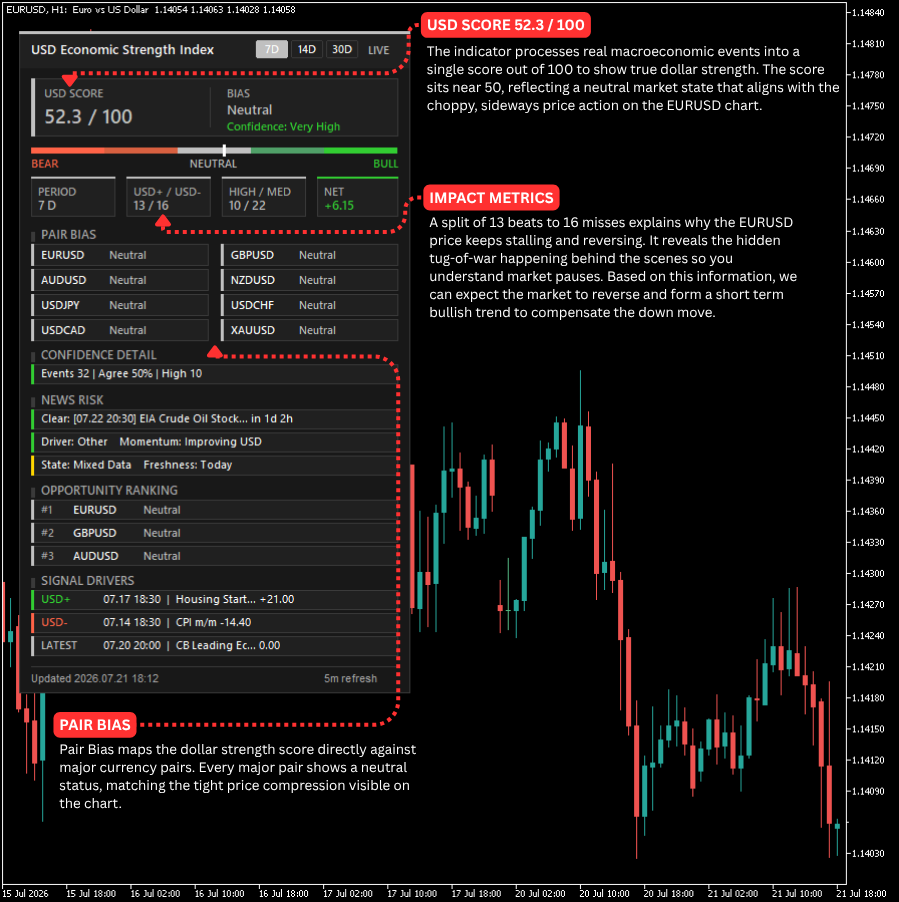
The USD Score: A clear baseline metric out of 100 that shows true dollar strength.
-
Instant Market Bias: Know immediately if the market is neutral, bullish, or bearish.
-
Pair Breakdown: See exact bias alignments across major pairs like EURUSD, GBPUSD, and Gold.
-
News Risk Protection: Stay ahead of high-impact events so surprise spikes never catch you off guard.
Look at the EURUSD chart above. When technicals look choppy and directionless, the indicator's neutral bias and high-confidence data explain why price is stuck. It stops you from chasing fake breakouts and losing your hard-earned capital.
Stop guessing what the market will do next. Let institutional data guide your entries.
👉 Get the indicator today: Purchase it now on the USD Strength Index MQL5 Market Page
👉 Join the community: Get free updates and setups on our USD Strength Index MQL5 Channel