
Confluence Scoring for Smart Money Setups: Turning 7 Signals Into One Number in MT5

You know the feeling. Price pulls into a zone you have been watching. You start the mental checklist: is the trend with me, is there a structure break, is this an Order Block, is there a Fair Value Gap, did liquidity get swept, are we even in a session that matters? Six questions, fired off in four seconds, half of them answered with a hopeful "close enough." Then you either freeze, or you take the trade because two of the six lined up and you wanted it to work.
That is not analysis. That is a coin flip wearing a Smart Money costume.
This post is about replacing that messy mental checklist with a single number between 0 and 100 — a confluence score — and, more importantly, about being completely transparent on how that number is built. Because a confluence score you cannot inspect is just another black box asking for your trust.
This is the third post in the series. The first covered Pending ChoCH detection — when to enter. The second covered Order Block performance stats — whether your zones have a measurable edge. This one is about how to weigh several signals at once without lying to yourself.
The Trap of "More Confluence Is Better"
If you read the previous post, you already know the punchline, and it is worth repeating because it sounds backwards: stacking more confluences does not automatically make a setup better.
The crowd treats confluence like a loyalty card. Order Block? Stamp. Fair Value Gap? Stamp. Liquidity sweep? Stamp. Session timing? Stamp. Four stamps, must be an A-plus trade. In practice, a single high-quality structure read often beats a weak zone wrapped in three decorative confluences. The market reacts to where real orders sat — not to the length of your checklist.
So why score confluence at all? Because the problem was never having multiple signals. The problem is that humans weigh them badly. Under pressure, you over-count the signals that confirm your bias and quietly ignore the ones that don't. A trend trader sees an Order Block and forgets the trend is against him. A reversal trader sees a Fair Value Gap and forgets there was never a Change of Character.
What a Confluence Score Actually Is
A confluence score is a weighted sum. You define a list of conditions, you assign each one a point value based on how much it actually matters, you add up the points that are currently true, and you cap the total at 100. That is the whole idea. The intelligence is not in the arithmetic — it is in the weights, because the weights encode what you believe drives price.
This is exactly what the CONFLUENCE meter in the MSOB Dashboard does, and rather than ask you to trust a mystery percentage, here is the exact breakdown the indicator uses on every tick:
| Condition currently true | Points added | Filter (3-Filter Method) |
|---|---|---|
| A clear trend direction is defined | +20 | Structure |
| A market structure break exists | +15 | Structure |
| A Change of Character (ChoCH) is present | +20 | Structure |
| An active Order Block aligned with the trend | +15 | Liquidity |
| An active Fair Value Gap is present | +10 | Liquidity |
| An active liquidity level is present | +10 | Liquidity |
| Price is inside a Kill Zone session | +10 | Timing |
| Three or more timeframes agree (MTF boost) | +15 | Confluence |
Add the points that are live right now, cap at 100, and that is your confluence score. No hidden neural net, no curve-fit magic constant — a transparent rulebook you can audit line by line. That transparency is the entire point: you should be able to look at the number and reconstruct exactly why it is what it is.
Read the Weights — They Tell You What Matters
Look at the table again, but this time group it. This is where the previous post and this one shake hands.
Structure carries 55 of the 100 points. Trend direction (20) plus a structure break (15) plus a Change of Character (20). More than half the entire score comes from one question: has market structure actually shifted, or are you imagining it? That is not an accident. It is the same lesson as last time — structure quality beats confluence stacking — baked directly into the math.
Liquidity adds up to 35 points. An aligned Order Block (15), a Fair Value Gap (10), an active liquidity level (10). These are the where — the zones price is drawn to. They matter, but notice they are deliberately worth less than structure. An Order Block with no structure shift behind it is a level in a vacuum.
Timing adds 10 points. Are you inside a Kill Zone — the London or New York windows where Smart Money actually moves — or are you trading the dead Asian range hoping for fireworks? Small weight, but it is the difference between a clean reaction and chop.
If you trade with the 3-Filter Method we use at TradingTips — Structure, Liquidity, Timing — you will notice the score is literally those three filters, weighted. Structure first, liquidity second, timing as the trigger window. The number is just the framework, quantified.
And the final +15 MTF boost, when three or more timeframes agree, is the tie-breaker. It is what separates a setup that looks good on your entry chart from one that looks good on the entry chart and the chart above it. We will come back to multi-timeframe alignment in the next post, because it deserves its own.
How to Read the Number
The score is colour-coded on three honest thresholds, and the thresholds are the same ones the dashboard uses internally:
| Score | Colour | What it means |
|---|---|---|
| 70–100 | Green | Multiple weighted factors aligned — this is where you look for entries in the trend direction. |
| 40–69 | Orange | Partial alignment. Something is missing — usually the structure shift or the timing. Wait, do not force it. |
| 0–39 | Red | Noise. Stand down. The market is not offering an organised picture right now. |
Used correctly, the score is a filter, not a signal. It does not tell you to buy. It tells you whether the conditions are organised enough to even start looking for an entry in your playbook. Green means "now it is worth your attention." Red means "close the chart and go for a walk."
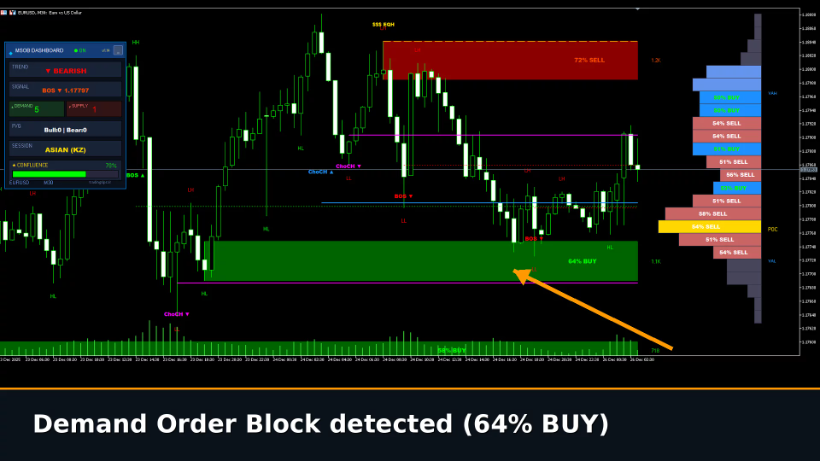
A Live Read — EURUSD at 70%
Here is the meter in context. The dashboard on the left is reading 70% confluence, and you can reconstruct that number directly from the chart:
A confluence score fixes one specific thing: it weighs every component the same way, ever 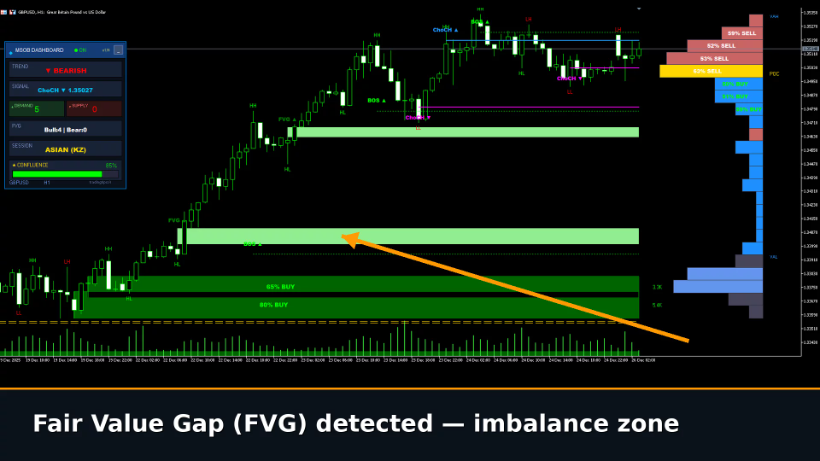 y time, in or out of a position, whether you are bored or revenge-trading. It does not make the decision for you. It removes your bias from the counting.
Walk it through with the weights above. There is a defined trend and a labelled structure break on the chart (Structure points). There is a 64% demand Order Block sitting under price, aligned with the move (Liquidity points). The FVG counter on the panel is live, and there is an active liquidity level marked at the highs (more Liquidity points). The session readout shows ASIAN, not a London or New York Kill Zone — so the timing points are not awarded. Add the live components, and you land right around 70: green, but with a visible, named reason it is not higher.
That last detail is the whole value of a transparent score. It does not just say "70." It lets you see that the missing 30 is partly timing — you are looking at a clean structural picture during a dead session. A disciplined trader reads that and waits for the London open instead of taking the trade into thin Asian liquidity.
Compare that with the second chart, where the dashboard has tagged multiple Fair Value Gaps stacked through the move:
FVGs are worth 10 points in the model — real, but modest. Three of them on the chart still only count once. That is the model quietly protecting you from the loyalty-card trap: a wall of Fair Value Gaps does not inflate the score the way a genuine Change of Character does. Imbalance is context, not a trigger.
How to Trade With It (and How Not To)
The rules write themselves once the number is on the chart:
Only hunt for entries when the score is green and pointing your way. A 75 in a bullish context is your cue to look for a long at a demand zone — not a buy button, a cue to start the entry process you already trust.
Treat orange as a "not yet." A 55 almost always means one big piece is missing. Identify which one from the breakdown — no ChoCH yet? wrong session? — and let the chart come to you or walk away. Most blown accounts are built on orange setups taken as if they were green.
Respect red completely. Below 40 there is no organised story. This is the regime where indicators print and price does the opposite. Flat is a position.
Never trade the number alone. This is the honest part. A confluence score is a weighting of conditions — it does not know about tomorrow's news, it does not size your position, and it has no opinion on whether your stop is sane. It compresses six questions into one so your brain stops cheating on the count. It does not replace the rest of your job.
Build Your Own, or Read It Off the Panel
You can absolutely build this yourself. Open a spreadsheet, list your conditions, assign weights you can defend, and score every setup by hand before you take it. Doing that exercise once is genuinely worth it — it forces you to admit, in points, what you actually believe moves price. Most traders have never written it down, which is exactly why their counting drifts with their mood.
The catch is the same one from the last post: by the time price reaches the zone, you have about four seconds, and a spreadsheet is not open. That is what the CONFLUENCE meter in the Market Structure Order Block Dashboard MT5 automates — it evaluates all eight conditions every tick and prints the weighted number and colour live, so the count is done before your bias gets a vote.
To be clear about what it is and is not: the score will not make you profitable. It is a disciplined way to weigh what is already on your chart, nothing more. The edge still comes from a verified strategy and the patience to wait for green — the dashboard just makes "wait for green" a thing you can actually see.
Wrap-Up
Smart Money trading drowns in confluence talk — everyone has a checklist, nobody agrees on what the items are worth. A confluence score cuts through it by forcing you to do the one thing the checklist crowd never does: assign weights, then live by them. Structure carries the load. Liquidity adds context. Timing pulls the trigger. One number, fully auditable, the same every time.
Write your own weights down this week, even on paper. Then compare them to the model above and ask yourself which signals you have been secretly over-counting. That single honest exercise will change how you read a chart more than another course ever will.
Related Reading
- Pending ChoCH: How to Detect Market Structure Reversals Before Confirmation — the Structure component, in depth.
- Order Block Performance Stats: How to Measure Which OBs Actually Work in MT5 — why structure quality beats confluence stacking, with a real 213-OB audit.
Tools Referenced
- Market Structure Order Block Dashboard MT5 — live confluence scoring, structure, Order Blocks, Fair Value Gaps, liquidity, Kill Zones and a multi-timeframe panel in one dashboard.
- Position Size Calculator ATR — free risk-based lot sizing companion.
Risk warning: trading leveraged instruments involves substantial risk of loss and is not suitable for all investors. A confluence score is an educational decision-support tool computed from current chart conditions; it is not a signal, not a guarantee, and not investment advice. The weights described here reflect one specific implementation and will not suit every market or style. Always verify any approach on your own data, on your own broker feed, and with your own risk parameters before committing capital.


