
Pulse Echo Indicator: Volatility-Adaptive Trend Envelope with Regime Logic for MT4 and MT5

Introduction
Most trend indicators rely on a single moving average length. A 21-period EMA tracks price reactively in choppy markets but lags badly in strong trends; a 200-period EMA captures the macro direction but misses every meaningful turn until well after it has happened. Traders end up flipping between settings as conditions change, and they almost never get the timing right. The deeper problem is that the market does not care which length a trader chose -- volatility changes constantly, and any fixed-period average is wrong by definition for at least part of the day.
Pulse Echo Indicator solves this by adapting its trend "spine" to current volatility automatically. It blends a fast 7-period EMA and a slow 34-period EMA on a per-bar basis, with the blend weight driven by the ratio of short-term to long-term return volatility. When volatility is low, the indicator weights the fast EMA more heavily, hugging price tightly. When volatility expands, the weight shifts toward the slow EMA, producing a stable spine that ignores noise. The result is a single trend line that behaves like a fast MA in calm markets and a slow MA in volatile ones, without any manual switching.
The indicator is available for both MetaTrader 4 and MetaTrader 5.
Download the indicator:
- MetaTrader 5: Pulse Echo MT5
- MetaTrader 4: Pulse Echo MT4
Built around that adaptive spine is an EWMA-variance envelope that defines bullish and bearish regime breakouts, a state machine that filters whipsaws with hysteresis-style spine cross exits, energy fills that visualize price displacement from the trend, and four independent alert conditions covering every regime transition. Every signal fires only on confirmed bar close, every historical arrow remains permanent across reloads, and the underlying math is identical bar-for-bar between the MT4 and MT5 versions.
This article explains the technical foundations of volatility-adaptive trend detection, walks through each component of the indicator, and provides a complete parameter reference so readers can configure it for their own markets and timeframes.
The Problem with Fixed-Period Trend Following
A 21 EMA on EUR/USD H1 tracks price tightly during smooth trends but turns into a whipsaw machine in tight consolidation. Lengthening the EMA reduces noise but adds lag; shortening it cuts lag but invites false signals. There is no single fixed length that is optimal across all conditions because volatility itself is the missing variable -- low-volatility regimes call for longer averaging, high-volatility regimes call for shorter, and any indicator that ignores realized volatility cannot adapt.
A volatility-adaptive blend removes the manual choice. The trader sets a fast length, a slow length, and a smoothing factor for the blend weight. The indicator measures realized volatility on every bar and computes the blend weight automatically. The output is a single line that takes its character from current market behavior, not from a parameter chosen days ago.
How Pulse Echo Builds the Adaptive Spine
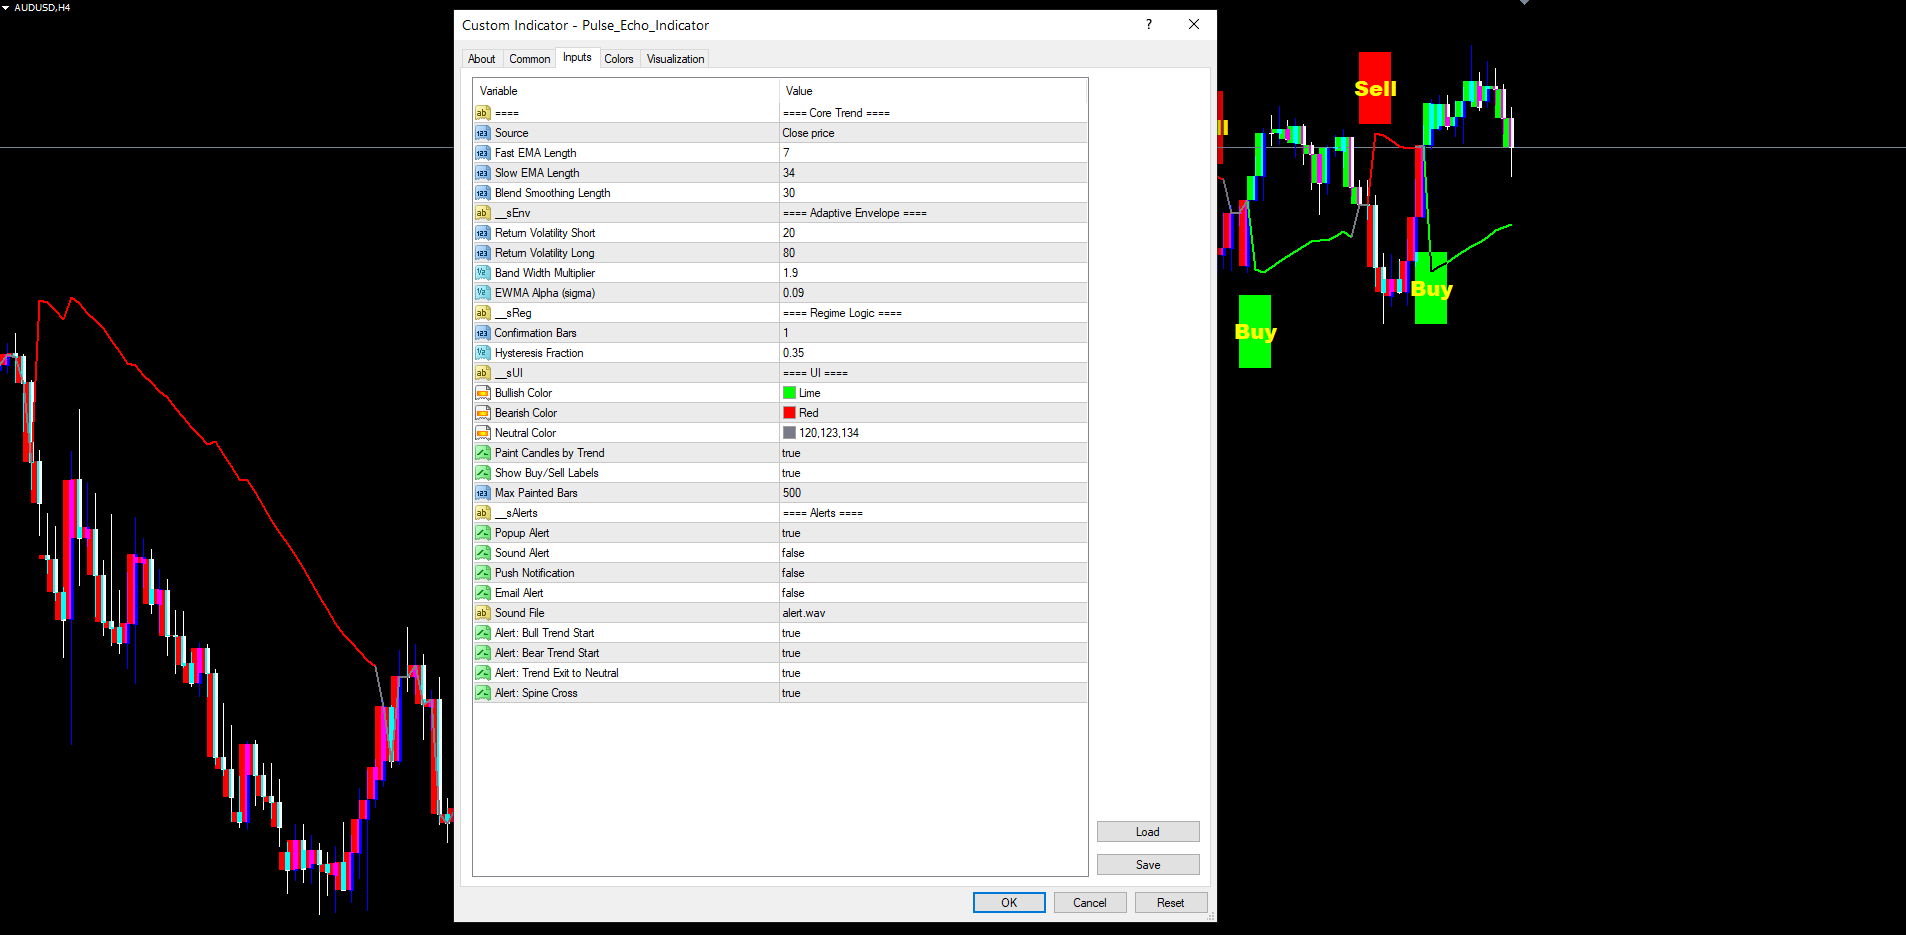
The trend spine is constructed in four stages. First, the indicator computes a fast EMA and a slow EMA of the source price, with default lengths of 7 (InpFastLen) and 34 (InpSlowLen). These are standard recursive EMAs using the formula alpha = 2 / (length + 1) , applied to whichever applied price the user selected (close by default).
Second, the indicator computes log returns of the source price and feeds them into two rolling standard-deviation calculations -- a short-term volatility window (InpRetLenS = 20 bars) and a long-term volatility window (InpRetLenL = 80 bars). These are population standard deviations, calculated bar-by-bar from the rolling window of log returns. The ratio of short-term to long-term volatility ( vr = volS / volL ) becomes the volatility regime indicator. When vr is below 0.7, current volatility is materially lower than the longer-term average and the market is in a calm regime. When vr is above 1.6, current volatility is significantly higher than usual and the market is in a high-volatility regime.
Third, the volatility ratio is mapped to a blend weight using a clamped linear function: wRaw = clamp(1 - (vr - 0.7) / 0.9, 0, 1) . This maps vr from the range [0.7, 1.6] onto a weight in [0, 1]. When volatility is low ( vr <= 0.7), the weight is 1.0, meaning the fast EMA is used exclusively. When volatility is high ( vr >= 1.6), the weight is 0, meaning the slow EMA is used exclusively. Between these two extremes, the weight scales linearly. The raw weight is then smoothed by a 30-bar EMA (InpBlendLen = 30) to prevent jitter from short-term volatility noise.
Fourth, the smoothed weight blends the fast and slow EMAs into a "raw spine" ( spineRaw = w * emaFast + (1-w) * emaSlow ), which is then itself smoothed by a final 30-bar EMA. The double-EMA smoothing produces the visible trend spine -- the green, red, or gray line on the chart that follows price across all regimes.
The result is a self-tuning trend line. In a quiet sideways market, the spine sits close to the fast EMA and reacts to price changes within a few bars. In a strong trend with elevated volatility, the spine flattens out toward the slow EMA and ignores intra-bar noise. The transitions between the two regimes are smooth because the blend weight is itself an EMA-smoothed value, so the spine never jumps abruptly when volatility shifts.
The EWMA-Variance Envelope
A trend spine alone is not enough to define regime transitions. The indicator needs to know when price has broken out of its normal range around the spine. Pulse Echo uses an exponentially-weighted moving variance of log returns to size the envelope dynamically.
The EWMA variance is computed recursively from log returns: v[i] = (1 - alpha) * v[i-1] + alpha * r[i]^2 , where alpha is the EWMA decay constant (InpEwmaAlpha = 0.09 by default). The square root of this variance is the realized volatility (sigma) at each bar. Multiplying sigma by the spine value and a band-width multiplier (InpBandMult = 1.9) gives the half-band size: band = spine * sigma * 1.9 . The upper and lower envelope levels are the spine plus and minus this band.
The choice of EWMA over a fixed-window standard deviation is deliberate. EWMA reacts to recent volatility shifts faster than a rolling standard deviation but with less weight on stale data points. With an alpha of 0.09, the half-life of past observations is about 7 bars, meaning the envelope adapts to a sudden volatility spike within a couple of bars while ignoring volatility from a week ago. This makes the envelope tighter during quiet periods and wider during volatile periods, which is exactly the right behavior for breakout detection.
The envelope width is intentionally wider than a typical Bollinger Bands setup. With a default multiplier of 1.9, price will spend roughly 95% of its time inside the envelope under a normal distribution. Breakouts beyond the envelope are statistically meaningful events that signal a structural change in price behavior, not just routine noise.
When price closes above the upper envelope, the indicator considers a bullish breakout. When it closes below the lower envelope, a bearish breakout. The confirmation count parameter (InpConfirmBars = 1) controls how many consecutive bars must satisfy the breakout condition before the regime is committed. A value of 1 means a single bar is sufficient (which is the default), but raising it to 2 or 3 produces more selective signals at the cost of slower entries.
Regime State Machine
A breakout alone does not define a complete regime model -- the indicator also needs rules for staying in a regime and rules for exiting back to neutral. Pulse Echo uses a three-state machine: bull (regime = +1), bear (regime = -1), and neutral (regime = 0).
The state machine evaluates the following rules on every bar:
- If bullConf is true (the confirmed-bars count of bullish breakouts is met), the regime is set to +1.
- Else if bearConf is true, the regime is set to -1.
- Else, if the current regime is bull and price has closed below the spine, the regime returns to 0 (neutral).
- Else, if the current regime is bear and price has closed above the spine, the regime returns to 0.
- Otherwise, the previous regime is preserved.
This logic produces a "trending until invalidated" behavior. Once a regime is established, it remains active until either the opposite extreme is breached (a clean reversal) or price crosses back to the wrong side of the spine (a soft exit). The neutral state acts as a buffer between bull and bear -- the market can move from bull to neutral, sit there for a while as price chops around the spine, and then move to either bear (on a clean breakout below the lower envelope) or back to bull (on a new breakout above the upper envelope).
This three-state design avoids the most common failure mode of two-state systems, which is forcing the indicator into one of two polar opposite states even when the market is genuinely undecided. By including a neutral state, Pulse Echo can sit out indecisive periods without producing false signals on every minor wiggle.
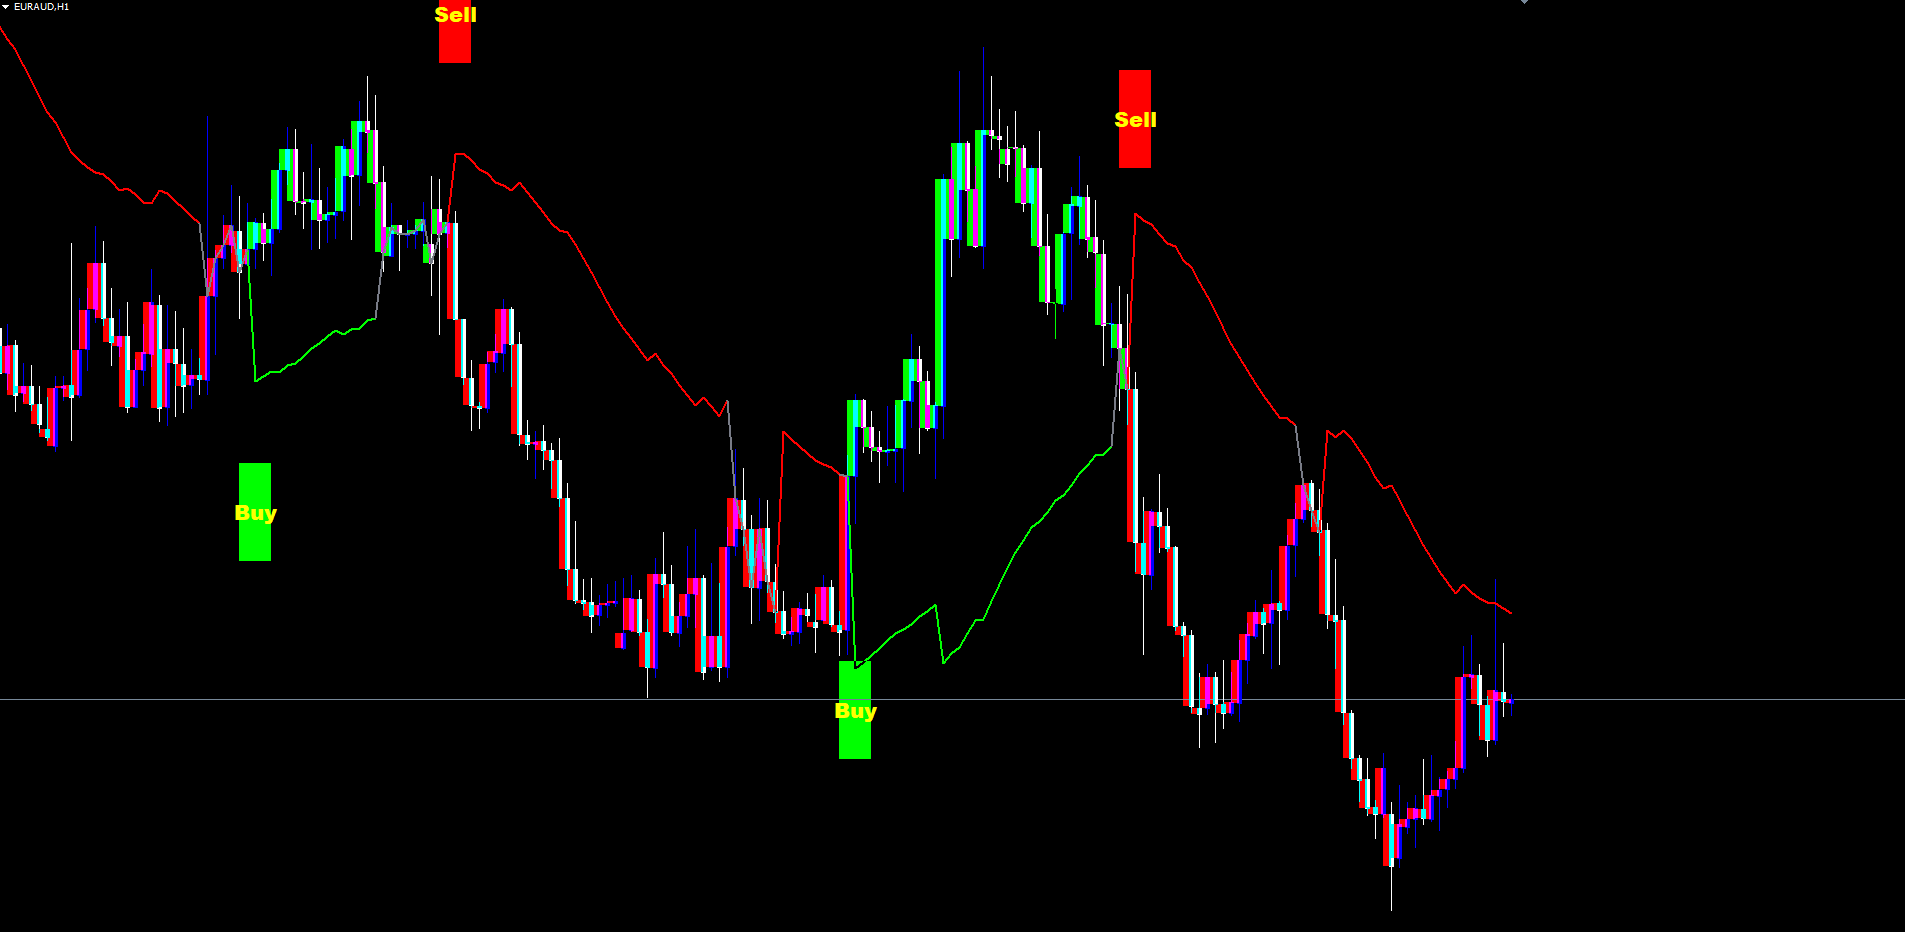
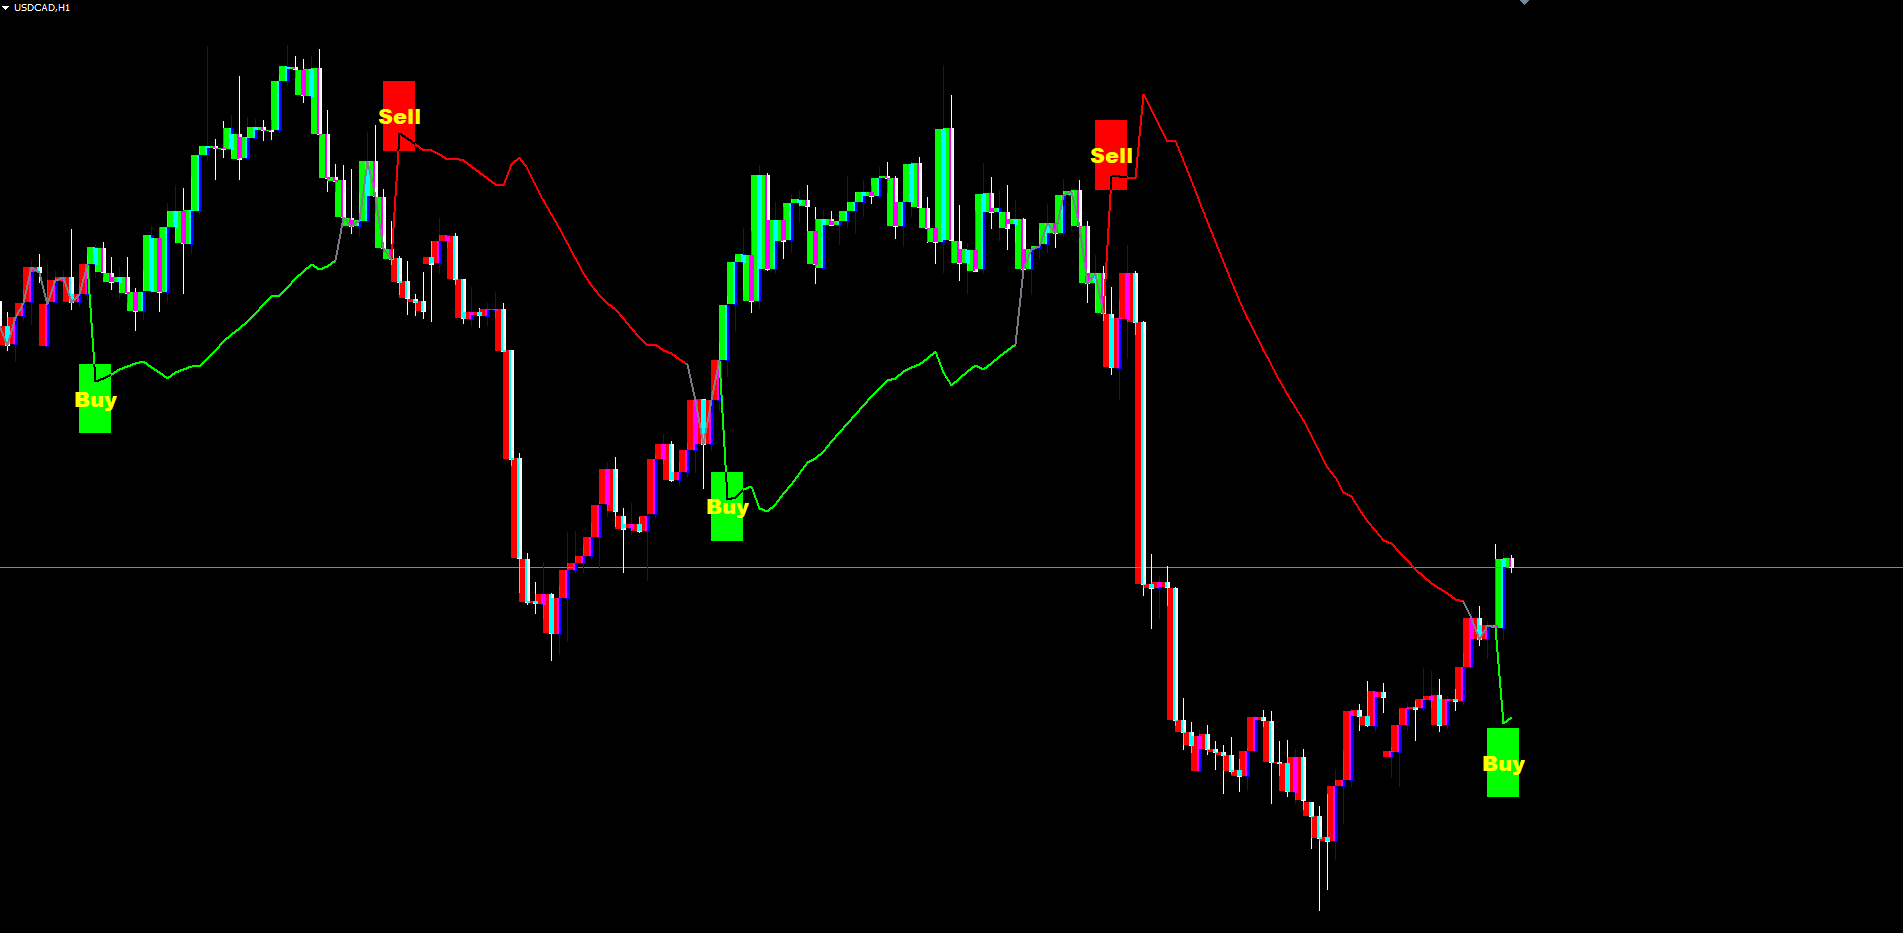
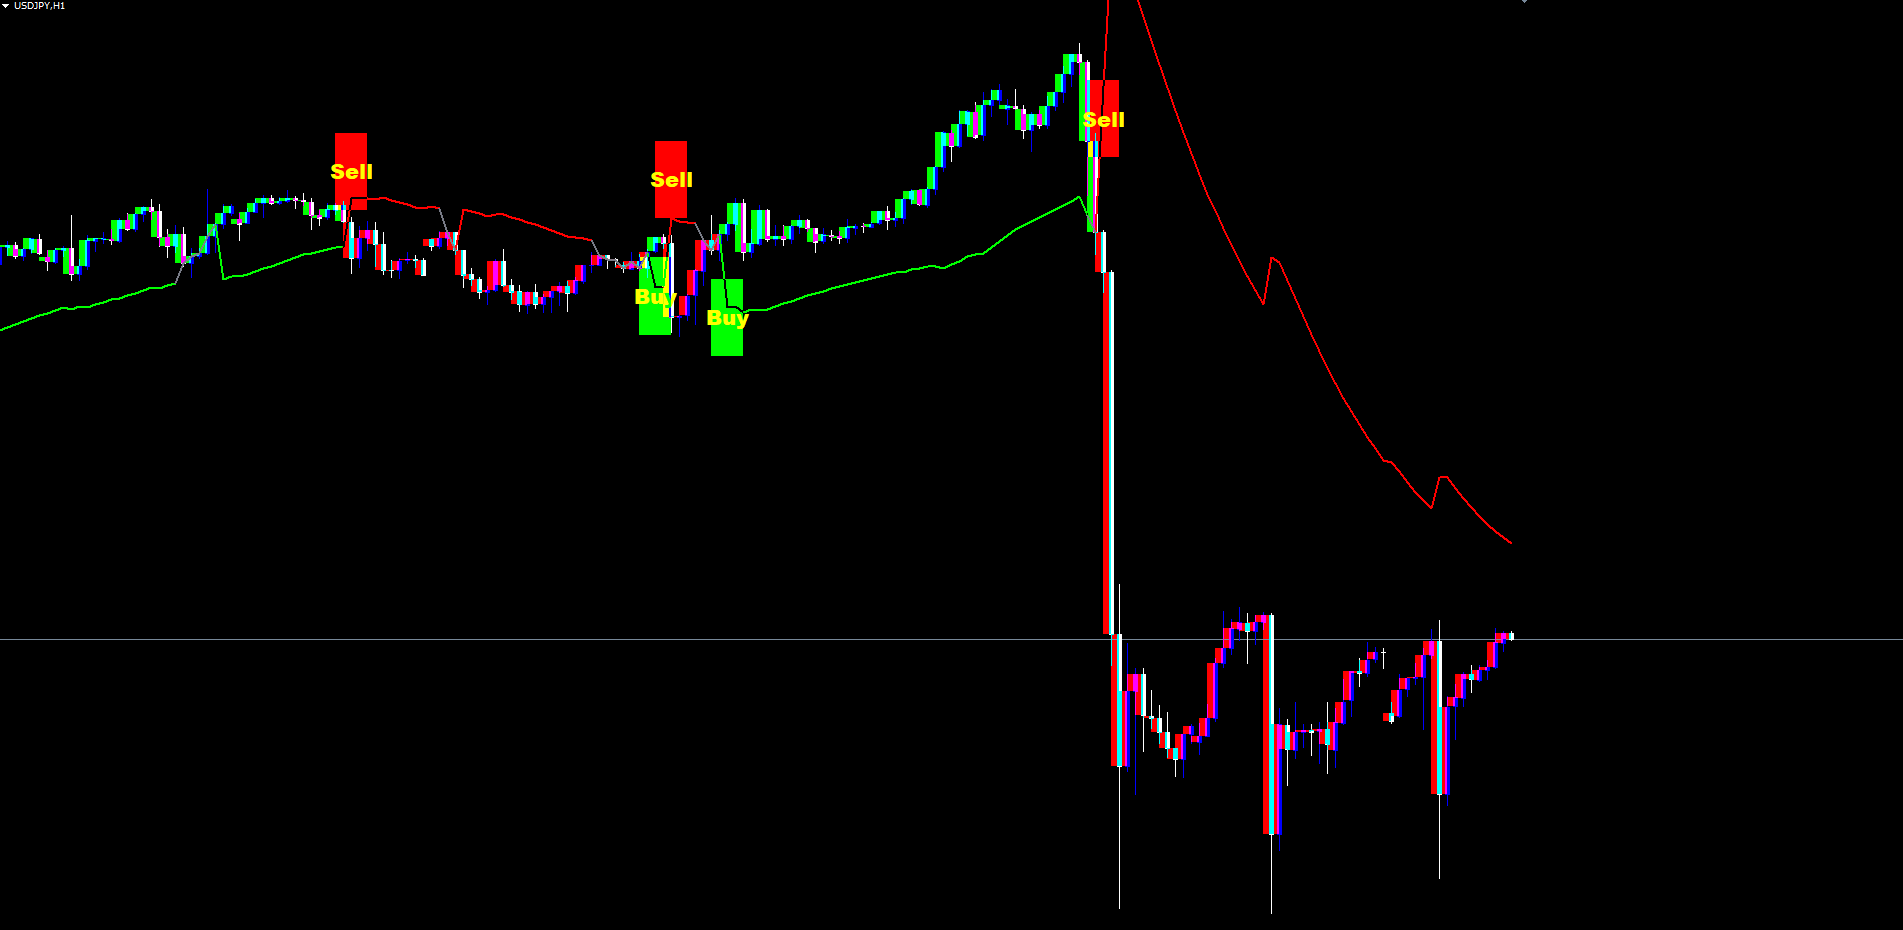
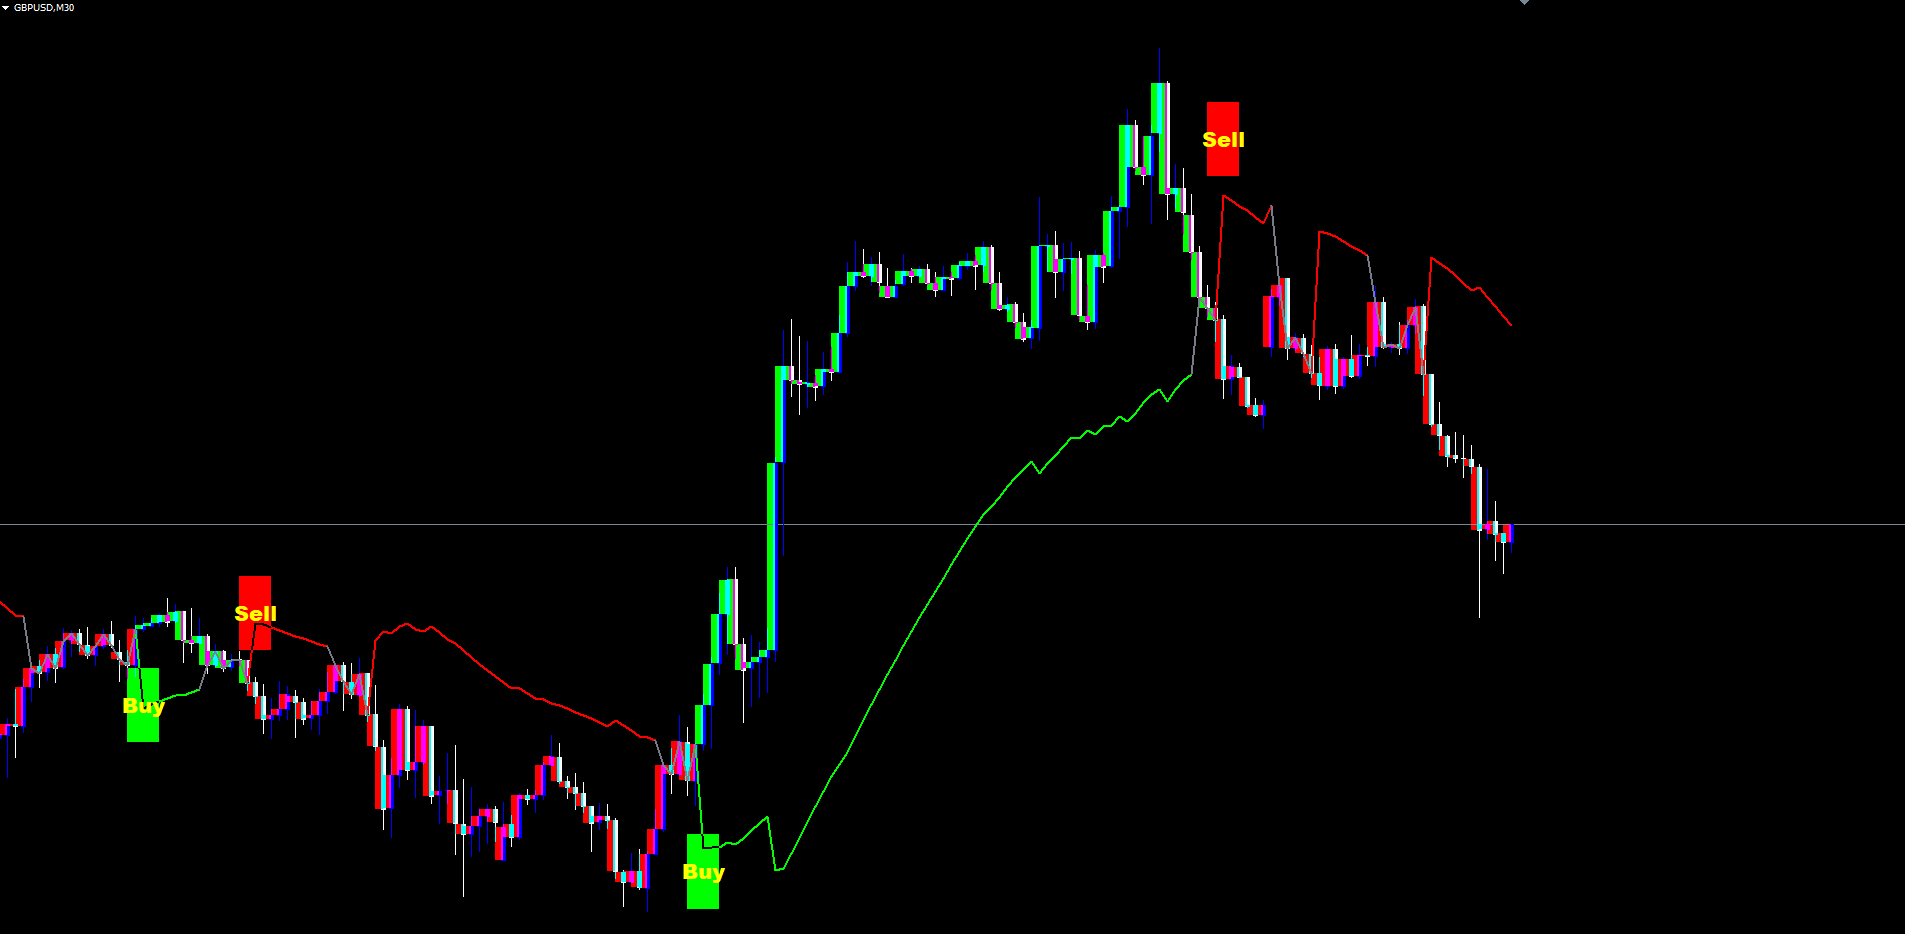
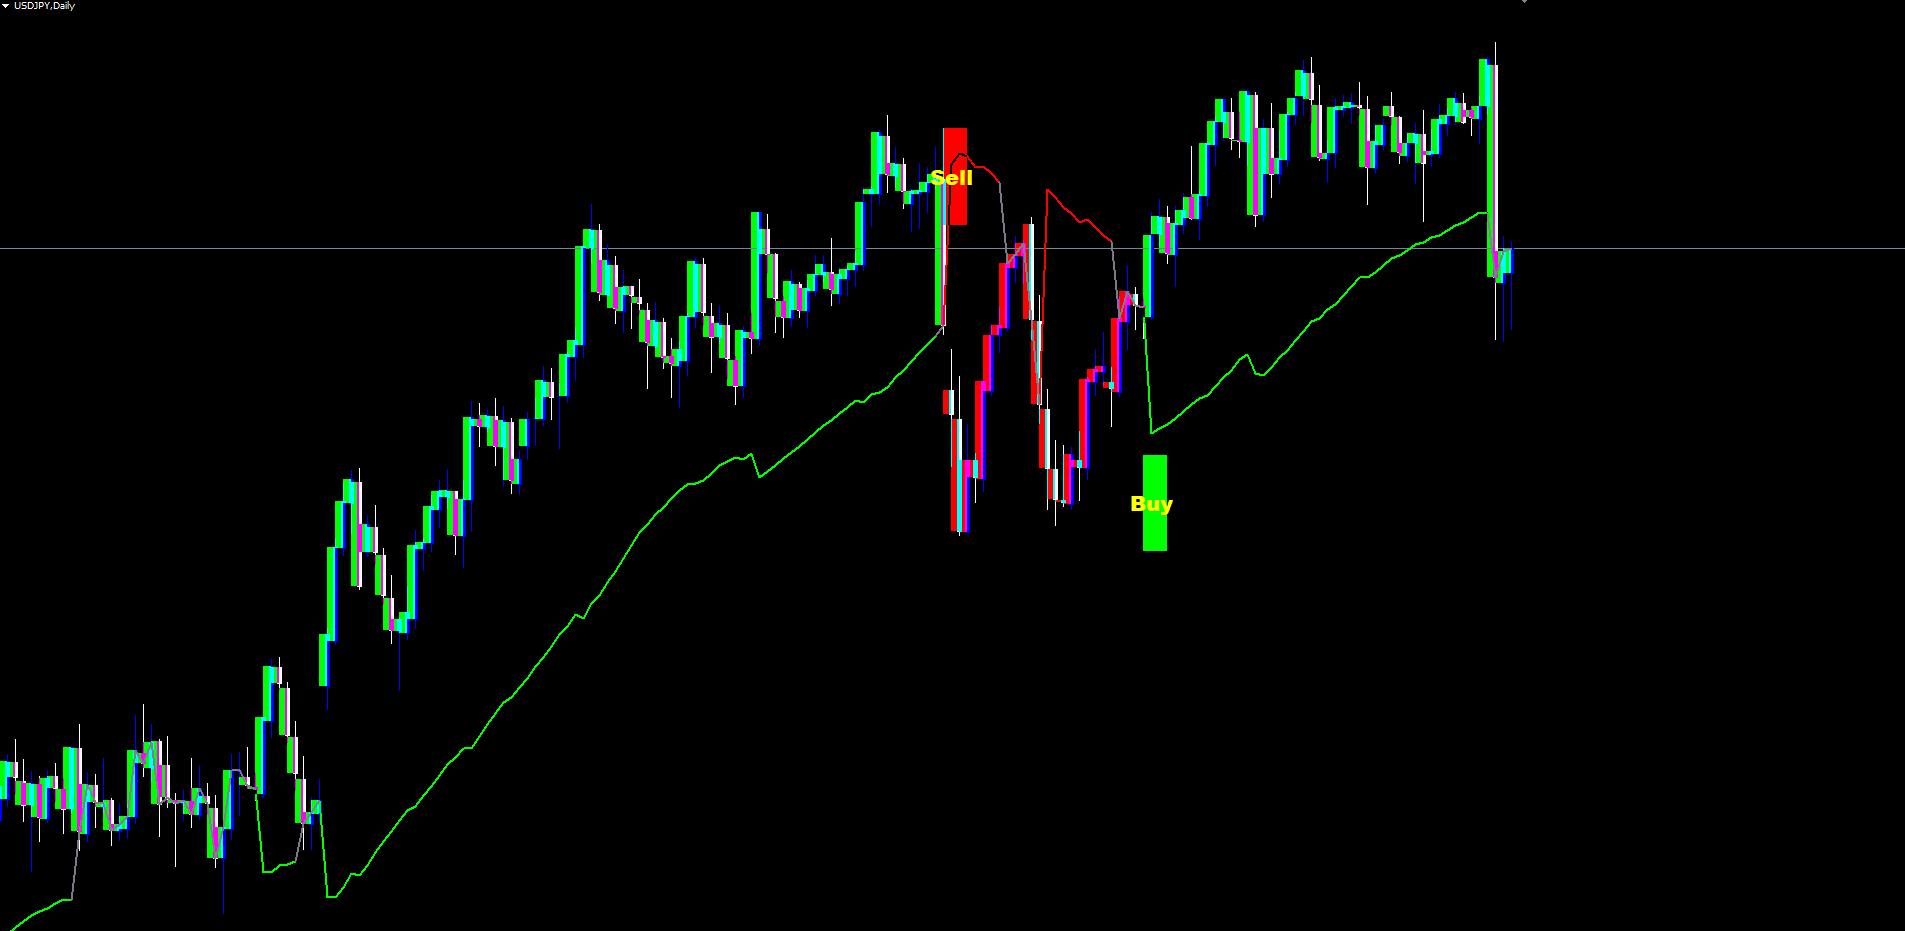
The regime is what drives the visible trend line color, the candle paint, and the buy/sell labels. When regime = 1 , the trend line is drawn in the bullish color (default lime) using the lower envelope as its anchor (since price is generally above the spine in bull regimes, the lower envelope acts as the closest reference). When regime = -1 , the line is drawn in the bearish color (default red) using the upper envelope. When regime = 0 , the line is drawn in the neutral color (default gray) at the close itself.
Trend Candle Painting and Energy Fills
Visual feedback on the chart matters as much as the underlying math. Pulse Echo paints candles, fills the area between price and the trend line, and draws a small "rim" band right around the close to make the active regime impossible to miss.
Trend Candles. When InpPaintCandles is enabled (default), each visible bar is recolored according to the current regime. The candle body is painted in the bullish color when lastSignal == 1 and the bearish color otherwise. This matches the source TradingView indicator's barcolor() rule precisely. The painting is applied to the most recent InpMaxPaintedBars bars (default 500) -- older bars retain the broker's default candle color. Limiting the painted window keeps chart performance high even on long histories.
The implementation differs slightly between MT4 and MT5 due to platform constraints. MT4 paints candles using OBJ_RECTANGLE objects per bar. MT5 uses the same approach via the indicator's OnTimer dispatch loop, which is the recommended pattern for object-based rendering in MT5 indicators. Both versions produce visually identical output.
Energy Fills. The area between the close and the trend spine's anchor (lower envelope when bull, upper envelope when bear) is filled in the regime color. When close is above the anchor, a bullish fill connects the two; when close is below, a bearish fill takes its place. The fill is dynamic -- on every tick, the live bar's fill extends to the current close, providing instant feedback about whether price is gaining or losing ground relative to the trend.
Rim Band. A thin colored band is drawn directly under the close (when bull) or over the close (when bear), sized at 6% of the 14-period ATR. This rim is the indicator's most subtle feedback mechanism. It produces a constant low-noise visual marker of the current regime, even when energy fills are minimal because price is sitting right on the spine. The rim disappears in the neutral state, signaling that the indicator has no strong directional bias.
Together these three layers -- candle paint, energy fill, and rim -- give the trader an at-a-glance read of the current regime without needing to look at any numerical output.
Non-Repainting Architecture
Repainting is the single most common defect in retail trend indicators. An indicator that evaluates breakout conditions on the live (still-forming) bar can show a buy arrow during the bar that disappears if price pulls back before the bar closes. In hindsight, every visible signal looks correct -- because every "wrong" signal vanished. Backtests built on such indicators are systematically biased toward false positives, and live trading reveals the truth: the signals shown on the chart look nothing like the signals that fire in real time.
Pulse Echo eliminates repainting through a strict closed-bar rule. Signal detection (the bull-start and bear-start conditions that drive the Buy and Sell labels) is gated to bars at shift >= 1, meaning the bar in question must have already closed. The current live bar (shift 0) carries forward the last confirmed signal state but never produces a new arrow. As a result, every Buy or Sell label printed on the chart corresponds to a closed bar that occurred at a specific timestamp -- and that label remains in place permanently across reloads, refreshes, and timeframe switches.
The trend spine, energy fill, rim, and candle paint do update on the live bar with each tick. This is correct behavior, not repainting. The live bar's close is changing in real time, so the visualizations attached to that bar must update to reflect the current price. What does not change is the historical bars -- once a bar closes, every value the indicator computed for that bar (spine value, regime, last signal, candle color, fill bounds) is locked in and will recompute identically on every subsequent reload.
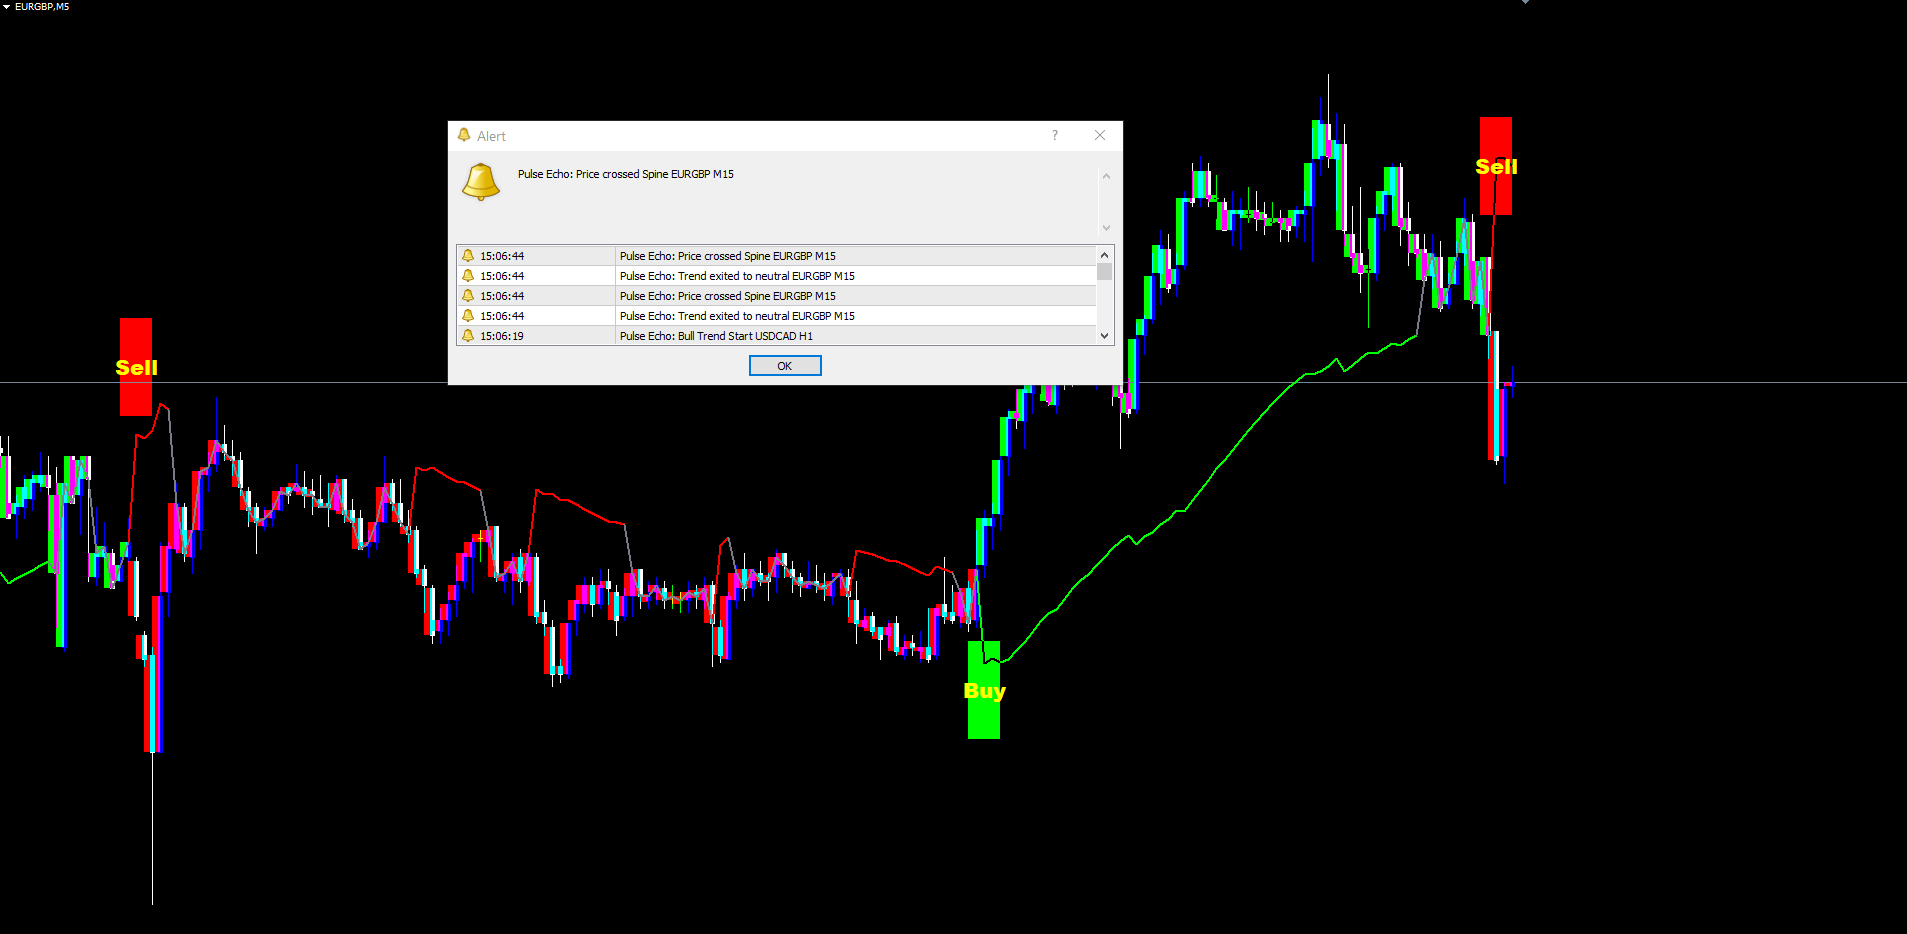
The non-repainting guarantee extends to alerts. Each alert condition (Bull Trend Start, Bear Trend Start, Trend Exit, Spine Cross) is evaluated only when a new bar closes, and a per-symbol per-timeframe time guard ensures the alert fires at most once per bar. A trader who reattaches the indicator to a chart will not be flooded with historical alerts -- only the most recently closed bar's events are eligible to fire, and only if they would have fired in the live session.
This architecture has one practical cost: signals appear at the close of the breakout bar, not at the moment price first crosses the envelope. The trader sees the Buy or Sell label on the bar that just completed. This one-bar delay is the price of integrity. Traders who have used repainting indicators understand the value of the trade -- a slightly later signal that actually exists in real time is worth far more than a perfectly-timed signal that only appears after the fact.
The Four Alert Conditions
Pulse Echo provides four independent alert conditions that cover the full lifecycle of a regime move:
1. Bull Trend Start. Fires when the regime transitions from any other state (neutral or bear) into bull (+1). This corresponds to a Buy label appearing on the chart. It is the primary entry alert for long traders.
2. Bear Trend Start. Fires when the regime transitions to bear (-1) from any other state. Corresponds to a Sell label. Primary entry alert for short traders.
3. Trend Exit (to Neutral). Fires when an existing bull or bear regime returns to neutral, typically because price crossed back through the spine without producing a confirmed reversal. This alert is useful for trade management -- a discretionary trader using Pulse Echo as a confluence tool may exit a position when the regime exits to neutral, even if no opposing signal has yet appeared.
4. Spine Cross. Fires whenever the close of a confirmed bar crosses the spine in either direction. This alert is more sensitive than the trend-start alerts and useful for traders who want to track every meaningful spine interaction. It does not necessarily indicate a regime change -- a spine cross during a strong bull regime is simply a pullback into the trend, not a reversal.
Each alert condition has its own enable toggle (InpAlertBullStart, InpAlertBearStart, InpAlertTrendExit, InpAlertSpineCross) so traders can mute the alerts they do not need.
Four delivery channels can be configured independently:
| Channel | Default | Parameter |
|---|---|---|
| Popup (on-screen dialog) | Enabled | InpAlertPopup = true |
| Sound (alert.wav) | Disabled | InpAlertSound = false |
| Push notification (mobile) | Disabled | InpAlertPush = false |
| Disabled | InpAlertEmail = false |
Each delivery channel is independent. A trader can enable all four channels for the most aggressive coverage, or just the push channel for mobile-only awareness, or none at all to suppress alerts entirely. The sound file path defaults to "alert.wav" but can be changed to any file in the MetaTrader sounds directory via the InpAlertSoundFile input.
All alerts use a single per-bar guard. If multiple alert conditions fire on the same bar (for example, a trend exit followed immediately by a new bull start), all enabled conditions produce notifications -- but the same condition will not fire twice on the same bar even if the underlying state oscillates intra-tick.
Practical Trading Workflow
Understanding each component of the indicator individually is important, but applying them in a structured workflow is what produces consistent results. The following five-step workflow describes how to use Pulse Echo in daily trading.
Step 1: Add the indicator to a chart. Open any chart in MetaTrader 4 or MetaTrader 5. Find Pulse Echo Indicator in the Navigator panel under Indicators > Market. Drag it onto the chart. The default settings (fast EMA 7, slow EMA 34, blend smoothing 30, retLenS 20, retLenL 80, band multiplier 1.9, EWMA alpha 0.09, confirm 1) are designed to work on most instruments without modification. Start with a 1-hour or 4-hour chart to see clearly defined regime transitions.
Step 2: Configure visuals. Decide whether you want trend candles painted (InpPaintCandles, default true) and Buy/Sell labels shown (InpShowSignals, default true). Adjust InpMaxPaintedBars if you want a shorter or longer painted history -- 500 is the default and works well on most monitor sizes. Customize InpLongCol and InpShortCol if your chart background calls for different bull/bear colors.
Step 3: Wait for a Buy or Sell label. The indicator continuously monitors for regime transitions. When a confirmed bar close pushes the regime into bull or bear from a different state, a colored pill with yellow "Buy" or "Sell" text appears at the bar's low (Buy) or high (Sell) extended by 2.5 ATRs. Do not anticipate signals before the bar closes -- the indicator deliberately waits for bar confirmation to ensure non-repainting integrity.
Step 4: Validate against context. Before entering a trade, check the current trend candle color (which reflects the active lastSignal direction) and the spine line color (which reflects the current regime). A Buy label appearing in a chart already painted in bullish green and with the spine in bullish color is a higher-confidence signal than one appearing during a transition phase. Look at higher-timeframe context too -- a Buy on H1 that aligns with a bullish regime on H4 carries more weight than one that does not.
Step 5: Set alerts for management. Enable push notifications (InpAlertPush = true) or email alerts (InpAlertEmail = true) for Trend Exit, so you are notified when the regime returns to neutral. This is your cue to either close the position, scale out, or move stops to break even, depending on your trade plan. The Spine Cross alert is optional -- it fires more frequently and is best suited for active intraday traders who want to track every cross.
Timeframe Considerations
The indicator adapts to any timeframe. On lower timeframes (M5, M15), the volatility windows cover shorter absolute periods, producing more frequent and shorter-lived regime transitions -- best for scalping. Medium timeframes (M30, H1, H4) produce well-spaced transitions that reflect multi-day market structure, offering the best balance for swing traders. On higher timeframes (D1, W1), transitions are infrequent but each carries significant weight; rely more on the spine cross alert for intermediate management between transitions.
Parameter Reference
All 26 input parameters are listed below, grouped by function. Default values match the source code exactly. Parameters can be modified through the indicator's Inputs tab when adding it to a chart or by right-clicking the indicator and selecting Properties.
Core Trend
| Parameter | Default | Description |
|---|---|---|
| InpSrc | PRICE_CLOSE | Applied price for all calculations (close, open, high, low, hl2, hlc3, weighted) |
| InpFastLen | 7 | Length of the fast EMA |
| InpSlowLen | 34 | Length of the slow EMA |
| InpBlendLen | 30 | Smoothing length for blend weight and final spine EMA |
Adaptive Envelope
| Parameter | Default | Description |
|---|---|---|
| InpRetLenS | 20 | Rolling window for short-term log-return volatility |
| InpRetLenL | 80 | Rolling window for long-term log-return volatility |
| InpBandMult | 1.9 | Half-width multiplier for the volatility envelope |
| InpEwmaAlpha | 0.09 | Decay constant for the EWMA variance recursion |
Regime Logic
| Parameter | Default | Description |
|---|---|---|
| InpConfirmBars | 1 | Number of consecutive breakout bars required to commit a regime change |
| InpHysteresis | 0.35 | Hysteresis fraction (declared input, mirrors source) |
UI
| Parameter | Default | Description |
|---|---|---|
| InpLongCol | clrLime | Color for bullish regime spine, candles, fills, and labels |
| InpShortCol | clrRed | Color for bearish regime |
| InpNeutralCol | C'120,123,134' | Color for neutral regime spine |
| InpPaintCandles | true | Recolor candle bodies according to the current lastSignal |
| InpShowSignals | true | Show the Buy/Sell text labels at regime transitions |
| InpMaxPaintedBars | 500 | Maximum number of recent bars whose candles are recolored |
Alerts
| Parameter | Default | Description |
|---|---|---|
| InpAlertPopup | true | Show on-screen popup dialog |
| InpAlertSound | false | Play the configured sound file |
| InpAlertPush | false | Send push notification to MetaTrader mobile |
| InpAlertEmail | false | Send email through configured SMTP |
| InpAlertSoundFile | alert.wav | Sound file to play when InpAlertSound is enabled |
| InpAlertBullStart | true | Enable Bull Trend Start alert |
| InpAlertBearStart | true | Enable Bear Trend Start alert |
| InpAlertTrendExit | true | Enable Trend Exit (to neutral) alert |
| InpAlertSpineCross | true | Enable Spine Cross alert |
Recommended Configuration Profiles
Default (balanced). Use all default values. Suitable for most Forex pairs on H1 and H4. Volatility-adaptive blend behaves naturally without tuning.
Aggressive (more signals, faster reaction). Reduce InpFastLen to 5, InpSlowLen to 21, InpBlendLen to 15. Reduce InpRetLenS to 14 and InpRetLenL to 50. The spine reacts faster and regime transitions occur sooner, at the cost of more whipsaws.
Conservative (fewer signals, higher confidence). Increase InpFastLen to 12, InpSlowLen to 50, InpBlendLen to 50. Increase InpRetLenL to 120, InpBandMult to 2.3, and InpConfirmBars to 2. Each regime transition requires more confirmation, and the envelope is wider.
High-frequency intraday (M5/M15). InpFastLen = 5, InpSlowLen = 21, InpBlendLen = 15, InpRetLenS = 10, InpRetLenL = 40. These shorter windows match the faster cadence of lower timeframes.
Cross-Platform Parity
Pulse Echo treats MT4 as the gold standard and ports MT5 mechanically from it. Every line of math is identical between the two platforms. The few unavoidable differences come from MT5's stricter API -- indicator handles for ATR, explicit ArraySetAsSeries calls, and a separate OnTimer dispatch for chart-object creation. None of these affect computed values. The spine, envelope, regime, last signal, and bar paint color match bar-for-bar between the two versions on the same symbol and timeframe. Visual output is engineered to match: both versions use OBJ_RECTANGLE primitives for the energy fills, rim, candle paint, and Buy/Sell labels, producing charts indistinguishable to the trader's eye.
Installation
Pulse Echo Indicator is distributed through the MQL5.com Market and installs automatically after purchase.
- Purchase the indicator from the MQL5.com Market product page.
- The indicator downloads and installs automatically into MetaTrader.
- Open the Navigator panel (Ctrl+N) and expand the Indicators section.
- Find Pulse Echo Indicator under Indicators > Market.
- Drag the indicator onto any chart.
- Adjust input parameters if needed, then click OK.
The indicator works on all timeframes and all instruments supported by your broker. No manual file copying is required.
For best results, allow the indicator a few moments to load its historical calculations the first time it is applied to a chart. The warmup period is approximately the slow EMA length plus the long volatility window (default 34 + 80 = 114 bars), after which the spine and envelope are fully populated and signals begin to appear.
Ensure that the chart has sufficient historical data loaded. The indicator requires at least 120 bars to produce meaningful output. If your chart shows fewer bars, scroll back to load history or increase the Max Bars in Chart setting in MetaTrader's Options menu.
The indicator uses 21 buffers in MT4 and 13 buffers in MT5 (the difference reflects MT5's chart-object rendering approach for fills). All chart objects use the prefix "PE_" and are automatically cleaned up when the indicator is removed from the chart. Object names include bar timestamps so they remain stable across reloads.
Conclusion
Pulse Echo Indicator replaces a fixed-period trend follower with a self-tuning adaptive system. It measures realized volatility on every bar and blends a fast and slow EMA to produce a single trend spine that reacts appropriately to current market conditions. The EWMA-variance envelope provides statistically meaningful breakout boundaries, and the three-state regime machine filters out indecisive periods without forcing a binary classification.
Trend candles, energy fills, and a thin rim band give traders constant visual feedback about the active regime. Buy and Sell labels appear at confirmed regime transitions in high-contrast yellow text on colored pills. Four alert conditions cover the full regime lifecycle, with four delivery channels.
The indicator is non-repainting by design. Every label and painted bar in history corresponds to a closed bar that produced the signal in real time. The MT4 and MT5 versions are mechanically derived from the same source logic and produce bar-for-bar identical signals.
All 26 input parameters are fully configurable, allowing the indicator to be tuned from aggressive intraday setups to conservative swing-trading configurations. Pulse Echo provides a structured, mathematically grounded view of trend that adapts to the market as it evolves.
Download the indicator:
- MetaTrader 5: Pulse Echo MT5
- MetaTrader 4: Pulse Echo MT4
CONTACT & SUPPORT
- Email: info@forexobroker.com
- Questions: Use the Comments section on the product page or send a private message
- Bug Reports: Please include your broker name, account type, and a screenshot
-
✅ All MQL Tools: https://www.mql5.com/en/users/forexobroker/ ✅
--------------------------------------------------------------------------------------------------------------
🏦 **Broker I use**: https://icmarkets.com/?camp=55869
🏦 **Broker For EU Traders I use 1**: https://www.ictrading.com?camp=91414
🏦 **Broker I use 2**: https://one.exnessonelink.com/boarding/sign-up/a/c_thuv62ocfq
💻 **VPS**: https://chocoping.com/processing/aff.php?aff=738
💼 **Companies I use for getting funded**:
Fundednext: https://fundednext.com/?fpr=kestutis39
The5ers: https://www.the5ers.com/?afmc=16kl
FTMO: https://trader.ftmo.com/?affiliates=nRAyOhmFRnEnFdOpdLeh
Risk Disclaimer
Trading foreign exchange and CFDs on margin carries a high level of risk and may not be suitable for all investors. You may sustain a loss exceeding your initial investment. Trend Quorum is a technical analysis tool and does not guarantee profitable trades. Past performance is not indicative of future results. The authors accept no liability for any loss arising from use of the indicator. By using Trend Quorum you acknowledge sole responsibility for your trading decisions.


")
![[XAUUSD]: Weekly Liquidity Activation Points (timings), June 22-26, 2026](https://c.mql5.com/6/1013/splash-preview-771790.png "[XAUUSD]: Weekly Liquidity Activation Points (timings), June 22-26, 2026")
")