


Contents:
- A brief description of the Murray levels
- Description of level 4
- Description of levels 3 and 5
- Description of levels 2 and 6
- Description of levels 1 and 7
- Description of levels 0 and 8
- Description of levels +1 and -1
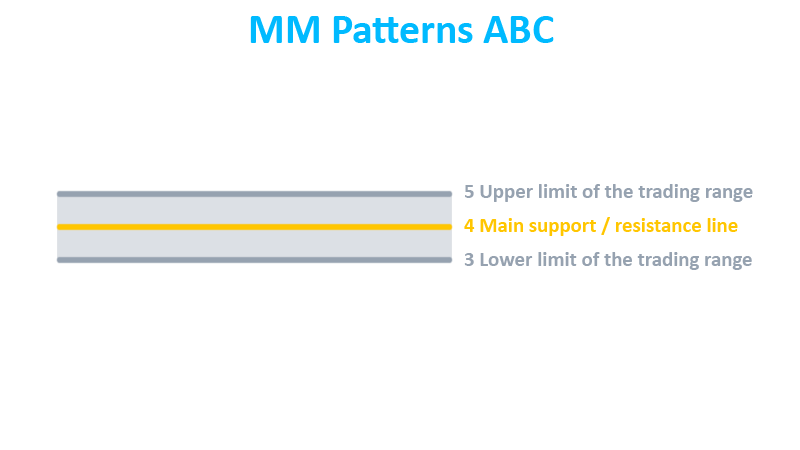
- MM Patterns ABC (universal structure)
- MM Patterns 0-3-1-4 and 8-5-7-4
- MM Patterns 0-4-1-8 and 8-4-7-0
- MM Alternative Patterns ABC with Level 4
- MM Combo Levels
- MM Combo Basic Analisys
- Technical Analisys as a Filter
* Manual with illustrations, animations and examples
A brief description of the Murray levels
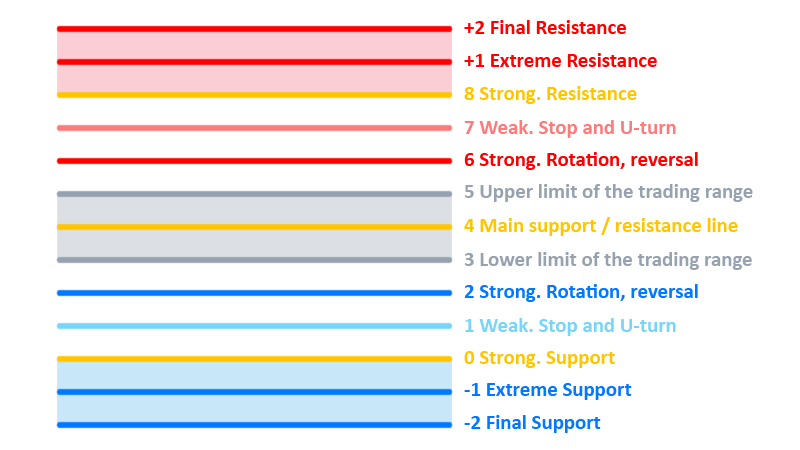
+2/8 Final Resistance
+1/8 Extreme Resistance
8/8 Strong. Resistance.
As a rule, prices do not pass this level.
7/8 Weak. Stop and U-turn
If prices move quickly and stop at this level, there will be a rapid reversal.
If the price does not stop at this level, then it goes to 8/8
6/8 Strong. Rotation, reversal
5/8 Upper limit of the trading range
The price spends about 40% of the time within the 3/8 - 5/8 range.
If the price is above this line for a long time, then it tends to stay there.
4/8 Main support / resistance line
Is the strongest in the MM system
3/8 Lower limit of the trading range
The price spends about 40% of the time within the 3/8 - 5/8 range.
If the price is below this line for a long time, then it tends to stay there.
2/8 Strong. Rotation, reversal
1/8 Weak. Stop and U-turn
If prices move quickly and stop at this level, there will be a rapid reversal.
If the price does not stop at this level, then it goes to 0/8
0/8 Strong. Support.
As a rule, prices do not pass this level.
-1/8 Extreme Support
-2/8 Final Support
Description of level 4
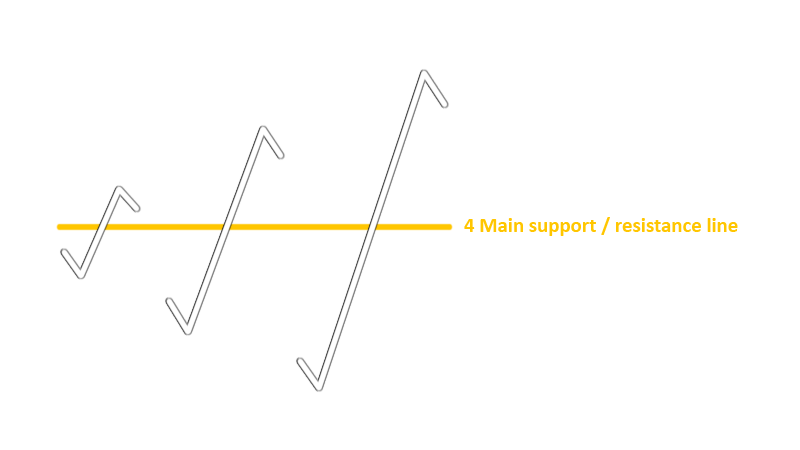
This is a very strong level. Level 4 can reverse the price. It can be used as a target.
At the same time, it can give impetus to movement. And quite often the price goes the same distance after it as before it
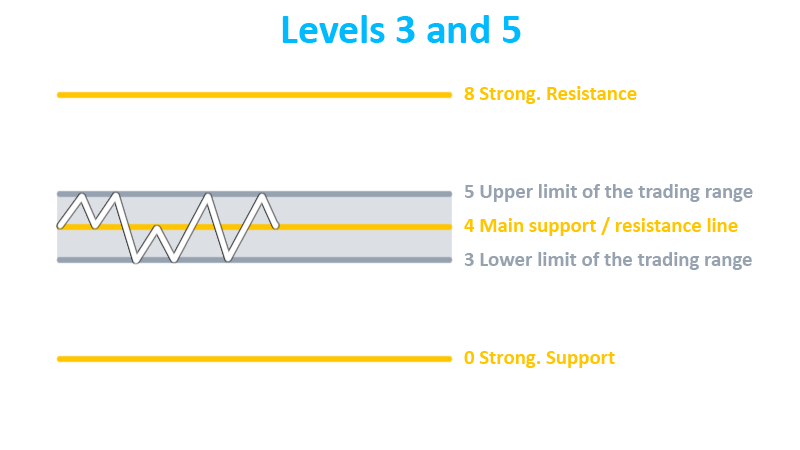
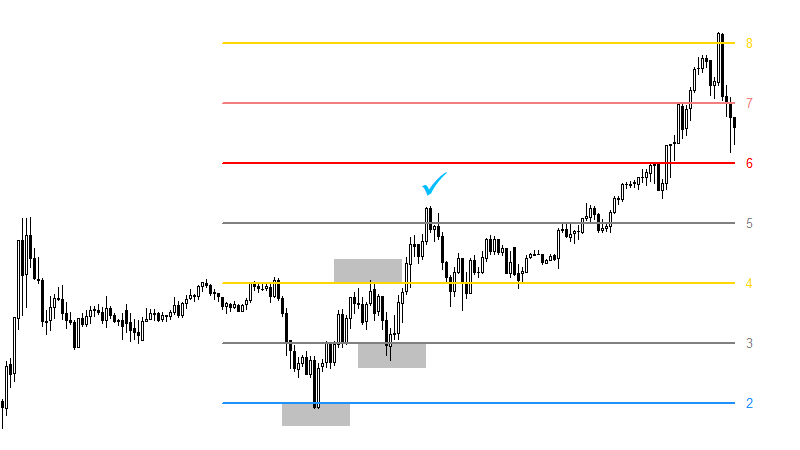
Description of levels 3 and 5

Levels 3 and 5 are weak levels, but they also have a number of important features.
They are the boundaries of the trading range, in which, as Henning Murray writes, the price arrives 43.75% of its time.
If the price is in the range for a long time, then the exit can be precipitous.
Pay attention to the global trend. If the conditions are correct, then we can trade a range breakout.

Look for a more accurate entry after the breakout and range test (retest).

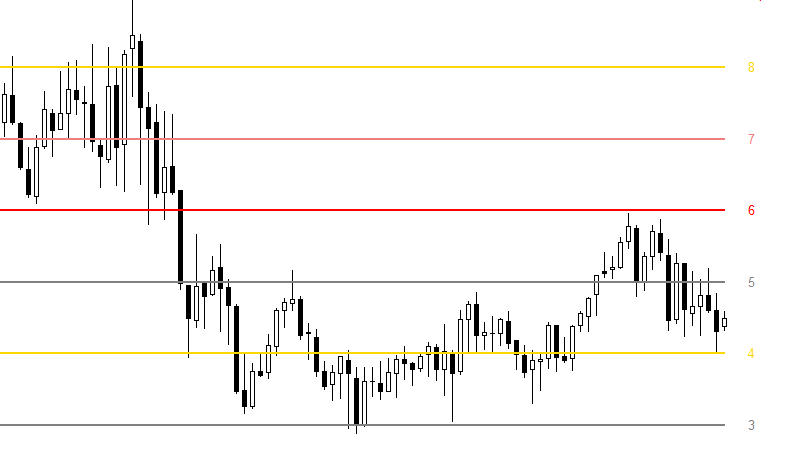
The example shows that the price has broken the range against the global trend. In this case, we cannot predict the take profit at level 8
Description of levels 2 and 6
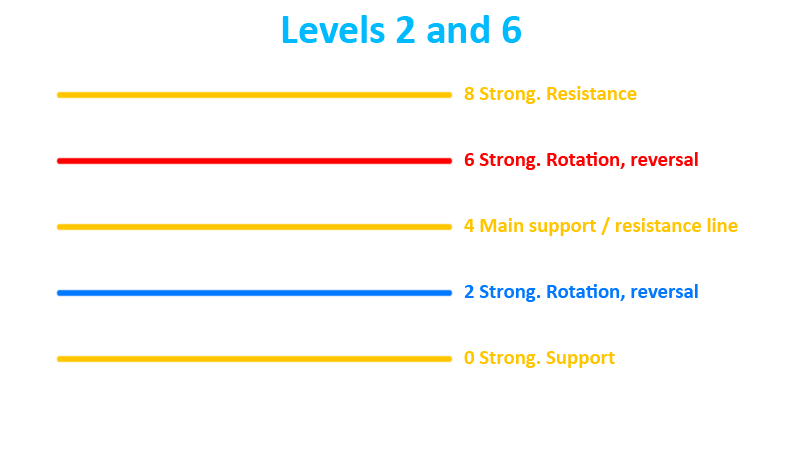
Levels 2 and 6 are strong levels, but they are inferior in their importance to levels 0, 8 and 4. They play the main role during corrections from levels 0, 8.
Please consider the following factor:
To continue the trend from 2/6, they should be level tests on the left. After these tests, the price should not cross level 4 further.

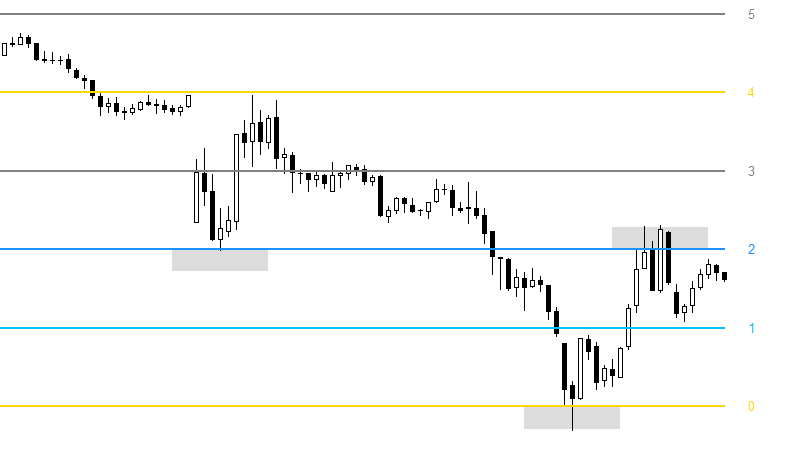
The conditions are met, it was possible to enter the sell
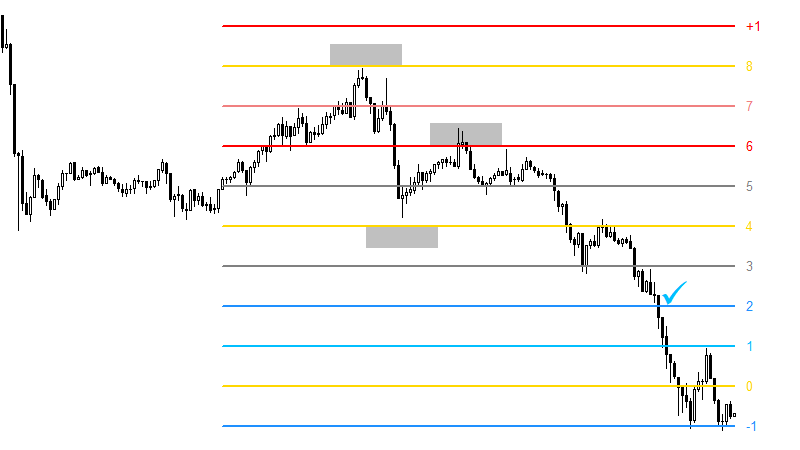
Description of levels 1 and 7
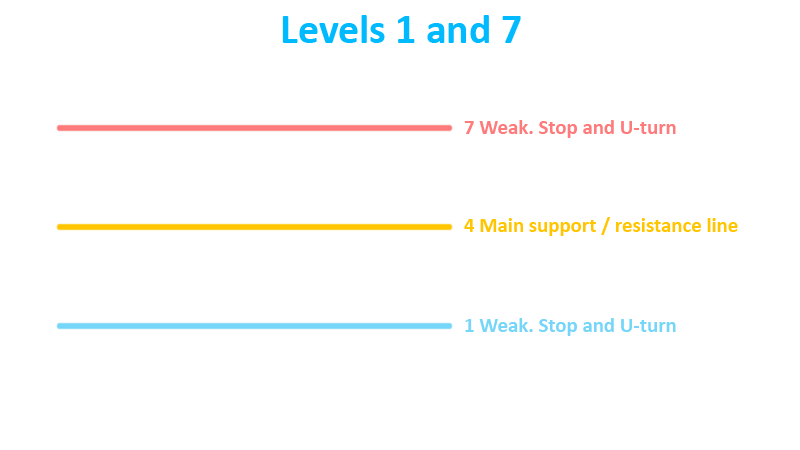
Levels 1 and 7 are weak. However, you can use some patterns for trading.
If the price does not break through and tests the level, then there is a possibility of a correction of the movement at level 4.

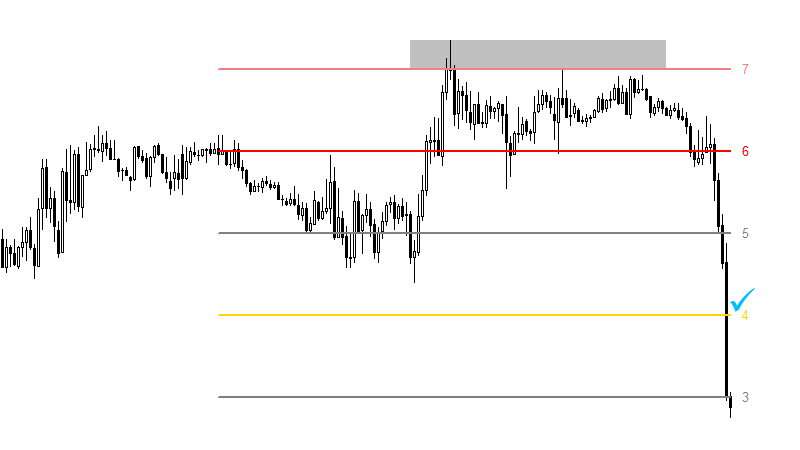
Trade example. Consolidation is visible below level 7. Our trading target is level 4.

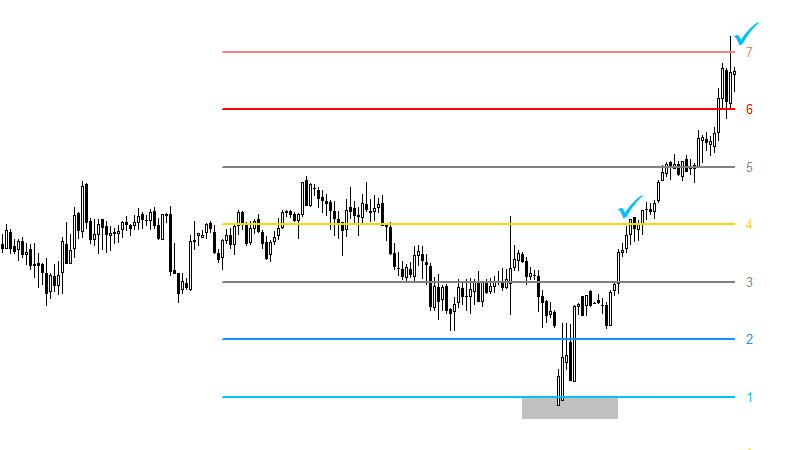
In this example, you can see that the price approached level 1 with an impulse and also rebounded with an impulse.
Here we see that we have not only reached level 4, but also reached the opposite level 7.
Description of levels 0 and 8
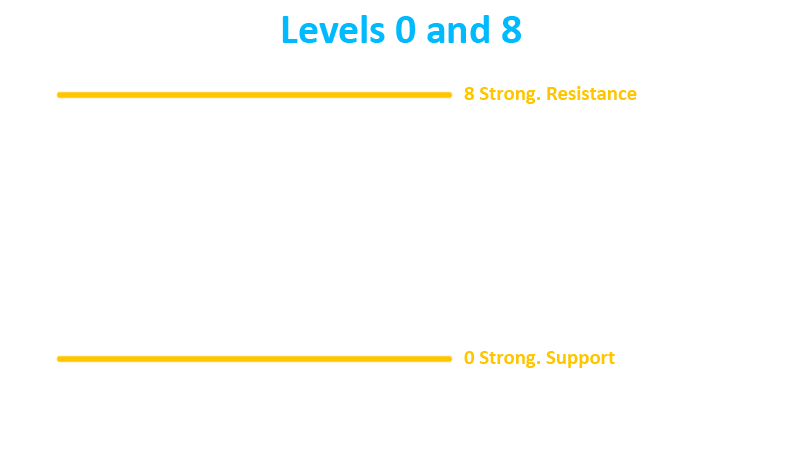
Levels 0 and 8 are a serious obstacle for the price. At least from them, the correction can begin.
You should be careful not to trade against the trend at the first touch. Wait for the level test or consolidation on it.
The best trades that come from the trend level test. The coincidence of levels on different timeframes strengthens the signal.


Example 1. Downward trend. Two touches of level 8. Good trade

Example 2. The trend is down, but at the same time it is flat. Two touches of level 8. Good trade with a small take profit in 2 level steps.

Example 3. An impulse breaks through the level. We stand against the trend. We do not trade. And we don't go to the next level. We skip this trade
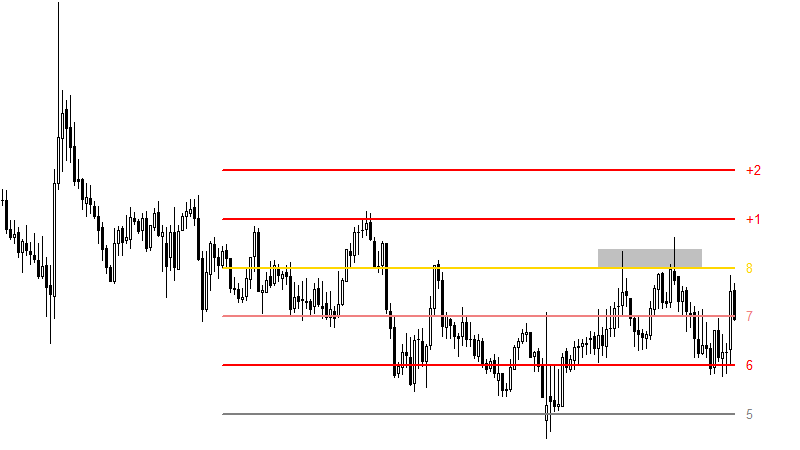
Description of levels +1 and -1
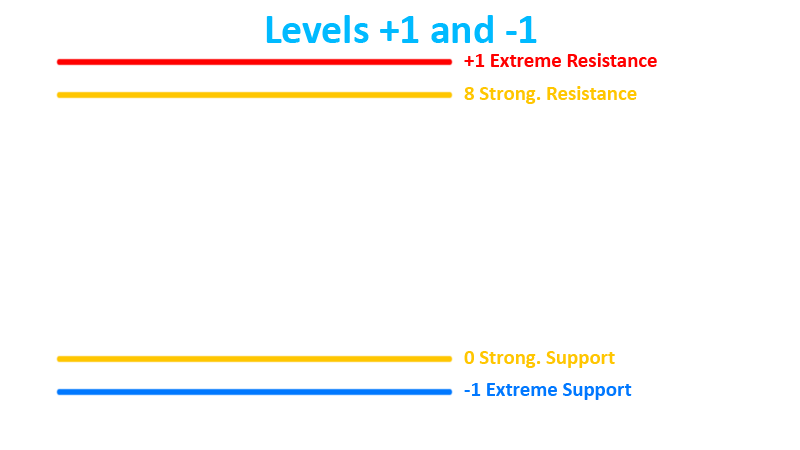
Levels +1 and -1 can be used both for a reversal and for continuation of movement. It all depends on the context of the market.
If level 8 is broken, then after the +1 test, as a rule, there will be a correction to this level 8. After that, the trend continues.
The breakout should be in the direction of the trend. If the price is in the range or in the channel, then reversal trading is in priority.

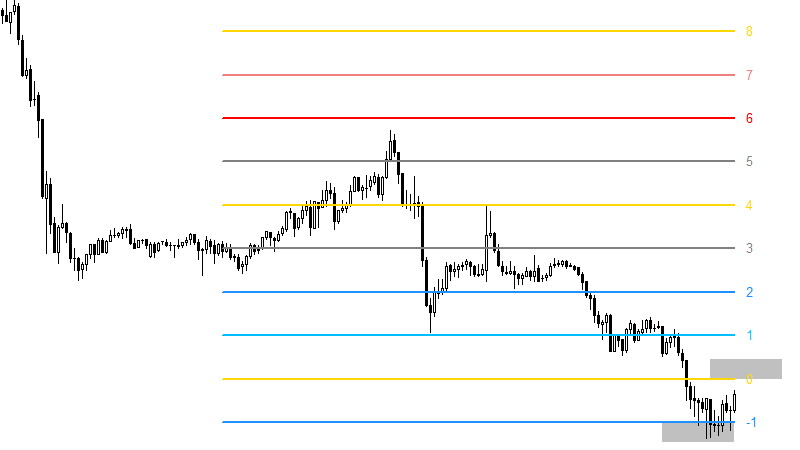
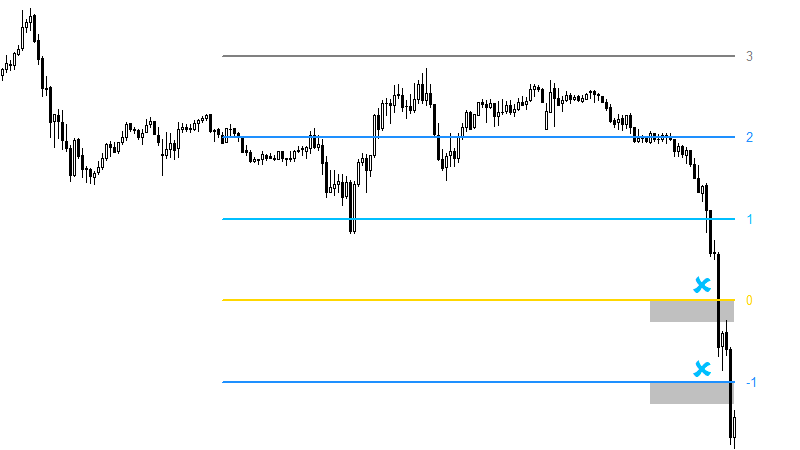
Example 1. Downward trend. If there is resistance at level 8, then we consider selling.

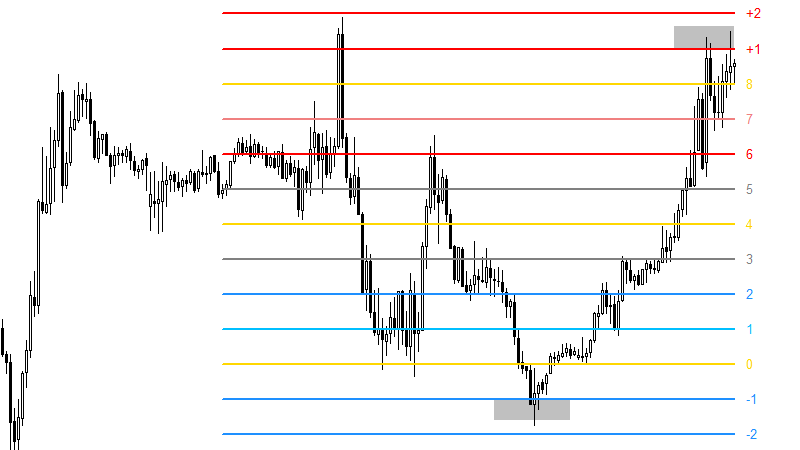
Example 2. Situation below. When a rollback from level -1 to 0, a breakdown occurred. Fixing at level 0 and entering the buy.
The situation is at the top. All conditions for sell. Stoploss per level +2

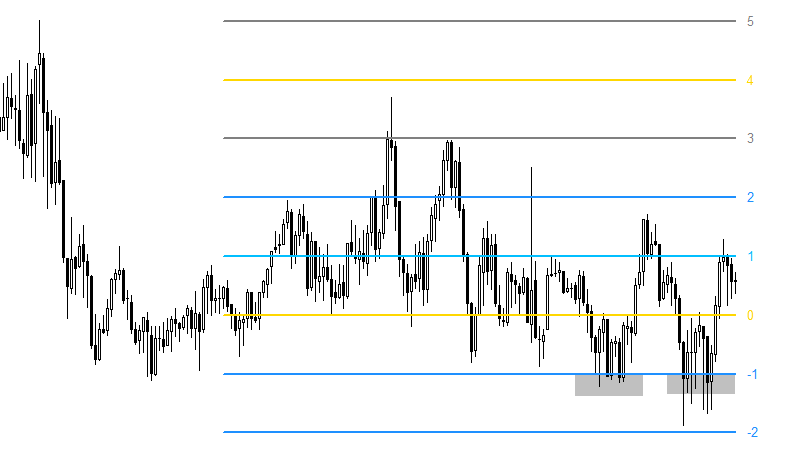
Example 3. The market is flat. Two entries with a small take-profit in 2 level steps.
MM Patterns ABC (universal structure)
If we have formed ABC and B at the border of channel 3-5, then we set take profit at level 4
But if our coordinate B is at the main level 4, then we assume that the price will move at a distance equal to C-4. To be on the safe side, set take profit 1 step less.
Sometimes it is worth adjusting the entry and exit depending on the channel boundaries. Trending trades are preferred.
At point C, we conduct a candlestick analysis. It could be an engulfing candlestick or a large shadow. Or we are waiting for the fixation at the next level.
MM Patterns 0-3-1-4 and 8-5-7-4
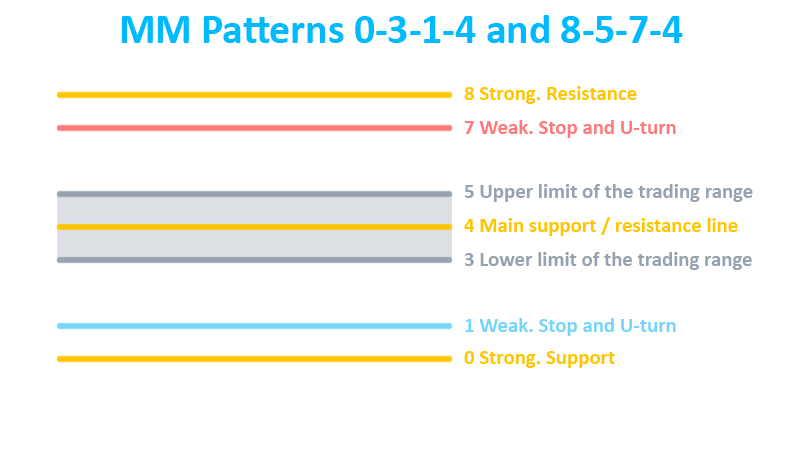
The patterns 0-3-1-4 and 8-5-7-4 are great and quite common.
For a more accurate and confident entry, you should wait until the next level after the ABC is fixed.

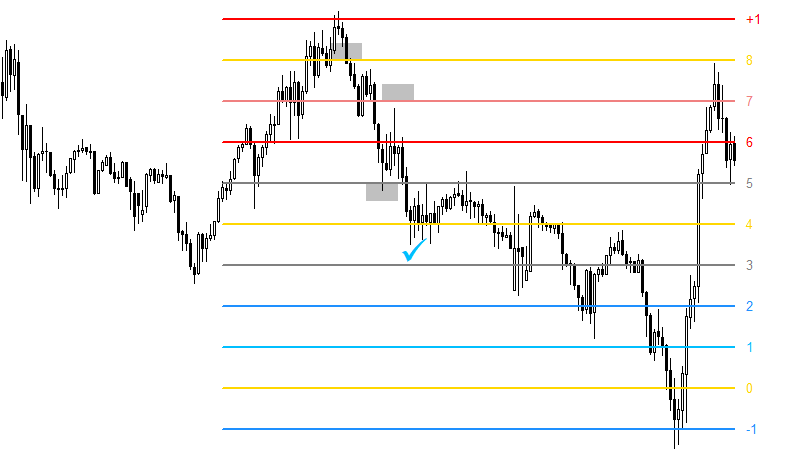
Example 1. The pattern is rather compact. The presence of a candlestick with a large shadow near level 7 can be considered an entry.

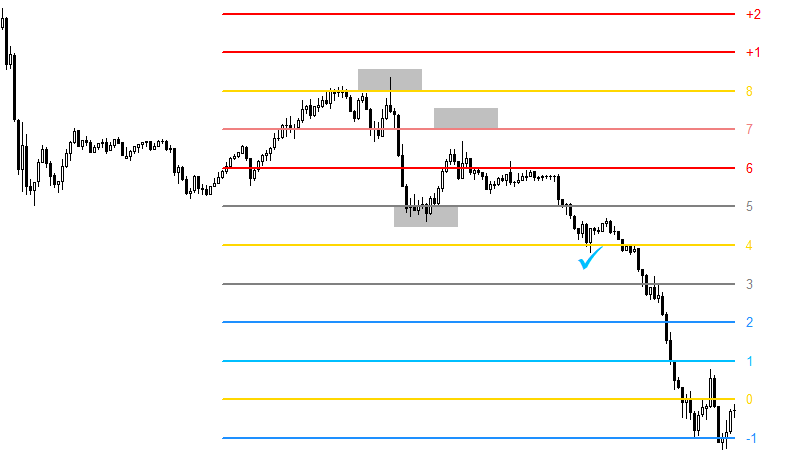
Example 2. Level 8 with testing already tells us about the possibility of entering the sell.
After the price has consolidated below level 6, we make a decision to enter.

Example 3. The situation is similar to the previous one. Entry at level 2 after its test.
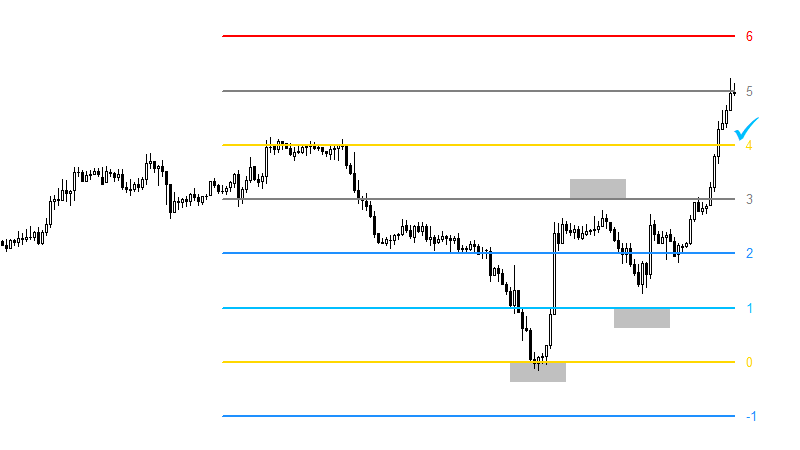
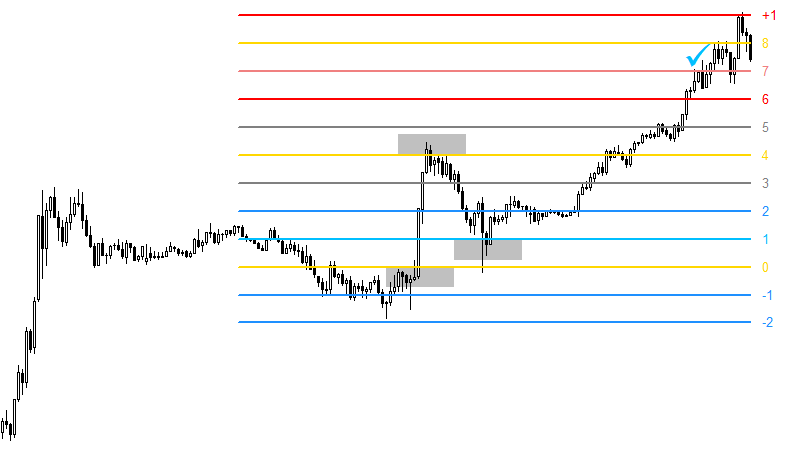
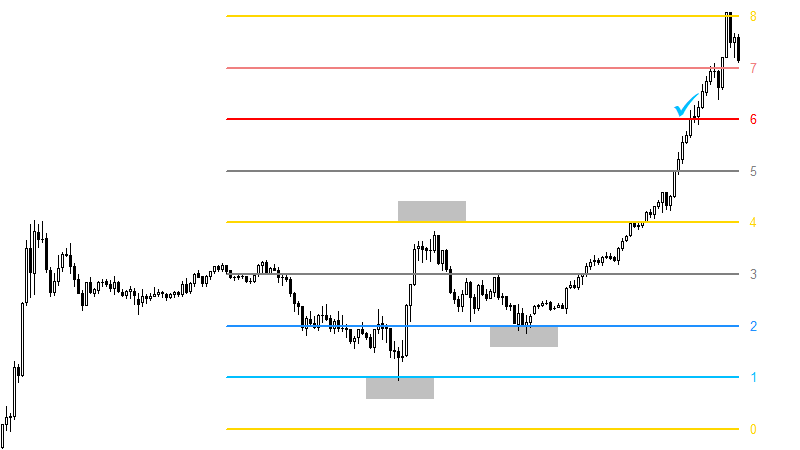
MM Patterns 0-4-1-8 and 8-4-7-0
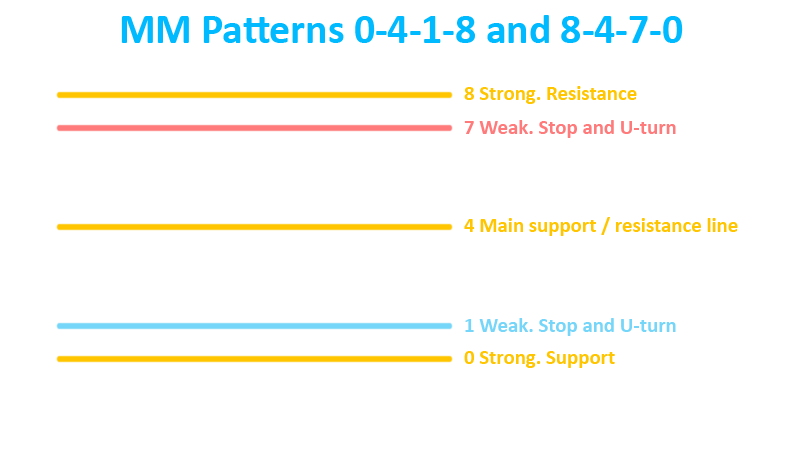
This pattern has an excellent risk ratio. This is one of my favorite patterns.
Make sure B (4) is outside the price range / channel. As always, it is preferable to form the pattern along the trend.
It is better to set take profit 1 level step before the end of the pattern.


Example 1. The pattern formed quickly. The second test of level 1 can cast doubt on the correctness of the pattern.
But the further test above level 2 already looks promising. And I would enter exactly at level 2, after breaking the trend line on the test.

Example 2. We have a good trend. And on a candle with a long shadow, we can already enter.
MM Alternative Patterns ABC with Level 4
Example 1. The trend is up. Point B is at level 4, which tends to mirror the price. Point C at level 2 means take profit at level 6.

Example 2. The trend is up. Point B is at level 4, which tends to mirror the price. Point C at level 3 means take profit at level 5.

Example 3. Downward trend. Point B is at level 4, which tends to mirror the price. Point C is at level 6, so take profit is at level 2.
The situation is similar to example 1. Only points A differ, but the result is the same.
MM Combo Levels
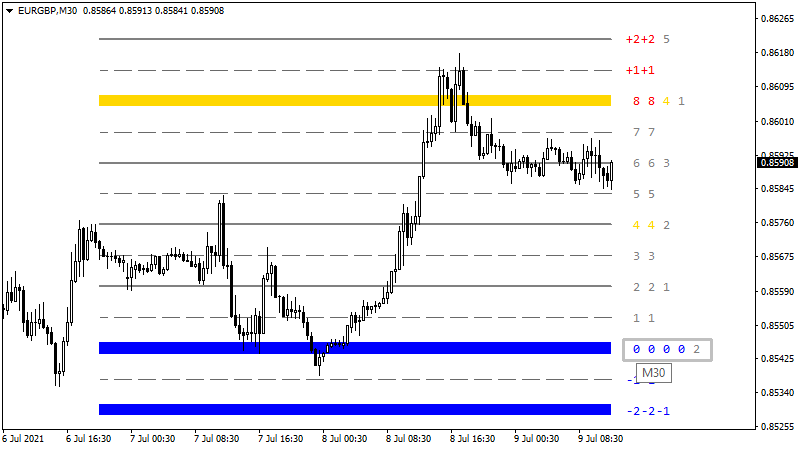
Now that we know which levels are strong, then we can mark these levels with color if they are summed up from different timeframes.
If there are three or more strong levels in one, then we display such a level in color and bold.
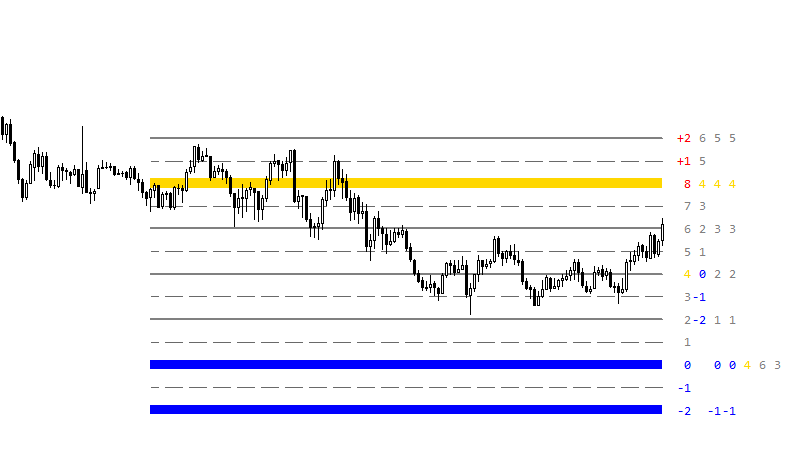
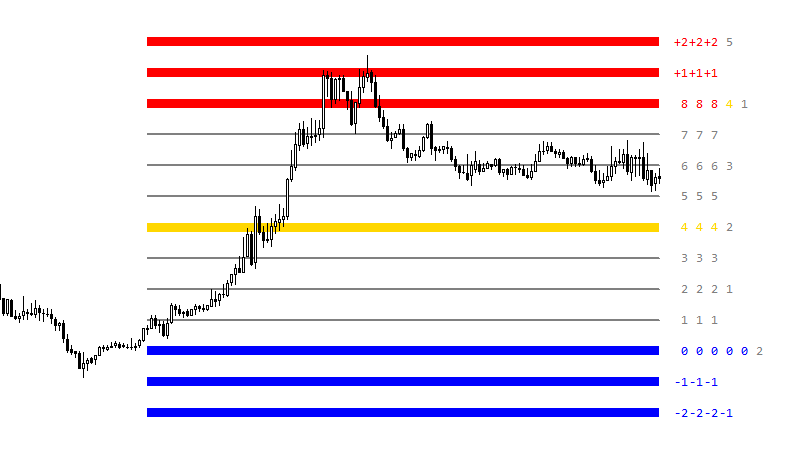
Yellow levels - any combination of three or more strong supports + resistances.
Red levels - coincidence from three or more strong resistances.
Blue levels - coincidence from three or more strong supports.

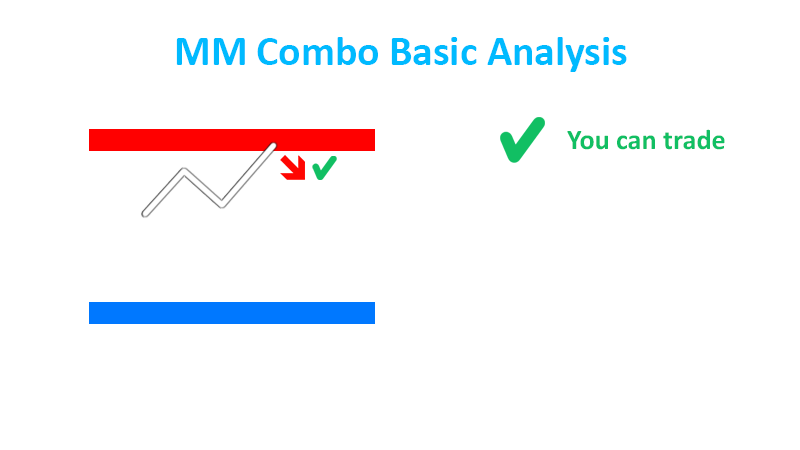
To trade only by combo levels, you need to know their features:
1. They magnetize the price
2. Rebound is more reliable when there is an opposite untested combo

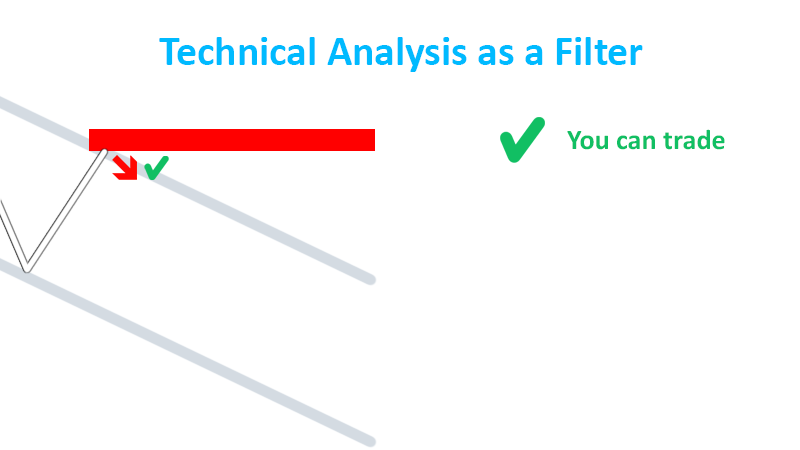
I advise you to pay attention to channels and trend lines that may affect our trade.

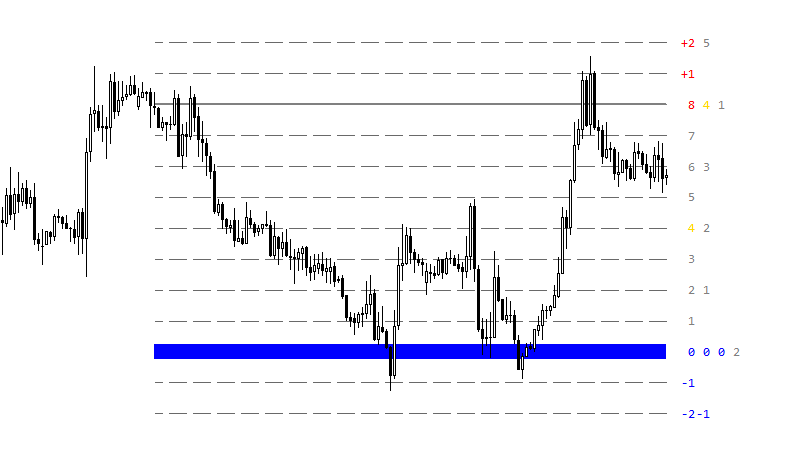
Example 1. Market in flat. Although there is no opposite combo, technical analysis allows us to enter trades on the test of the level.

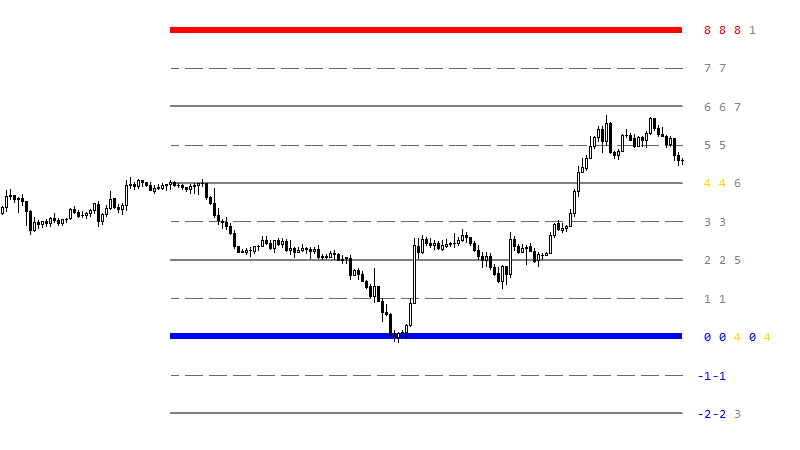
Example 2. We see the opposite combo and it has not been tested. Probably a good deal.

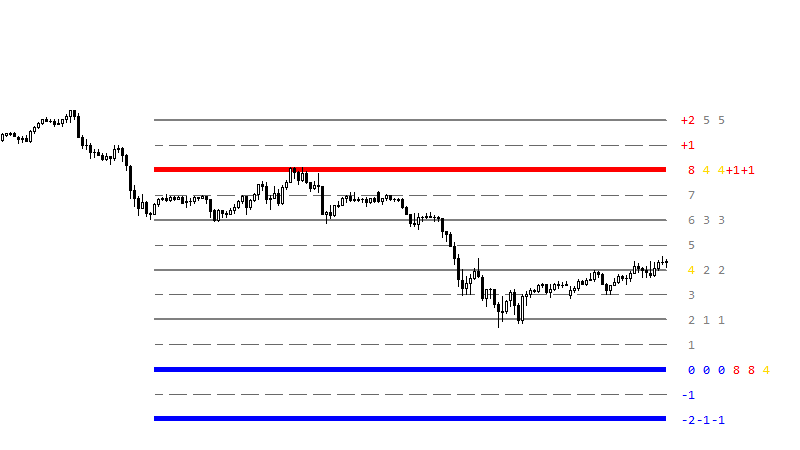
Example 3. We see the opposite combo and it has not been tested. And yet we have a 100% trend entry. Super.

Example 4. We have the opposite combo. The price did not reach him. We're trending down, let's look for Sell.

Example 5. We are at the bottom, we have an opposite combo on the trend. We enter the buy.
We ignore the yellow level along the way. In such situations, he often breaks through with an impulse.

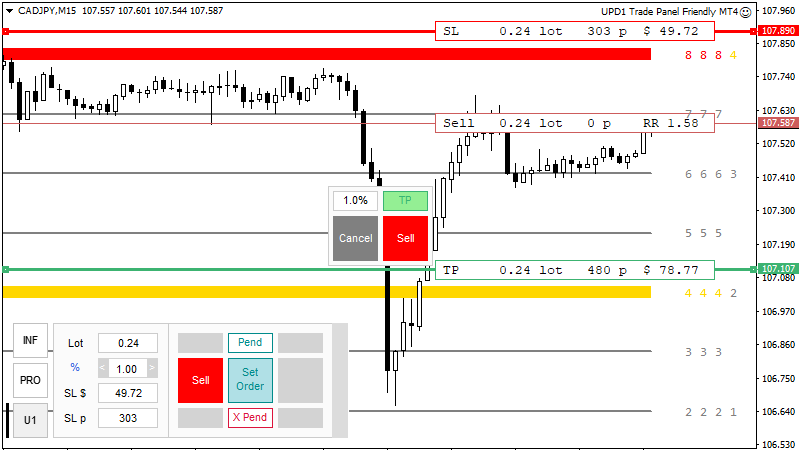
Control risks using the utility UPD1 Trade Panel Friendly MT4


")
")
