
Mastering XAUUSD Daily: What Smart Traders Are Watching Today, March 3,2026

“Discipline means accepting small losses to avoid big ones.”
We'll examine what the chart actually conveys today, including where buyers and sellers are active, which levels are crucial, and how momentum is shifting in real time.
Before we begin, I would like to share with you the best ways to use MQL4 and MQL5 to transform your trading strategies into extremely profitable machines. In order to teach traders how to construct MT4 and MT5 trading algorithms from the bottom up, I have created basic instructions.
📘LEARN HOW TO DEVELOP THE PERFECT TRADING ALGORITHM FOR MT4
📘LEARN HOW TO DEVELOP THE PERFECT TRADING ALGORITHM FOR MT5
A powerful system/ trader assistant tool designed to enhance analysis, improve timing, and give traders a structured approach to market execution.
Market Overview
Gold (XAUUSD) is displaying extraordinary strength on March 3, 2026, currently trading at approximately $5,299.03 per ounce, representing a remarkable 85.31% year-over-year gain. The precious metal has surged dramatically following a major geopolitical escalation over the weekend, with prices climbing above $5,350 earlier in the session after joint US and Israeli strikes on Iran resulted in the death of the country's Supreme Leader Ayatollah Ali Khamenei.
Today's trading has been characterized by extreme volatility, with prices opening at $5,277.90 and reaching as high as $5,393.34. According to current market analysis, gold gained more than 1% on Monday and rose above $5,350 per ounce, the highest level in over a month, driven by intensified demand for safe-haven assets.
Critical Geopolitical Developments
The current price surge is directly linked to a dramatic escalation in Middle Eastern tensions. Joint US and Israeli strikes on Iran over the weekend resulted in the death of the country's Supreme Leader Ayatollah Ali Khamenei, with the conflict having already significantly disrupted maritime traffic in the oil-rich Persian Gulf region.
In response, Iran launched strikes against US-linked facilities in several countries across the region, including the UAE, Bahrain, Kuwait, Qatar, Saudi Arabia, Jordan, Iraq, and Syria. This escalation has heightened fears of a broader regional conflict and created unprecedented safe-haven demand for gold.
The impact extends beyond gold markets. The Iranian rial collapsed to a record low near 1,749,500 per US dollar — roughly 30% weaker than levels seen at the start of January 2026 — highlighting the broader financial fallout of the conflict.
Key Price Levels (March 3, 2026):
- Current Price: $5,299.03
- Opening Price: $5,277.90
- Today's Range: $5,277.90 - $5,393.34
- All-Time High: $5,595.46 (January 29, 2026)
- 52-Week Range: $2,855.63 - $5,595.46
- Year-to-Date Change: +85.31%
- Distance from ATH: Only 5.3% below all-time high
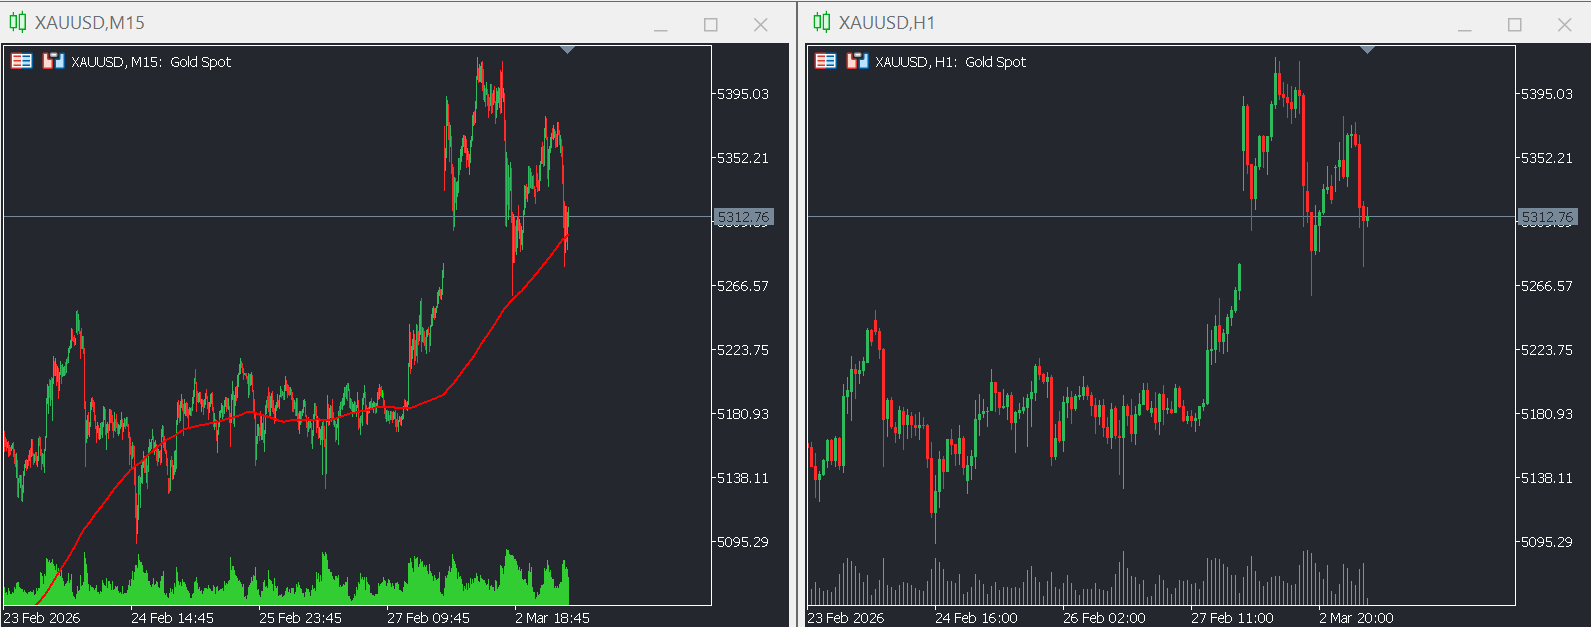
H1 Timeframe Analysis: The Intermediate Picture
Market Structure & Crisis-Driven Rally
On the hourly (H1) chart, XAUUSD is displaying classic safe-haven rally characteristics following the geopolitical shock. The price action shows powerful momentum with vertical price spikes, gap-ups, and strong volume confirmation.
H1 Bias: Strongly Bullish (Geopolitical Premium)
The market structure has shifted into crisis mode. Gold has broken decisively above the previous consolidation range and is now trading in uncharted territory for the past month. The price action demonstrates:
- Explosive upside gaps at market open
- Strong bullish engulfing candles
- Volume surge confirming panic buying
- Break above all major resistance levels
- Minimal retracements during the rally
According to technical analysis, on March 3, 2026, the price of XAU/USD may continue rising, with the gold (XAUUSD) outlook being favourable.
Alternative Scenario & Risk Levels
While the primary trend is bullish, analysts have identified potential reversal zones. The alternative scenario suggests opening short positions on increased volume below the $5,320.89 level, with price targets at $5,266.41, $5,208.41, $5,153.72, $5,107.72, $5,052.87, $4,996.26, $4,937.88, $4,881.57, $4,821.84, $4,760.74, and $4,701.55, with a Stop Loss at $5,343.61.
This bearish scenario would only activate if:
- Geopolitical tensions de-escalate rapidly
- Profit-taking overwhelms new buying
- Technical indicators reach extreme overbought levels
- Volume confirms distribution rather than accumulation
Technical Indicators on H1
RSI (Relative Strength Index): The RSI has likely spiked into extreme overbought territory (above 80), reflecting the panic-driven buying. In crisis situations like this:
- Extreme RSI readings can persist for extended periods
- Traditional overbought signals are less reliable
- RSI divergence would be needed to signal reversal
- Only a drop below 70 would suggest cooling momentum
MACD (Moving Average Convergence Divergence): MACD is showing explosive bullish momentum:
- Histogram bars expanding rapidly
- MACD line crossing well above signal line
- Both lines in strongly positive territory
- No signs of bearish divergence yet
The key will be watching for:
- MACD reaching extreme levels and rolling over
- Histogram bars beginning to shrink
- Potential bearish crossover as signal of exhaustion
Volume Analysis: Volume characteristics are critical in understanding this move:
- Significantly elevated volume on the spike higher
- Buying volume exceeding selling volume by wide margin
- No significant profit-taking pressure yet
- Institutional and retail both participating
Bollinger Bands: Bollinger Bands are likely showing:
- Price trading at or beyond upper band
- Bands expanding rapidly (increased volatility)
- Multiple closes outside bands (strong trend)
- Width expansion indicating trend acceleration
Key Support and Resistance Levels (H1)
Immediate Resistance:
- $5,343.61: Critical resistance (Stop Loss level for shorts)
- $5,390: Target mentioned in forecasts
- $5,400 - $5,450: Psychological resistance zone
- $5,500: Major round number
- $5,595.46: All-time high (January 29, 2026)
Critical Support Zones:
- $5,320.89: First support (alternative scenario trigger)
- $5,266.41: Secondary support
- $5,208.41: Important support level
- $5,153.72: Major support zone
- $5,107.72: Key support from previous rally
- $5,052.87: Strong support level
- $5,000: Psychological support (critical)
Chart Patterns & Price Action
Gap-Up Opening: The market opened with a significant gap, reflecting weekend news digestion:
- Gap demonstrates market shock and urgency
- Unfilled gaps often become support levels
- May remain unfilled if crisis escalates further
- Watch for gap-fill attempts during any consolidation
Impulse Wave Structure: The current move shows characteristics of an impulse wave:
- Strong, nearly vertical price action
- Limited retracements or consolidation
- High momentum readings
- Clear directional bias
This suggests we're in the early-to-middle stages of a crisis-driven rally rather than the exhaustion phase.
M15 Timeframe Analysis: Precision Trading in Volatile Markets
Intraday Extreme Volatility
On the 15-minute (M15) chart, the price action reveals the intense intraday battle as markets process the geopolitical shock. The M15 timeframe shows rapid price swings, making precise entry and exit timing critical.
M15 Bias: Bullish with High Volatility
The M15 chart characteristics include:
- Rapid price spikes on news flow
- Brief consolidation periods quickly bought
- Support forming at previous resistance
- Widening range as volatility expands
- Fast-moving averages all pointing higher
M15 Technical Setup
Smart Money Concepts (SMC) Analysis:
In crisis conditions, traditional SMC analysis becomes more challenging but remains useful:
Supply Zones (Order Blocks):
- $5,360 - $5,380: Fresh supply zone (today's high area)
- $5,400 - $5,450: Major supply zone
- $5,500 - $5,550: Significant supply before ATH
- $5,595: All-time high supply
Demand Zones:
- $5,280 - $5,300: Current consolidation zone
- $5,250 - $5,270: Immediate demand
- $5,200 - $5,230: Strong demand zone
- $5,150 - $5,180: Major demand area
- $5,100 - $5,130: Critical demand support
Fair Value Gaps (FVG): The rapid rally has created multiple FVGs:
- Gap around $5,280-$5,300 (partially filled)
- Gap around $5,320-$5,340 (unfilled - potential pullback target)
- Gap around $5,360-$5,375 (fresh - being created)
These gaps may act as support on any retracements if the rally continues.
M15 Momentum Indicators
RSI on M15: M15 RSI likely showing:
- Oscillating between 70-85 (extreme overbought)
- Brief dips to 60-65 on minor pullbacks
- Staying elevated rather than cooling
- Positive divergence would support continuation
Stochastic Oscillator: Stochastic readings indicate:
- Pinned in overbought zone
- %K and %D lines both near 100
- Multiple overbought crossovers
- Would need sustained move below 80 to signal cooling
Moving Average Alignment: All moving averages showing perfect bullish alignment:
- Price above 5 EMA > 10 EMA > 20 EMA > 50 EMA
- EMAs fanning out dramatically (strong trend)
- Large gaps between EMAs (trend strength)
- No signs of MA convergence (no trend exhaustion yet)
M15 Key Levels for Intraday Trading
Micro Resistance:
- $5,310 - $5,320: Immediate resistance
- $5,343.61: Critical level (stop for shorts)
- $5,360 - $5,380: Intraday high area
- $5,390 - $5,400: Next target zone
Micro Support:
- $5,285 - $5,295: Immediate support
- $5,270 - $5,280: Near-term support
- $5,250 - $5,260: Minor support
- $5,230 - $5,240: FVG support
- $5,200 - $5,210: Major intraday support
M15 Trading Opportunities
Scenario 1: Continuation Breakout (Probability: 50%)
- Setup: Price consolidates briefly then breaks above $5,343
- Entry: $5,345-$5,360 (on breakout with volume)
- Targets:
- Target 1: $5,390 (risk-reward 2:1)
- Target 2: $5,450 (risk-reward 4:1)
- Target 3: $5,500 (risk-reward 6:1)
- Stop Loss: $5,310 (below consolidation)
- Rationale: Riding momentum in crisis-driven rally
- Warning: Wide stops required due to volatility
Scenario 2: Consolidation Range Trading (Probability: 30%)
- Setup: Price consolidates in $5,260-$5,340 range
- Buy: $5,265-$5,280 (at support with confirmation)
- Sell: $5,330-$5,345 (at resistance)
- Targets: 40-60 pip moves
- Stops: 35-45 pips outside range
- Rationale: Market digests news before next move
- Note: Exit all positions if range breaks decisively
Scenario 3: Pullback Buy (Probability: 40%)
- Setup: Profit-taking drives price to $5,200-$5,230
- Entry: $5,205-$5,230 (watch for reversal pattern)
- Targets:
- Target 1: $5,280 (risk-reward 2:1)
- Target 2: $5,330 (risk-reward 3:1)
- Target 3: $5,390 (risk-reward 5:1)
- Stop Loss: $5,175 (below key support)
- Rationale: Buying dip in strong uptrend
- Best if: RSI cools to 50-60 before entry
Scenario 4: Reversal Short (Probability: 20% - HIGH RISK)
- Setup: Extreme exhaustion signals at $5,380-$5,400
- Entry: Only with clear reversal pattern (shooting star, bearish engulfing)
- Targets:
- Target 1: $5,320 (quick scalp)
- Target 2: $5,280 (if momentum shifts)
- Stop Loss: Very tight - $5,415 max
- Rationale: Counter-trend scalp
- WARNING: Fighting strong trend in crisis - extremely dangerous
Multi-Timeframe Synthesis: H1 + M15 Integration
Strategic Framework in Crisis Conditions
Trading during geopolitical crises requires modified approaches:
Current Market Alignment:
- H1 Direction: Strongly bullish, crisis-driven rally
- M15 Execution: Volatile but bullish
- Alignment: Strong positive alignment with extreme momentum
Crisis Trading Principles:
For Long Positions (Primary Strategy):
- H1 confirms: Clear uptrend with strong momentum
- M15 confirms: Making higher highs despite volatility
- Entry approach: Either breakout or pullback strategies viable
- Position sizing: REDUCE size due to high volatility (0.5-1% risk max)
- Stops: WIDER than normal (60-100 pips minimum)
- Targets: Scale out aggressively - don't be greedy
For Short Positions (EXTREMELY HIGH RISK):
- DO NOT fight this trend without clear reversal
- Only consider if:
- Geopolitical news turns positive (peace talks)
- Clear topping pattern forms
- Volume shifts to distribution
- RSI shows bearish divergence
- Position size: 0.25% max
- Stop loss: Extremely tight
- Be ready to flip long if wrong
Modified Risk Management for Crisis
Position Sizing in High Volatility:
- Normal conditions: 1-2% risk
- Current conditions: 0.5-1% risk maximum
- Reason: Price can move 100+ pips in minutes
- Better to undersize and add than oversize and panic
Stop Loss Considerations:
- Wider stops necessary (80-120 pips)
- Use mental stops if spread too wide
- Don't place stops at obvious levels (will be hunted)
- Consider time-based stops (exit if thesis doesn't play out in 4-8 hours)
Take Profit in Volatile Markets:
- Take 50% profit at first target
- Trail remaining position aggressively
- Don't move targets further away
- Book profits regularly - volatility cuts both ways
Fundamental Catalysts Driving Current Surge
Geopolitical Risk Premium at Extreme Levels
The current rally is primarily driven by the most significant geopolitical escalation in the Middle East in decades. The situation has multiple layers:
Immediate Crisis:
- Death of Iran's Supreme Leader (unprecedented)
- Multi-country regional strikes by Iran
- Maritime disruption in Persian Gulf
- Oil supply concerns emerging
- Risk of broader regional war
Market Implications:
- Safe-haven flows overwhelming all other factors
- Traditional correlations breaking down
- Gold divorcing from rate expectations temporarily
- Crisis premium worth hundreds of dollars per ounce
Duration Uncertainty: The key question: How long does this premium persist?
- If conflict escalates: Further upside to ATH and beyond
- If de-escalation occurs: Rapid retracement possible
- If stalemate: Premium fades gradually
US Policy Uncertainty Adding Fuel
Beyond Middle East tensions, US trade policy is adding another layer of uncertainty. Following a US Supreme Court ruling against certain country-specific tariffs, President Donald Trump announced a 15% universal global tariff, renewing trade tensions and pressuring the US dollar.
This development:
- Weakens the dollar (bullish for gold)
- Creates economic uncertainty (safe-haven demand)
- Raises inflation concerns (gold as inflation hedge)
- Reduces global growth prospects (defensive positioning)
Federal Reserve Policy Outlook
Despite the crisis, Fed policy remains relevant. According to CME Group, the probability of a rate cut to 3.25–3.50% in March stands at 4.4%, while 95.6% of market participants expect rates to remain unchanged at 3.50–3.75%.
The "higher for longer" narrative is being challenged by:
- Economic data showing weakness
- Trade policy creating headwinds
- Potential crisis impact on growth
- Markets pricing more cuts later in 2026
Keeping borrowing costs at current levels could limit the upside potential of XAUUSD in normal conditions, but in a crisis, rate expectations matter less than safety.
This Week's Economic Calendar
Moderate gold price volatility is expected this week amid key macroeconomic releases, including the February manufacturing PMI, the Federal Reserve's Beige Book, initial jobless claims in the US, and other economic indicators.
Specific releases:
- Mar. 2: US Manufacturing PMI for February
- Mar. 4: ADP Nonfarm Employment Change, Services PMI, Fed's Beige Book
- Mar. 5: Initial jobless claims
- Mar. 6: Unemployment data
- Mar. 11: US CPI for February
- Mar. 13: GDP Second Estimate Q4 2025, University of Michigan inflation expectations, JOLTS data
Important: In the current crisis environment, these releases may have muted impact unless they're dramatically different from expectations.
Central Bank & Physical Demand
Despite the crisis focus, fundamental support remains strong:
Central Bank Demand:
- PBOC extending purchases for 15th consecutive month
- Emerging market central banks accelerating purchases
- De-dollarization trend accelerating amid crisis
- Crisis validates need for gold reserves
Physical Demand: In India and China, buying interest tied to seasonal and investment flows continues to provide structural support, even as prices reach elevated levels.
Technical Indicators Summary
Overall Signal: STRONG BUY (Crisis Mode)
| Indicator | H1 Timeframe | M15 Timeframe | Signal | Confidence |
|---|---|---|---|---|
| Trend | Strongly bullish | Strongly bullish | Strong Buy | Very High |
| RSI | 80+ (Extreme overbought) | 75-85 (Overbought) | Buy* | High |
| MACD | Strongly positive | Rising fast | Strong Buy | Very High |
| Moving Averages | All bullish | Perfect alignment | Strong Buy | Very High |
| Bollinger Bands | Price above upper | Expanding | Buy | High |
| Volume | Extremely high | Elevated | Buy | Very High |
| Pattern | Impulse wave | Continuation | Strong Buy | High |
| Geopolitical | Crisis premium | Extreme | Strong Buy | Very High |
| Support/Resistance | Above all resistance | Multiple support | Buy | High |
| OVERALL | STRONG BUY | STRONG BUY | STRONG BUY | VERY HIGH |
*Note: Extreme overbought readings in crisis conditions can persist and are less reliable as reversal signals
Trading Strategies for March 3, 2026
Strategy 1: Crisis Momentum Following
Profile: For experienced traders comfortable with high volatility
Setup:
- Philosophy: Ride the crisis premium while it lasts
- Entry Method:
- Option A: Buy on brief pullbacks to $5,260-$5,280
- Option B: Breakout above $5,350 with targets higher
- Position Size: 0.5-1% risk maximum (half normal size)
- Targets:
- Target 1: $5,390 (Take 40% profit)
- Target 2: $5,450 (Take 35% profit)
- Target 3: $5,595 ATH (Trail remaining 25%)
- Stop Loss:
- For pullback entry: $5,220 (60 pips)
- For breakout entry: $5,310 (40 pips)
- Time Horizon: Hours to 1-2 days maximum
Management:
- Monitor news constantly
- Exit immediately on de-escalation news
- Trail stops aggressively once in profit
- Don't hold overnight if uncomfortable
Strategy 2: Range Scalping (If Consolidation Occurs)
Profile: For active traders with quick reflexes
Setup:
- Premise: Price consolidates in $5,260-$5,340 range
- Buy Zone: $5,265-$5,280
- Sell Zone: $5,330-$5,345
- Position Size: 0.5% risk per trade
- Targets: 30-50 pip moves
- Stops: 35-45 pips
- Max Trades: 3-4 per day
Rules:
- Exit ALL positions immediately if:
- Major news breaks
- Range breaks decisively
- Volume profile changes dramatically
- Use limit orders to avoid slippage
- Don't trade during major news releases
Strategy 3: Conservative Pullback Buying
Profile: For risk-averse traders wanting exposure
Setup:
- Entry Criteria:
- Wait for pullback to $5,200-$5,230 zone
- Look for bullish reversal on M15 or H1
- RSI must cool to 50-60 before entry
- Volume must show buying interest at support
- Entry: $5,205-$5,230 (scaled entry in 2 tranches)
- Position Size: 0.75-1% total risk
- Targets:
- Target 1: $5,300 (40% profit)
- Target 2: $5,390 (35% profit)
- Target 3: Trail remaining 25%
- Stop Loss: $5,170 (below key support)
Advantages:
- Better risk-reward than chasing
- Confirmation of support holding
- More comfortable psychologically
- Clear invalidation level
Strategy 4: Options-Based Approach (For Experienced)
Profile: For traders with options experience
Setup:
- Strategy: Buy call spreads or outright calls
- Advantages:
- Limited downside risk
- Leverage to upside
- Can trade around news
- Time decay minimal in high volatility
Example Trade:
- Buy $5,300 calls expiring in 1-2 weeks
- Or: Buy $5,300/$5,500 call spread
- Risk: Premium paid only
- Reward: Significant if rally continues
Note: Options on gold futures may have better liquidity than spot gold options
Market Outlook: Short, Medium, and Long Term
Immediate Term (Next 24-72 Hours): News-Driven Volatility
Base Case (50% probability): Price consolidates between $5,250-$5,380 as markets digest news and await developments. Volatility remains elevated with 100+ pip intraday ranges. Further escalation drives continuation, de-escalation triggers retracement.
Bull Case (30% probability): Conflict escalates further. Gold surges to test ATH at $5,595 and potentially exceeds it to reach $5,600-$5,700. Requires:
- Continued military action
- Oil supply disruptions
- Broader regional involvement
- Dollar weakness persisting
Bear Case (20% probability): Rapid de-escalation occurs (ceasefire, peace talks). Gold retraces sharply to $5,100-$5,150. Requires:
- Immediate cessation of hostilities
- Diplomatic breakthrough
- Risk-on sentiment returning
- Profit-taking overwhelming new buying
Trading Implication: Stay nimble. Don't marry positions. Be ready to exit or reverse quickly based on news.
Short Term (This Week): Economic Data vs Geopolitics
The coming week will test whether economic data matters in a crisis:
Most Likely Path:
- Geopolitical premium dominates early week
- Economic releases have muted impact unless extreme
- $5,200-$5,400 trading range if no new escalation
- Breakout attempts toward ATH if tensions persist
Key Levels:
- Resistance: $5,343, $5,390, $5,450, $5,595
- Support: $5,260, $5,208, $5,153, $5,107
Volatility Forecast: Extreme volatility continues. Expect:
- 100-150 pip daily ranges
- Gap opens possible
- News-driven spikes
- Overnight risk elevated
Medium Term (March-April): Crisis Resolution Phase
According to LongForecast, the price of the precious metal could reach $5,255 by the end of March. However, this forecast was made before the current crisis escalation.
Revised March Outlook: The crisis changes everything. Three scenarios:
Scenario A - Crisis Persists (40%): Gold trades $5,200-$5,800 range with high volatility. Crisis premium of $300-500 remains embedded in price. Targets: $5,500-$5,800.
Scenario B - Gradual De-escalation (40%): Gold slowly retraces as tensions ease. Moves back toward $5,000-$5,200 range. Still holds gains above pre-crisis levels. Targets: $5,000-$5,300.
Scenario C - Rapid Resolution (20%): Quick peace deal or ceasefire. Gold drops sharply to $4,800-$5,000. Crisis premium fully removed but structural support remains. Targets: $4,800-$5,100.
For April: If crisis resolves, gold consolidates in $4,900-$5,400 range. If crisis continues, new ATH above $5,595 likely.
Long Term (Full Year 2026): Structural Bull Market Intact
Despite short-term crisis volatility, the long-term outlook remains bullish. Forecasts for the XAU/USD rate for 2026 are bullish, with the asset likely to trade in the $5,709.51–$7,031 range. According to more optimistic forecasts, gold may surge to $10,762.
Year-End 2026 Forecasts:
- Conservative: $5,800-$6,400
- Base Case: $6,500-$7,400
- Bullish: $7,500-$9,000
- Very Bullish: $9,000-$10,762
By summer, prices may reach $6,016, and by December, they will likely hit a yearly high of $7,408 according to LongForecast projections.
Key Support & Resistance for 2026: Key support levels: $4,954.34, $4,661.81, $4,403.41, $4,208.39, $3,901.24 Key resistance levels: $5,261.50, $5,597.90, $5,853.56, $6,103.62, $6,324.26, $6,554.71, $6,765.55, $6,986.19
Multi-Year Perspective: Forecasts for 2027 are also optimistic, with XAU/USD quotes potentially increasing to $6,360.08–$9,685, with more upbeat forecasts suggesting gold prices may soar to $11,984.
For 2028-2030: Some analysts expect gold to vary between $8,317.97 and $15,423, though growth towards $29,597.17 by 2030 cannot be ruled out.
Structural Drivers Remain Strong:
- Central Bank Accumulation: 15th consecutive month of PBOC buying
- Geopolitical Instability: Middle East, Russia-Ukraine, US-China tensions
- Fiscal Concerns: Unsustainable debt levels globally
- Monetary Policy: Eventually Fed will cut, boosting gold
- Currency Debasement: Dollar weakness from trade policies
- Inflation Hedge: Persistent above-target inflation
Advanced Technical Analysis
Elliott Wave Interpretation
The current structure suggests:
From $2,855 low to $5,595 high (Wave I complete):
- Clear five-wave impulse structure
- Wave 3 was extended (typical)
- Wave 5 reached exactly 1.618 extension
Correction from $5,595 (Wave II):
- A-B-C zigzag pattern
- Wave A: $5,595 → $4,860
- Wave B: $4,860 → $5,300+ (current)
- Wave C: May not materialize if crisis drives new highs
Alternative Count: If we break above $5,595, the correction is complete and we're starting Wave III of a larger degree - extremely bullish and could target $7,000-$8,000.
Fibonacci Analysis
From ATH ($5,595) to Recent Low ($4,860):
- 23.6% Retrace: $5,033 ✓ (exceeded)
- 38.2% Retrace: $5,140 ✓ (exceeded)
- 50.0% Retrace: $5,227 ✓ (exceeded)
- 61.8% Retrace: $5,314 ← Current price very close
- 78.6% Retrace: $5,437
- 100% Retrace: $5,595 (ATH retest)
Current Position: Gold at $5,299 has reached the critical 61.8% Fibonacci level. This "golden ratio" level often acts as:
- Major resistance in corrections
- Launching pad for new impulse waves
- Decision point for trend continuation
If 61.8% level breaks:
- Next targets: $5,437 (78.6%), $5,595 (ATH)
- Extension targets: $6,100 (127.2%), $6,330 (161.8%)
Volume Profile & Market Microstructure
Point of Control (POC): Highest volume trading likely occurred around $5,100-$5,200 in recent weeks. This area will act as:
- Magnet on retracements
- Support if rally continues
- Value area for market participants
Current Price vs POC: Trading significantly above POC suggests:
- Market in discovery mode
- Fair value being repriced higher
- Momentum-driven rather than value-driven
- Higher risk of mean reversion eventually
Volume Characteristics:
- Spike in volume on crisis news (confirming move)
- Sustained high volume (not just panic spike)
- Buyers overwhelming sellers at all levels
- No significant distribution yet
Risk Factors & Black Swans
Known Risks
- Rapid De-escalation: Peace talks or ceasefire could trigger sharp reversal
- Profit-Taking: At these levels, institutional profit-taking possible
- Dollar Surge: Flight to safety could favor USD over gold
- Margin Calls: If equities crash hard, forced gold liquidation
- Technical Breakdown: Loss of $5,100 level would be bearish signal
Crisis-Specific Risks
- Nuclear Escalation: Would be unprecedented gold spike
- Oil Supply Shock: Could trigger recession fears, uncertain for gold
- Coordinated Central Bank Action: Emergency liquidity could weaken gold
- Cyber Attack: Market infrastructure disruption
- Multi-Front Conflict: Expansion to multiple regions
Trading Risks in Current Environment
- Gap Risk: Price can gap 100+ pips on news
- Slippage: Fills may be far from intended price
- Spread Widening: Bid-ask spreads can explode during news
- Broker Restrictions: Some brokers may limit trading
- Liquidity Gaps: Even gold can have liquidity issues in extremis
Hedging & Protection
For Long Positions:
- Take profits regularly - don't be greedy
- Use options for downside protection if available
- Diversify across multiple timeframes
- Keep stops wide but honor them
- Consider reducing size overnight
For Short Positions:
- DON'T - unless you're an expert with tiny size
- If you must: extremely tight stops, quick scalps only
- Be ready to flip long if wrong
- Use options (buy puts) instead of outright shorts
Crisis Trading Psychology
Emotional Discipline in Volatile Markets
Common Mistakes in Crisis Trading:
- FOMO (Fear of Missing Out): Chasing price too high
- Revenge Trading: Trying to win back losses quickly
- Overleveraging: Using too much size due to excitement
- Ignoring Stops: "It has to come back"
- Analysis Paralysis: Overthinking and missing moves
Best Practices:
- Stick to Plan: Follow your predetermined strategy
- Size Down: Use smaller positions than normal
- Take Profits: Book gains regularly, don't wait for "the top"
- Honor Stops: Exit if your thesis is invalidated
- Stay Informed: Monitor news but don't overreact to every headline
When to Step Aside
Consider not trading if:
- You feel overwhelmed by volatility
- You're making emotional decisions
- You've hit your loss limit for the day
- Major news is imminent and you're not comfortable
- You can't monitor positions actively
Remember: There will always be another trade. Preservation of capital is paramount.
Final Thoughts & Key Takeaways
Gold finds itself in extraordinary circumstances on March 3, 2026. Trading at $5,299 following the most significant Middle East escalation in decades, the market is being driven purely by crisis dynamics that override normal technical and fundamental considerations.
Critical Conclusions:
-
Crisis Premium Dominates: The geopolitical situation has created a panic bid worth hundreds of dollars per ounce. This premium can evaporate quickly if tensions ease.
-
Technical Levels Matter Less: While support and resistance still exist, they're less reliable in crisis mode. News flow matters more than chart patterns currently.
-
Extreme Volatility: 100+ pip moves in minutes are possible. This requires adjusted position sizing and risk management.
-
Overbought Readings Unreliable: Traditional technical indicators showing extreme overbought conditions, but these can persist in crisis environments.
-
61.8% Fibonacci Critical: Current price at golden ratio Fibonacci level. Break above targets ATH and beyond; failure could trigger retracement.
-
News is Everything: Monitor developments constantly. Be ready to adjust or exit positions based on headlines.
-
Long-Term Bullish Structure Intact: Regardless of short-term crisis resolution, structural bull market remains in place.
-
Risk Management Paramount: Use smaller position sizes, wider stops, take profits regularly. Don't be greedy.
Trading Wisdom for Crisis Conditions
Do:
- Reduce position sizes significantly (50% of normal)
- Use wider stops (80-120 pips minimum)
- Take profits aggressively at targets
- Monitor news constantly
- Be ready to exit quickly
- Keep detailed trade journal
- Scale into positions rather than all-in
Don't:
- Chase price without confirmation
- Fight the trend with stubborn shorts
- Ignore stops because "it must reverse"
- Hold overnight if uncomfortable
- Trade when emotionally compromised
- Overleverage due to excitement
- Ignore wider spreads and slippage
Price Predictions
Next 24 Hours:
- Bull Case: $5,400-$5,500
- Base Case: $5,260-$5,380
- Bear Case: $5,150-$5,280
- Most Likely: Volatile consolidation $5,270-$5,350
This Week:
- If escalation continues: $5,500-$5,700
- If stalemate: $5,200-$5,400
- If de-escalation begins: $5,000-$5,250
End of March:
- Crisis scenario: $5,400-$5,800
- Resolution scenario: $4,900-$5,300
- Base case: $5,100-$5,400
Closing Thought
"In crisis, the market can remain irrational longer than you can remain solvent." - adapted from Keynes
The current situation in gold is a perfect example of this principle. The crisis premium is real, the momentum is strong, and the technicals support higher prices. BUT - this can reverse on a dime if geopolitical news shifts.
Trade with discipline, manage risk ruthlessly, and don't let greed override common sense. The opportunity is significant, but so is the risk. Those who respect both and trade accordingly will survive and profit. Those who don't will be crushed by the volatility.
The gold bull market is alive and well, turbocharged by geopolitical crisis. But remember: crisis premiums are temporary. The structural bull market is what matters long-term.
Disclaimer: This analysis is for educational and informational purposes only and does not constitute financial advice. Trading gold and other financial instruments during geopolitical crises involves extreme risk of loss. Past performance is not indicative of future results. The current market conditions are exceptionally volatile and dangerous for inexperienced traders. Always conduct your own research, understand the risks involved, and consider consulting with a licensed financial advisor before making investment decisions. Never risk more than you can afford to lose, and consider not trading during extreme volatility if you're not experienced with crisis conditions.
Published: March 3, 2026
Timeframes Analyzed: H1 (1-Hour), M15 (15-Minute)
Asset: XAUUSD (Gold Spot vs US Dollar)
Current Price: $5,299.03
Market Condition: CRISIS MODE - Extreme Volatility
Analysis Type: Crisis-Focused Technical Analysis
⚠️ SPECIAL CRISIS TRADING NOTICE ⚠️
The current market conditions are EXCEPTIONAL and EXTREMELY DANGEROUS for retail traders. The geopolitical situation has created unprecedented volatility. If you are not an experienced trader comfortable with:
- 100+ pip moves in minutes
- Gap risk
- Potential for rapid reversals
- High emotional stress
- Significant loss potential
CONSIDER STAYING OUT OF THE MARKET until conditions stabilize. There will be other opportunities. Protecting your capital is more important than catching this specific move.


")

")