")

USDCAD Daily Chart - June 22, 2016
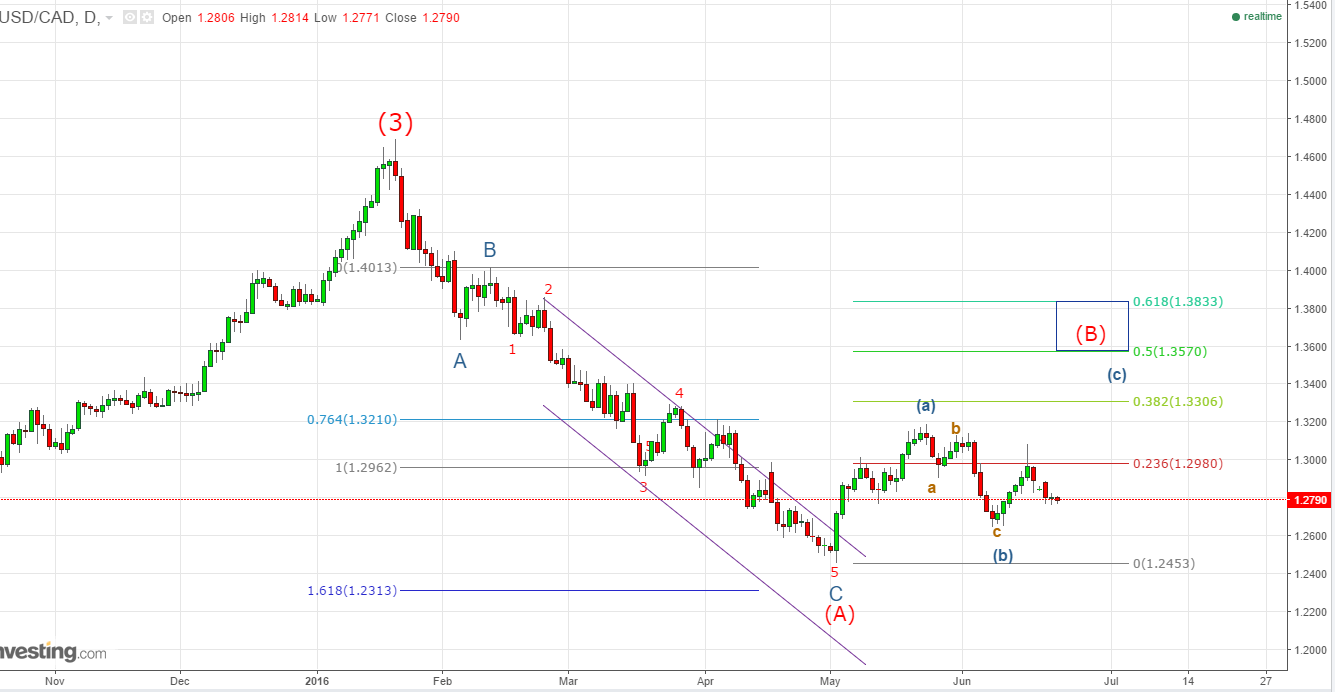
In the above daily chart, we expect USDCAD to test 1.33 - 1.35 price area in order to complete the intermediate corrective red (B) wave.
Immediately after the end of red wave (A), USDCAD rallied from 1.25 to 1.32 with 3 inner waves, completing blue wave (a). Blue wave (b) retraced 78.6% of previous rally and had a 3 wave structure as shown in the chart. Now, USDCAD has a 1-2 structure ready to continue with the last leg of the corrective (B) wave. Up to now, red wave (B) has the corrective wave structure 3-3-5 that usually is a Flat Structure.
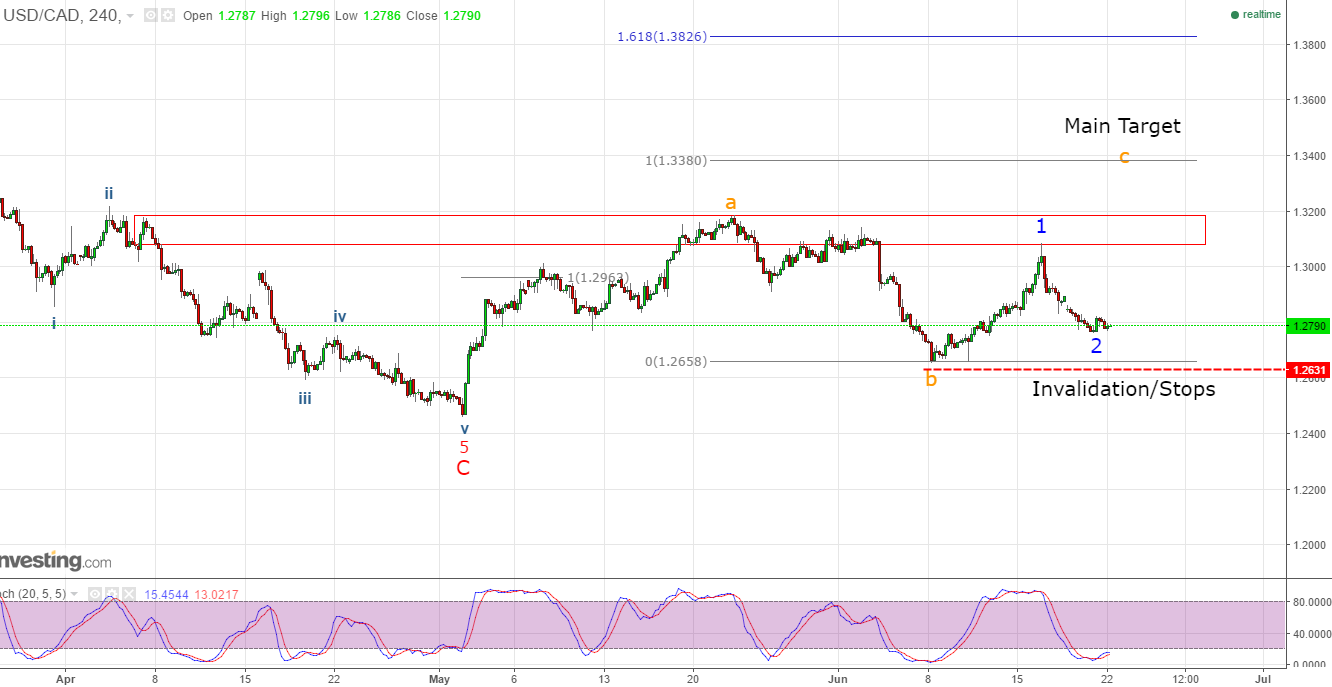
USDCAD 4h Chart - June 22, 2016
...Read More


 & AMD Framework")
")