Does Knowing the Market Regime Actually Help? A Controlled Study & Ehler's DSP Suite User Manual

Companion study and user manual for the Ehlers DSP Suite. This is the deep-dive referenced in the product description. It contains full backtest numbers, including the results that did not work.

Why this study exists
The Ehlers DSP Suite is built on one premise: if you know whether the market is trending or cycling, you know which tools to trust. That is a testable claim, so we tested it, instead of just asserting it.
We are publishing the complete results, including where the idea failed, because that is the honest way to show what a regime tool can and cannot do.
The setup
We built a deliberately minimal Expert Advisor that trades MESA (MAMA/FAMA) crossovers on XAUUSD and nothing else:
- Fixed position size, no stop-loss, no take-profit. This isolates raw signal quality and deliberately strips out exit design and money management.
- All default Ehlers parameters. Zero optimization. No curve-fitting.
- Period: January 2024 to mid-2026. Same data and settings across every run.
We then compared three versions:
- No gate: take every crossover.
- Trend gate: take a crossover only when the regime engine agrees with its direction.
- Cycle gate: take a crossover only when the regime engine says the market is cycling.
XAUUSD M15 results
| Version | Profit factor | Max drawdown | Every year positive? |
|---|---|---|---|
| No gate | 1.02 | 52.7% | No |
| Trend gate | 1.15 | 33.2% | No (one losing year) |
| Cycle gate | 1.39 | 21.9% | Yes |
The controlled comparison that matters most is the long side on identical data: ungated long crossovers scored a 1.15 profit factor; the same long crossovers, filtered to cycle mode only, scored 1.82. Same market, same bull trend, same signals: the regime filter kept the better ones and discarded the worse ones. Drawdown more than halved, and every calendar year finished positive.
The honest part: where it did NOT hold
If we stopped there, we would be doing exactly what we told you to distrust. So here is the full picture.
1. Absolute profits were trend beta. In every configuration, the profit came from the long side during a strong gold uptrend. The short side was weak throughout. This tool did not turn a downtrend into profit. What it demonstrably did was improve the quality of signals within the same conditions.
2. The H1 timeframe behaved differently. On H1, the cycle gate did not repeat its M15 win (one year went slightly negative), while the trend gate looked strong, but its strength was concentrated long-side bull exposure rather than genuine signal improvement. Different timeframes have different dominant cycles, and the gate that helps most is not the same on every one.
3. This is a single symbol and a single regime era. 2024 to 2026 was a gold bull market. We make no claim about other symbols or other market conditions.
What we conclude
The regime engine is information that sharpens how you apply a method. On XAUUSD M15, gating MESA crossovers by cycle regime produced a materially cleaner, more consistent result than taking them blind, on identical data with no optimization. That is a real, reproducible effect.
It is not a trading system, not a set of projected returns, and not a promise of profit. The trading decisions, the exits, and the risk management remain yours.
If a vendor shows you only the winning numbers, be skeptical. We showed you all of them.
If you want to reproduce it yourself: you will need the validation Expert Advisor after purchase. DM me to receive it, free of charge. Its three gate modes are described below. Load the indicator, attach the EA, switch the gate mode input, and run the same three passes.
How to Use the Ehlers DSP Suite: Complete Guide
This section is the user manual: how to read the tool, what every input does, a practical workflow, and the precautions that keep you out of trouble.
Installation
- Copy the Ehlers DSP Suite folder (with its Include subfolder) into your terminal's MQL5\Indicators\ directory. The Include folder must stay next to the indicator, the #include path is relative.
- In MetaEditor, open Ehlers_DSP_Suite.mq5 and compile (F7). It should compile with no errors.
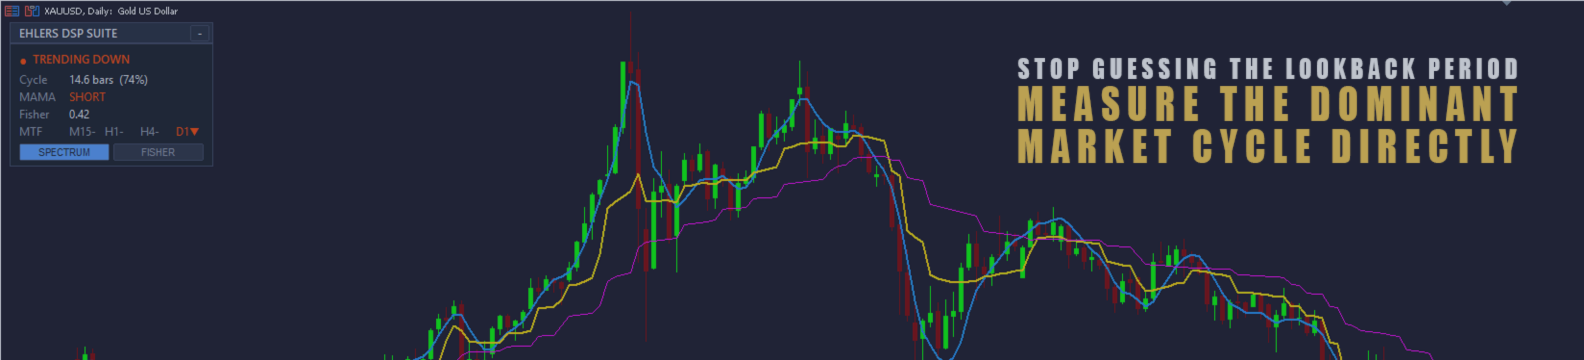
- In MetaTrader, drag "Ehlers DSP Suite" from the Navigator onto a chart. It opens a sub-window (the pane) and draws overlay lines on the price chart, plus a floating dashboard in the top-left.
Give it a few seconds on first load. The engine needs history to warm up, and the multi-timeframe strip has to download H1/H4/D1 data before it can display.
How to read it (the 30-second version)
Read the dashboard top to bottom:
- Regime first. The colored verdict (TRENDING UP, TRENDING DOWN, or CYCLE MODE) tells you which tools to trust. In a trend, lean on MAMA/FAMA and the Ultimate Smoother. In cycle mode, the Fisher and the dominant-cycle reading come into their own.
- Dominant cycle. When cycling, this is the measured length of the current cycle in bars, with a confidence percentage. A dash means no clear cycle is present, which is itself useful information: do not force a cycle tool onto a market that has no cycle.
- MAMA bias. LONG or SHORT, the current side of the adaptive trend.
- Fisher. The normalized oscillator value, tagged overbought or oversold at the extremes.
- MTF row. Whether M15, H1, H4, and D1 agree. Alignment across timeframes is stronger context than any single one.
The core idea: the suite does not tell you to buy or sell. It tells you what kind of market you are in so you apply the right tool and avoid the wrong one.
The components on the chart
- Gold line (MAMA) and magenta line (FAMA): the MESA adaptive averages. MAMA tracks price closely in fast moves and flattens in chop; FAMA is the slower signal line. Their crossover is the classic MESA signal.
- Blue line (Ultimate Smoother): a low-lag trend line, Ehlers' 2024 smoother.
- Pane (Spectrum mode): the cycle spectrum heatmap. Hot bands are cycle energy; the white line rides the dominant cycle when one is present.
- Pane (Fisher mode): the Fisher oscillator and its trigger line, with extreme levels.
- Ribbon along the pane bottom: the regime, colored green/red/gray.
Reading the cycle spectrum (the heatmap)
The heatmap is the suite's signature view, and it rewards a closer look.
- The vertical axis is cycle length in bars (10 at the bottom, 48 at the top). Each horizontal row is one candidate cycle period.
- Color is power. Cool navy means little or no energy at that period; warm orange and red mean strong cyclic energy. A bright horizontal band means the market is oscillating with that period right now.
- The white line is the dominant cycle, the single period carrying the most power, riding along the strongest band. It only draws when a cycle is genuinely present (the confidence gate); a gap in the line means no reliable cycle.
- Read it left to right as time. A band that drifts upward means the cycle is lengthening; a band that ignites out of darkness means a cycle is forming; darkness returning means the cycle has broken down, usually as a trend or impulse takes over.
What to do with it:
- A strong, steady hot band means trust cycle tools. The Fisher's overbought and oversold turns and mean-reversion reads are most reliable when the spectrum shows a clear cycle. Use the dominant-cycle length to gauge how long a swing might run.
- A dark, incoherent spectrum means a trending or noisy market. This is when cycle tools mislead and trend tools (MAMA/FAMA, Ultimate Smoother) take over. The regime ribbon usually agrees, and when the heatmap and the ribbon agree, that is genuine confluence from two independent calculations.
- A band stretching upward toward the top of the range often precedes the cycle breaking down into a trend. Watch for the ribbon to flip around the same time.
Every input explained
Engine (the shared signal-processing core)
- Applied price (default: Close). The price the engine analyzes. Close is standard.
- Roofing high-pass period (default: 48). Removes trends and cycles longer than about this many bars. Raise it to let longer cycles through, lower it to focus on faster ones.
- Roofing Super Smoother period (default: 10). Removes noise shorter than about this many bars. This is the noise floor. Most users never change these two.
- Autocorrelation averaging length (default: 3; 0 = full lag). Higher values give a smoother, steadier spectrum that reacts more slowly. 3 is a good balance.
Pane
- Pane display mode (default: Spectrum). Which pane you see. You can also switch this live with the dashboard's Spectrum/Fisher buttons, no need to reopen settings.
- Show cycle spectrum heatmap (default: on). Turn off if you want the dominant-cycle line alone without the heat colors.
- Dominant cycle line color (default: white).
- Dominant cycle display smoothing (default: 10). How smooth the white cycle line is. Higher is smoother but slower to react.
- Min peak spectral power to show cycle (default: 0.5). The confidence gate. At 0.5, the cycle line only appears when a cycle is genuinely strong. Raise toward 0.8 to be stricter (line hidden more often, fewer false cycles). Set 0 to always show it.
Fisher
- Fisher lookback (default: 0 = adaptive). At 0, the lookback auto-tunes to half the measured dominant cycle, the suite's self-tuning feature. Set a fixed number (for example 10) for a classic constant-length Fisher.
- Fisher applied price (default: Median, (High+Low)/2). Ehlers' choice.
- Fisher extreme level (default: 1.5). The overbought/oversold threshold that drives the pane levels, the dashboard tag, and the extreme-turn alert. Raise it to only flag more extreme turns.
- Fisher / trigger colors.
MTF confluence
- Show M15/H1/H4/D1 bias strip (default: on). The multi-timeframe MESA bias row.
Dashboard
- Dashboard & chart overlays (default: on). Turn off to hide the floating panel and the overlay lines. It is auto-disabled in non-visual backtests for speed, so you do not have to remember to turn it off before a test.
Chart overlay
- Show Ultimate Smoother (default: on) and period (default: 20). The low-lag trend line and its length. Longer = slower/smoother.
- Show MAMA/FAMA (default: on).
- MAMA fast limit (default: 0.5) and slow limit (default: 0.05). These bound how responsive the adaptive average is allowed to get. The defaults are Ehlers' published values. Higher fast limit = more responsive MAMA (and more whipsaw); lower slow limit = smoother in quiet markets. Change these only if you understand the tradeoff.
- MAMA applied price (default: Median). Ehlers' choice.
- MAMA / FAMA colors.
- Overlay history depth (default: 500 bars). How far back the overlay lines are drawn. Raise it to see more history (uses more chart objects), lower it for a lighter chart.
EMD regime (the dashboard's brain)
- EMD bandpass period (default: 20). The timescale of what counts as a trend. On H1 this is roughly a day of bars. Larger = slower, more strategic verdicts.
- EMD bandpass bandwidth (default: 0.5). How wide a band of cycles the regime engine considers. The default is well-behaved.
- EMD trend threshold (default: 0.1). The sensitivity dial. This decides how far the trend component must stretch before the verdict flips from CYCLE to TRENDING. Raise it (toward 0.2) to make trend calls stricter, so the tool spends more time in cycle mode. Lower it to call trends more eagerly. This is the one regime input worth tuning to taste.
- EMD peak/valley averaging length (default: 50). Smooths the envelope the threshold is measured against.
- Ribbon colors for trending up, trending down, and cycle mode.
Alerts (all off by default)
- Popup / push on MAMA/FAMA cross.
- Alert on regime shift.
- Alert on Fisher extreme turn.
All alerts fire on closed bars only, never intrabar. Push notifications require MetaQuotes ID configured in your terminal options.
Advanced
- Spectrum sweep degrees (default: 370). Ehlers' published value. Leave it alone unless you are experimenting; 360 gives the textbook version.
A practical workflow
One disciplined way to use the suite (educational, not trading advice):
- Check the regime, then confirm it against the heatmap. If the ribbon says CYCLE MODE and the spectrum shows a clear hot band, you have a confirmed cycling market; note the dominant cycle length. If the ribbon says trending and the spectrum is dark, that is confluence for a trend read.
- In a trend (dark spectrum, trending ribbon), treat MAMA/FAMA crossovers and the Ultimate Smoother direction as your primary read, and be cautious about fading extremes.
- In cycle mode (hot band on the heatmap, cycling ribbon), the Fisher's overbought/oversold turns and the dominant cycle become more meaningful, and the dominant-cycle length gives you a sense of how long a swing may last. This is the environment where our study found the MESA crossover performed best.
- Use the MTF strip as a confirmation filter. Signals that agree with the higher timeframes carry more weight than signals fighting them.
- Be wary of transitions. When a heatmap band is stretching upward and fading, or the ribbon is about to flip, the market is between regimes and both tool sets are unreliable.
- Apply your own entry rules, exits, and position sizing. The suite is context, not a complete system.
Precautions (read this)
- It is not a trading system. It gives you better information about market state. Your entries, exits, stop-losses, and risk management are yours to design and are essential.
- Adaptive tools update on the forming bar. The suite is non-repainting: values on closed bars never change. But the current, still-forming bar updates until it closes, as any honest indicator does. Base decisions on closed bars, not on the live bar's flicker.
- Respect the warm-up. The engine needs history to measure a spectrum and a regime. The readings at the far-left edge of a freshly loaded chart, or in the first bars after attaching, are not yet reliable. Give it a few hundred bars.
- A dominant-cycle dash is not a bug. When the tool shows no cycle, it means no cycle is statistically present. That is the tool being honest, not broken. Do not force a cycle-based read onto a trending or noise-dominated market.
- Cycle content differs by symbol and timeframe. If the dominant cycle sits pinned at the floor or ceiling for long stretches, the roofing periods may not suit that market. Session-gapped instruments (stocks, indices) give weaker cycle readings than 24-hour markets like FX and gold; a higher timeframe often reads more cleanly there.
- Backtesting the dashboard is slow. Leave the dashboard on for live charts, but run non-visual backtests (it auto-disables) for speed. In the tester's "Open prices only" mode, MTF timeframes below the tested one are unavailable by design.
- Broker data matters. Cycle and regime measurements are only as good as the price data feeding them. Poor or gap-filled history produces poor readings.
- Our study was one symbol, one era. The regime effect we documented was on XAUUSD in a 2024 to 2026 gold bull. Validate the tool on your own symbol, timeframe, and conditions before relying on it. Past behavior does not guarantee future behavior.
Troubleshooting
- The chart feels heavy or the backtest crawls: turn off the dashboard, or run non-visual. Lower the overlay history depth.
- The cycle line keeps disappearing: that is the confidence gate. Lower "Min peak spectral power" if you want it shown more often, at the cost of more false cycles.
- Fisher shows a large value like 4 or 5: legitimate in a strong one-way run. The Fisher's recursive smoothing can reach those levels when price pins an extreme.
- MTF labels show a dash: that timeframe's history is still downloading, or (in the tester) is a timeframe the tester cannot provide. Wait, or open the higher-timeframe chart once to force the download.
- Overlay lines do not extend far left: raise "Overlay history depth."
Feel free to send me a DM with questions.
Made with math instead of hope.
Trade responsibly!



![[iVISTscalp5]: XAUUSD. Forecast First. Market Reaction Afterwards](https://c.mql5.com/6/1035/splash-preview-777232.png "[iVISTscalp5]: XAUUSD. Forecast First. Market Reaction Afterwards")