
Comprehensive Technical Overview The TPS Trading Indicator is an advanced, trend-following Trading Tool

The TPS Trading Indicator is an advanced, trend-following technical analysis tool engineered for MetaTrader 5. Built with a focus on filtering out market noise and identifying high-probability entry zones, this indicator utilizes a powerful "Dual Confirmation" system. By combining the price-smoothing capabilities of Renko calculations with the directional momentum of the Supertrend algorithm, it delivers precise, actionable signals.
While highly adaptable to various markets and multi-timeframe analysis, the underlying logic is exceptionally well-suited for highly volatile pairs like Gold (XAUUSD), providing clarity in environments prone to rapid price fluctuations.
Core Trading Philosophy: The Dual Confirmation Engine
The foundation of the TPS Trading Indicator is its requirement for two distinct trend algorithms to align before generating a valid buy or sell signal.
1. The Internal Renko TPS (Indicator 1)
Unlike traditional Renko indicators that require clunky offline charts, this tool calculates a synthetic Renko chart internally.
-
Mechanism: It uses the Average True Range (ATR) to determine a dynamic "Brick Size." Virtual Renko bricks are built based on this ATR multiplier.
-
Application: A custom Supertrend is then calculated directly on top of these virtual bricks. Because Renko only prints a new brick when a specific price movement is achieved, this first layer completely ignores time and minor price wicks, establishing a highly accurate baseline trend.
2. The Standard Supertrend (Indicator 2)
The second layer of confirmation uses a standard Supertrend calculated on the actual chart candles (using High/Low medians and a separate ATR).
-
Mechanism: This ensures that the current, real-time price action supports the broader trend established by the Renko engine.
The Signal: A definitive Buy (▲) or Sell (▼) arrow is only plotted on the chart when both the Renko Supertrend and the Standard Supertrend shift into the same directional bias simultaneously.
Advanced Signal Filtering
To prevent false breakouts and sidestep choppy, consolidating markets, the indicator includes two optional, highly effective filters:
-
ADX (Average Directional Index) Filter: When enabled, the indicator checks the strength of the trend. A signal is only validated if the ADX value sits above a user-defined minimum threshold (default is 20). This keeps you out of weak, ranging markets.
-
Volume Surge Filter: This filter calculates a Simple Moving Average (SMA) of recent tick volume. It restricts signals to moments when the current volume exceeds the average by a specific multiplier (e.g., 1.2x). This ensures that entries are backed by actual institutional momentum and market participation.
Dynamic Trade Management (Multi-Tier TP & SL)
The TPS Trading Indicator goes beyond simply printing arrows; it acts as a complete trade management assistant.
-
Three-Tier Take Profit System: Every valid signal instantly projects three Take Profit levels (TP1, TP2, TP3) and a Stop Loss based on user-defined point/pip distances.
-
Trailing Stop Loss / Break-Even Logic: If the UseTrailingSL feature is enabled, the indicator dynamically manages risk. Once TP1 is hit, the Stop Loss is virtually moved to the entry price (Break-Even). When TP2 is hit, the Stop Loss trails to the TP1 level, locking in profits and ignoring subsequent retracements.
-
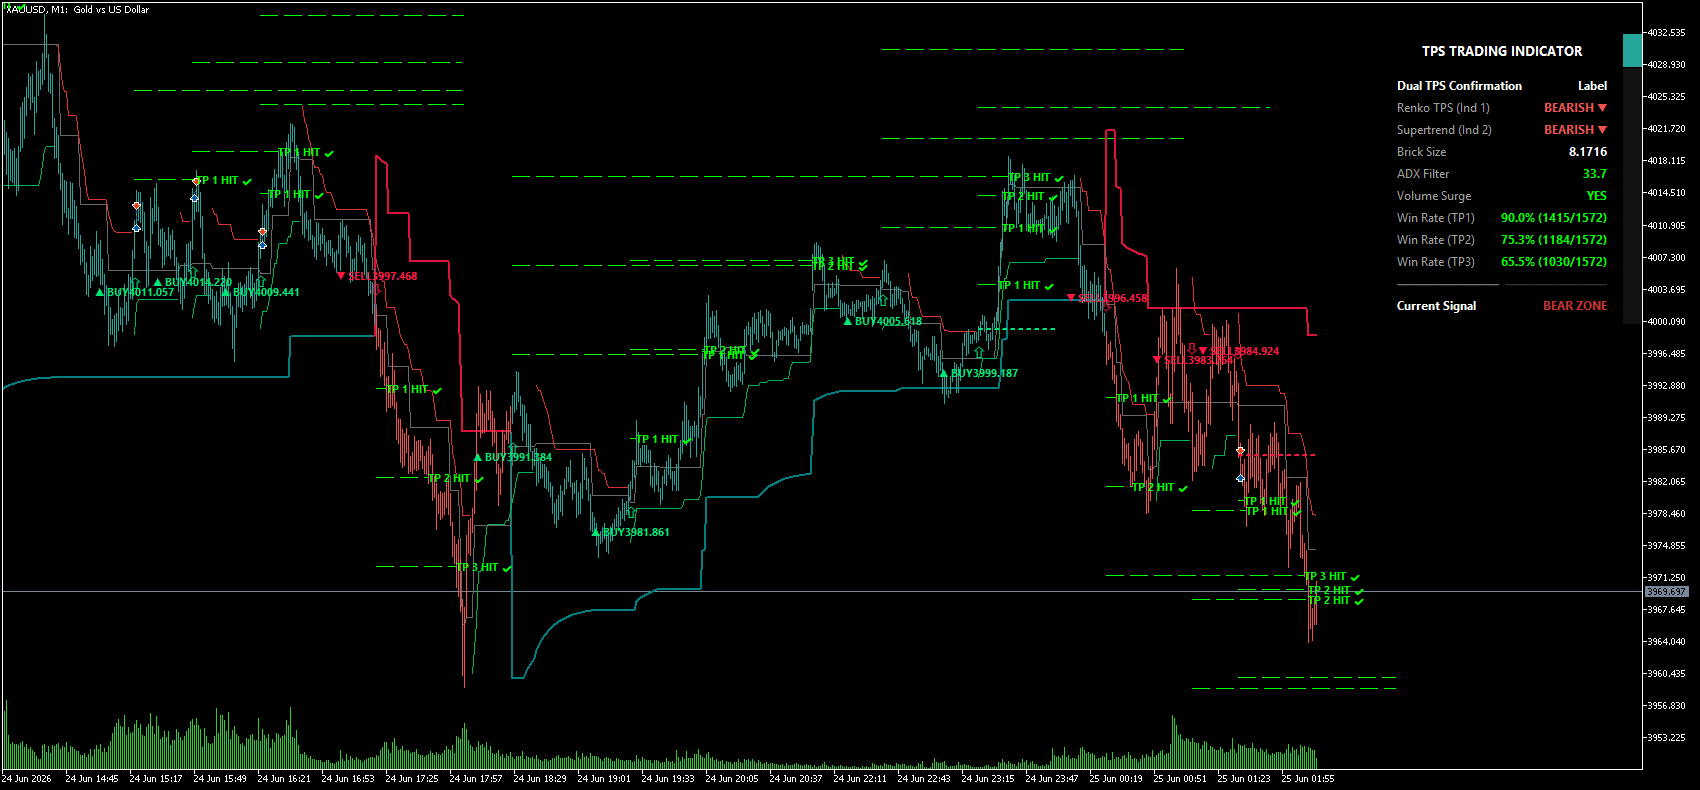
Smart Visual Projection: To keep the chart clean, Stop Loss and Take Profit lines are only projected for the two most recent active signals. Once a target is hit, the line stops extending, and a clean "HIT ✔" label is printed on the chart.
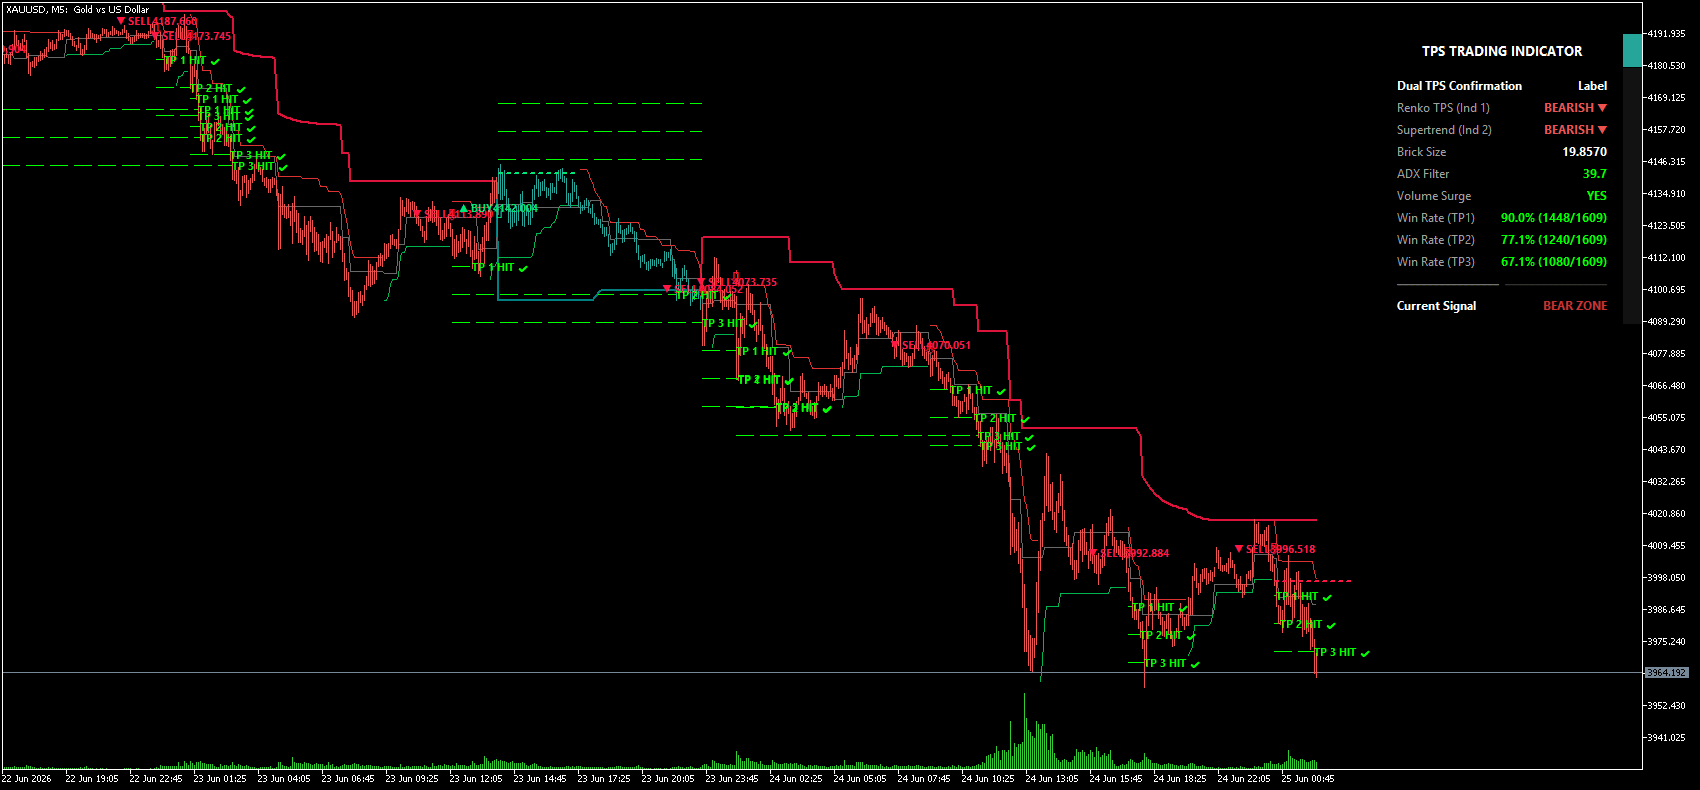
Modern On-Chart Analytics Dashboard
A standout feature is the sleek, non-intrusive UI panel anchored to the top right of the chart. This dashboard provides real-time analytics without obscuring price action:
-
Trend Status: Instantly see the individual alignment of the Renko TPS and the Standard Supertrend.
-
Filter Status: Live tracking of the current Brick Size, ADX value, and whether a Volume Surge is present.
-
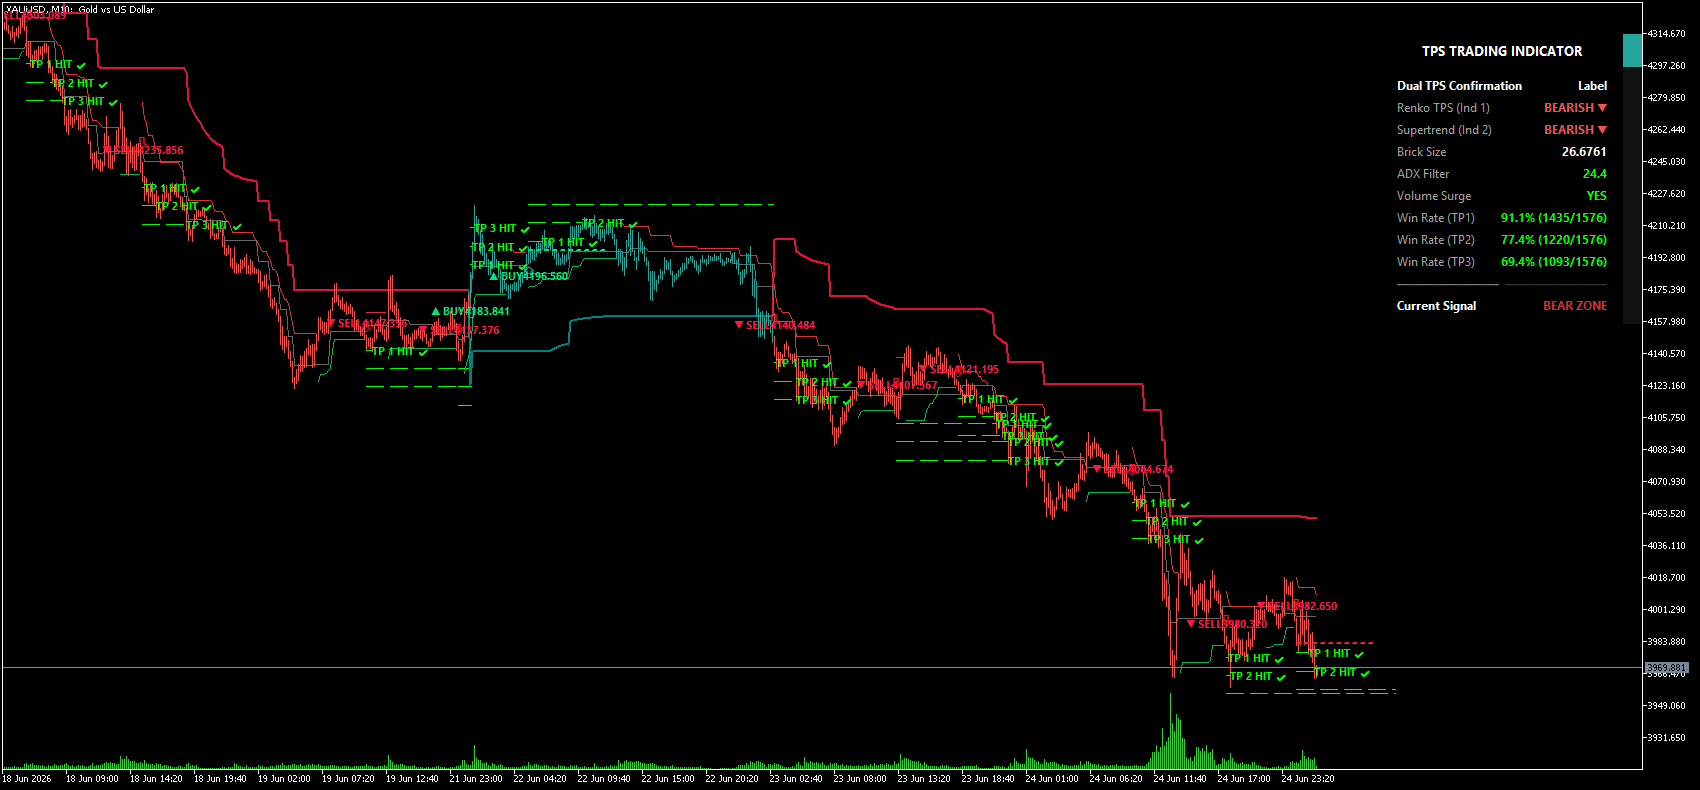
Historical Win Rate Tracking: The dashboard silently logs every signal generated on the chart. It calculates and displays the exact historical Win Rate independently for TP1, TP2, and TP3. This allows traders to visually backtest the strategy's effectiveness on their chosen timeframe and asset at a glance.
Visuals and Chart Aesthetics
The indicator is designed for absolute visual clarity:
-
Bar Coloring: Chart candles are dynamically colored (default Bullish Teal / Bearish Crimson) based on the overarching trend direction, providing immediate visual context.
-
Support/Resistance Levels: Upon a signal, the indicator draws an extended, customizable Level Line (Solid, Dashed, or Dotted) forward into the future. This highlights the exact price zone where the signal was generated, serving as a powerful reference point for future support/resistance or "Fair Value" tests.
Best Practices for Trading
-
Optimal Pair: The algorithm thrives in markets with clear, sustained momentum and high liquidity. It is explicitly optimized for Gold (XAUUSD).
-
Timeframe Flexibility: Because it utilizes an adaptive ATR-based Renko engine, it scales effectively across multi-timeframe analysis (e.g., using the 1-Hour chart for direction and the 15-Minute chart for entries).
-
Risk Management: Always use the historical Win Rate tracker on the dashboard to tune your TP/SL pip inputs before deploying the indicator in live market conditions. Ensure your ATR multipliers fit the volatility of your specific asset.


