
Martingale as the basis for a long-term trading strategy
Introduction
The martingale is a well known trading system. It has many advantages: ease of use, no need to use tight Stop Loss, which reduces psychological pressure, a relatively small amount of time which the user needs to invest in trading.
Of course, the system also has huge drawbacks. The most important of them is the high probability of losing the entire deposit. This fact must be taken into account, if you decide to trade using the martingale technique. This means that you should limit the maximum number of position averaging operations.
Basics of the classical martingale strategy
According to the classical martingale system, the next deal volume should be doubled if the previous ones was closed with a loss. In this case, the profit of the double-volume deal can cover the previous loss. The system is based on the idea that you should finally get lucky. Even if the market does not reverse to take the desired direction, you can benefit from a correction. From this point of view, this should work according to the theory of probability.
In this form, martingale can be combined with any trading system. For example, in level based trading you can open a double-volume deal after having a losing trade. Moreover, since Take Profit in level trading is normally three or more times larger than Stop Loss, you don't have to increase the deal volume after each loss. This can be done after two or three losses, or the deal volume can be multiplied by 1.1 or any preferred value rather than doubling it. The main idea is that the resulting profit should fully cover the preceding losing chain.
The martingale can also be used for increasing position volume in parts. First, we open a small volume position. If the price goes in the opposite direction, we open one or several more positions with the remaining volume and thus we get a lower average price.
As for position holding, martingale provides additional opening of a position with the same or increased volume in the same direction, if the market moves opposite to your initial position. This type of martingale will be discussed in this article.
For example, if you open a long position and the market starts falling, then you do not close this position, but open another long one - this time the position is opened at a better price. If the market continues falling, another long position can be opened at a new better price. Continue opening positions until the price turns in the right direction or until you reach a certain maximum number of positions.
According to the classical martingale technique, each new position should be opened with a double volume. But this is not necessary. If you use double volume, you can achieve the total profit of all positions faster, provided that the price started moving in the favorable direction. In this case, you do not have to wait until the price reaches your first open position in order to have the profit. So, losses on all positions can be covered even if there is price correction, without the full reversal.
Also, you can keep the previously opened position open or close it. However, if you decide to close it, the new position must necessarily have an increased volume.
Does martingale work?
I do not claim to be a martingale expert. Let us reason together. Can this trading system show acceptable results?
Any movement in the market has a wavy character. A strong movement in one direction is almost always followed by a corrective pullback in the opposite direction. According to this regularity, martingale based systems can work. If you can predict the pullback beginning and preform an appropriate buy or sell trade at the appropriate time, you can cover losses or even make profit. If the market turns in your direction instead of the pullback, you can earn a good profit.
However, sometimes strong price movements occur with almost no pullback. The only thing we can do in this case is wait and hope that the deposit will be enough to bear losses until the price finds the bottom and starts reversing.
Choose the market
Martingale operation may differ in different markets. Therefore, if possible, it is better to choose the market, which is the most suitable for this trading strategy.
Forex is considered to be a ranging market. Stock market is considered to be a trend one. Due to this Forex can be more preferable for martingale techniques.
The use of this strategy in stock markets is associated with a lot of dangers. The most important of them is that a stock price can be equal to zero. That is why long trading using the martingale technique can be very dangerous on the stock market. Short trading can be even more dangerous, because the stock price can soar to an unexpectedly high level.
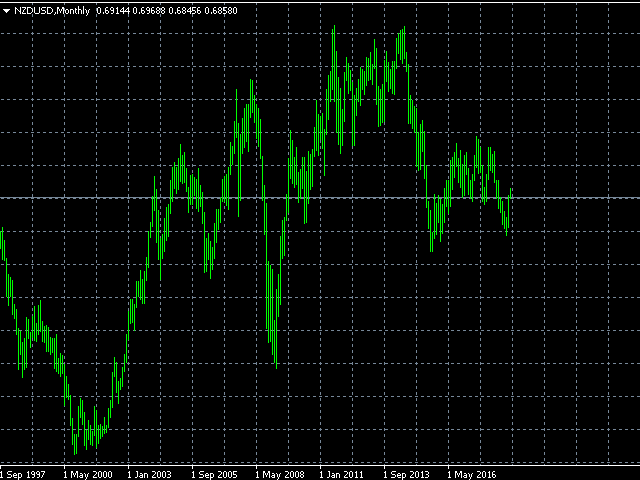
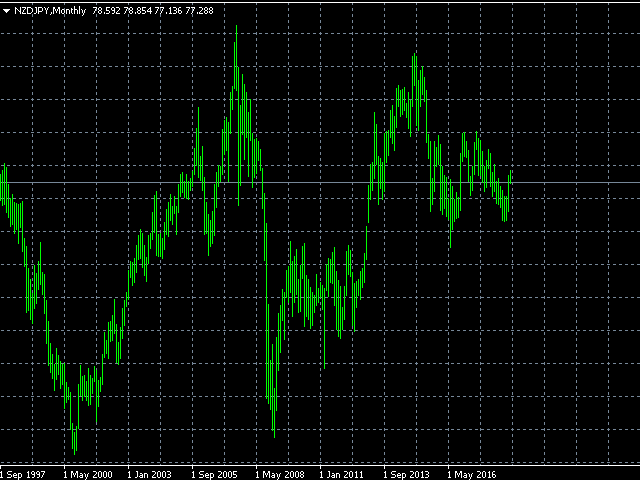
Currency quotes in the Forex market cannot be equal to zero. For a currency rate to skyrocket, something incredible must happen. The rate is normally moving inside a certain range. How can we benefit from this?
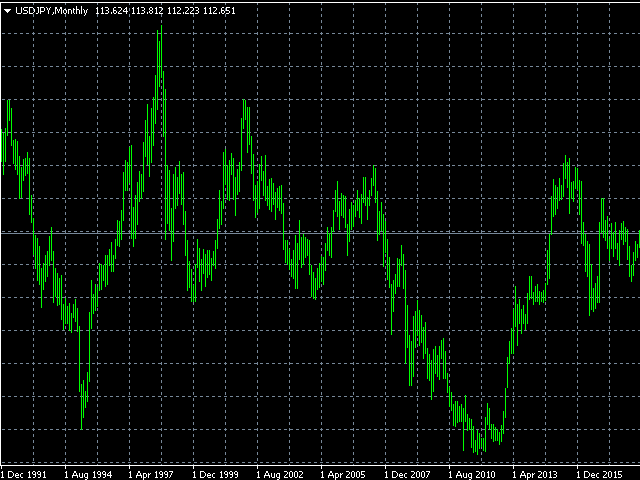
As an example, let us view the monthly charts of Forex symbol quotes. Let's begin with USDJPY:
NZDUSD:
NZDJPY:
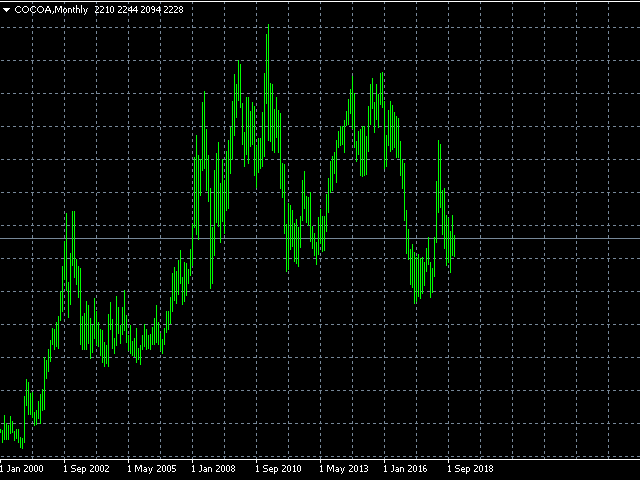
As for other markets, they can also be suitable for martingale techniques.
For example, let us have a look at the cocoa bean market:
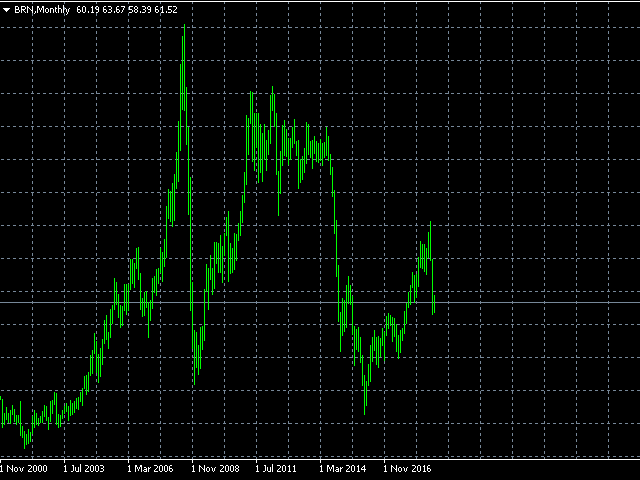
Here is the Brent market:
Or the soybean market:
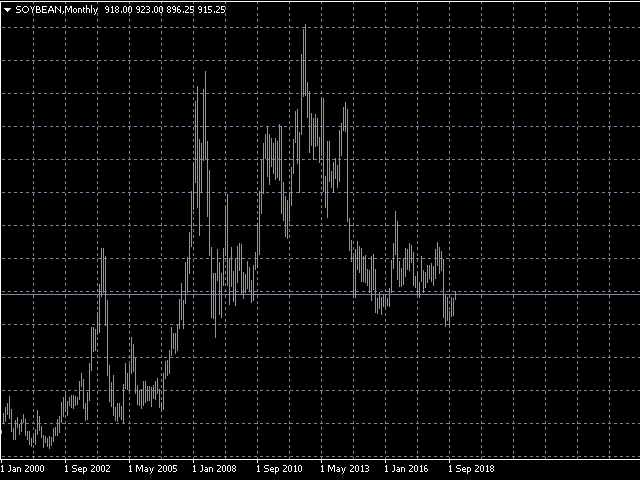
The martingale technique is better suitable for financial instruments, which are in a certain range on any of the timeframes (for trading the range borders). Another acceptable option is to trade symbols which have been moving in one direction for many months, without significant rollbacks (trade in the direction of this movement).
Choose a direction
If you are going to use the martingale technique, make sure all factors are favorable for you. We have analyzed the markets. Now we need to select the right direction.
Stock market. The right direction may not always be found on the stock market.
When trading in the long direction, swap is acting against you. This means you have to pay for moving a position to the next day. The sum which you are charged can be so large, that swaps for several months that you hold a position can be comparable with the expected Take Profit of this position.
Although, some brokers offer long spread much lower than short spread. This swap amount can be small enough if compared with the Take Profit value. In this case buying of shares is preferable.
When trading short, you are also charged swaps (depending on your broker) or can lose on dividends. For short positions, you are charged dividends, not paid. Therefore, when trading short, it is recommended to select the shares without dividends, or enter a position after this payment of related dividends.
Another reason why time before the payment of dividends is unfavorable for short positions is that many traders will buy a share to earn dividends. This means that there is a probability for the stock price to increase.
Other markets. In other markets, it is recommended to chose a favorable directions. That is the direction with positive swap. In this case, you will be paid for each position holding day.
However, there is no unified list of such symbols. Some brokers pay positive swaps for short positions of certain instruments. Other brokers provide negative short swap for the same symbols.
Therefore, before using the martingale strategy, make sure that your broker provides positive swap in the direction you are going to trade.
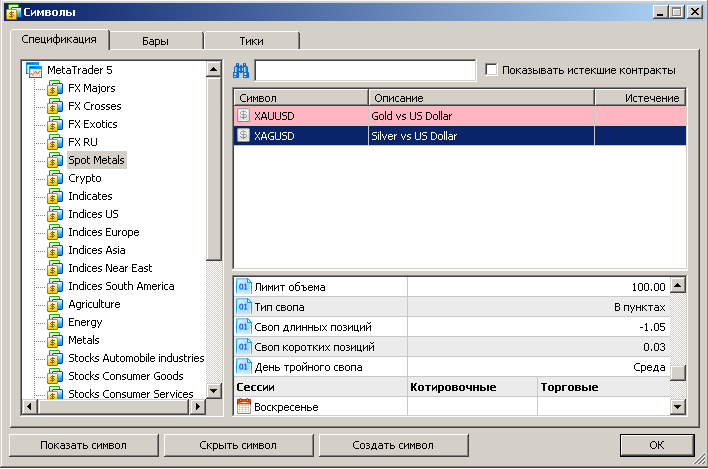
To check the swap open the Symbols window of your terminal (Ctrl+U). After that select the desired symbol and find Long swap and Short swap in its settings:
But checking all symbols manually is not convenient. Therefore, let us revise the symbol selection and navigation utility, which was discussed in the following articles:
- Developing the symbol selection and navigation utility in MQL5 and MQL4
- Selection and navigation utility in MQL5 and MQL4: Adding "homework" tabs and saving graphical objects
Let us add a new enum type input Hide if the swap is negative, with the values of Do not hide, Long and Short:
enum NegSwap
  {
   neg_any,//Do not hid
   neg_short,// Short
   neg_long,// Long
  };

input NegSwap        hideNegSwap=neg_any; // Hide if the swap is negative
To enable the use of this parameter, let us add the following symbol filtering code in the skip_symbol function:
   if(hideNegSwap==neg_short && SymbolInfoDouble(name, SYMBOL_SWAP_SHORT)<0){
      return true;
   }else if(hideNegSwap==neg_long && SymbolInfoDouble(name, SYMBOL_SWAP_LONG)<0){
      return true;
   }
This revised utility version is attached below.
Now we can easily see the list of symbols, for which the broker provides positive long or short swap.
As an example, let us compare lists of instruments having positive swap, offered by three different brokers.
- The first broker; positive or zero Long swap: USDJPY, SurveyMonkey (zero Long swap for stocks, which is a very rare case), XMRBTC, ZECBTC.
- The second broker; positive or zero Long swap: AUDCAD, AUDCHF, AUDJPY, CADCHF, CADJPY, GBPCHF, NZDCAD, NZDCHF, NZDJPY, USDCHF, USDDKK, USDNOK, USDSEK.
- The third broker; positive or zero Long swap: AUDCAD, AUDCHF, AUDJPY, AUDUSD, CADJPY, NZDCAD, NZDCHF, NZDJPY, NZDUSD, USDJPY.
- The first broker; positive or zero Short swap: EURMXN, USDMXN, XAGUSD, XAUUSD, BRN, CL, HO, WT, cryptocurrencies and stocks.
- The second broker; positive or zero Short swap: EURAUD, EURNZD, EURRUR, GBPAUD, GBPNZD, GOLD, SILVER, USDRUR, USDZAR, GBPUSD, EURUSD.
- The third broker; positive or zero Short swap: EURAUD, EURNZD, EURPLN, GBPAUD, GBPNZD, GBPUSD, USDPLN, USDRUB.
As you can see, the lists do not match.
Choosing symbols for trading extremes
We have defined two factors to pay attention to when selecting a symbol for martingale trading.
The first factor is the market. Forex is the most suitable market for the martingale strategy, therefore we will work with Forex symbols.
Another aspect is the positive swap in the desired direction. Since we open a position for an indefinite time, it is important to have the time favorable for us.
Since different brokers provide different sets of symbols having positive swap, we will choose the instruments which have positive swap with one of the above brokers.
There is one more aspect to be taken into account. This is the current symbol price. If the current symbol trading time is close to the historic minimum, opening long-term short positions wouldn't be reasonable.
Short positions can be opened if an instrument price is in the middle of the price range, in which it is traded 90% of time, or is above this middle.
To trade long, the instrument should be below the middle of this range.
Let us view a few examples.
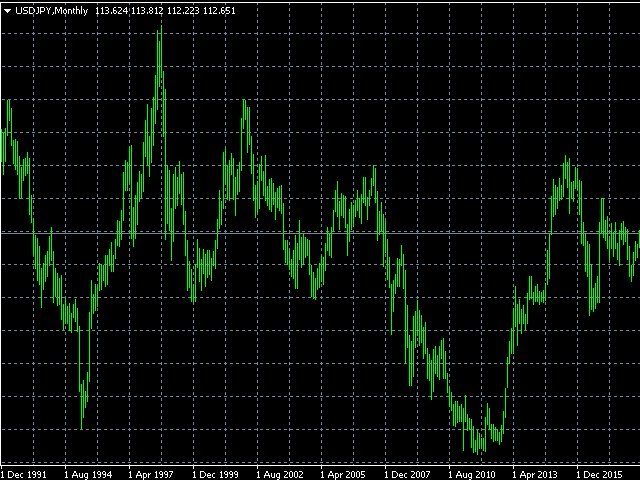
One of them is the USDJPY chart, which was mentioned above. The price is about the middle of the range. One of the brokers provides a positive long swap. So, we can try to trade long using the martingale system. If the price were at least one square lower, that would be even better:
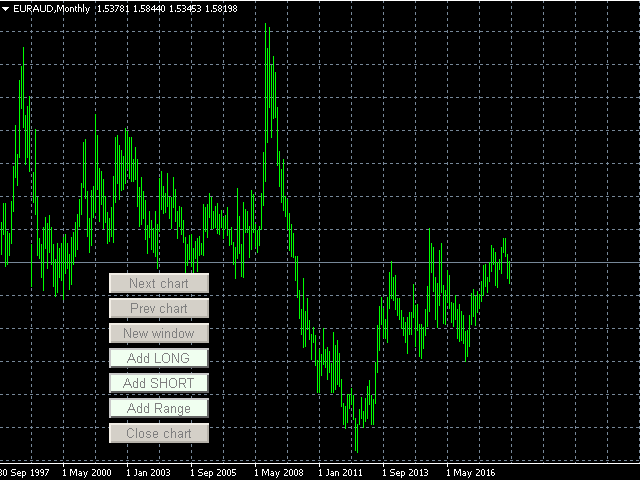
EURAUD is also about the middle of its movement range, straight below a strong resistance level. Let us try short trading, since many brokers offer positive spread for that direction. We can start right now or wait for the price to move a square upwards.
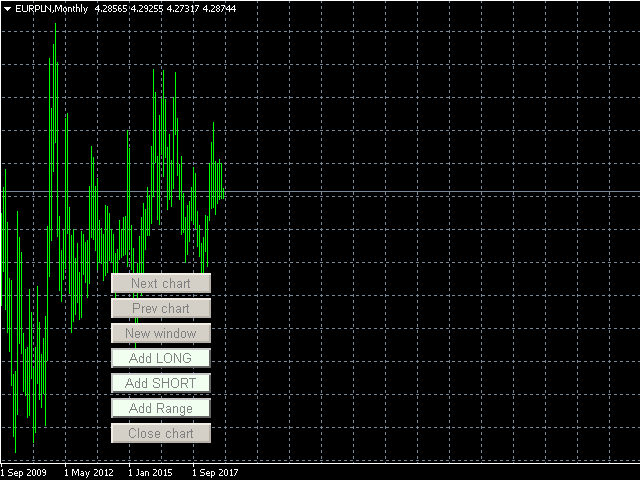
EURPLN is above the range middle and has positive short swap with some brokers:
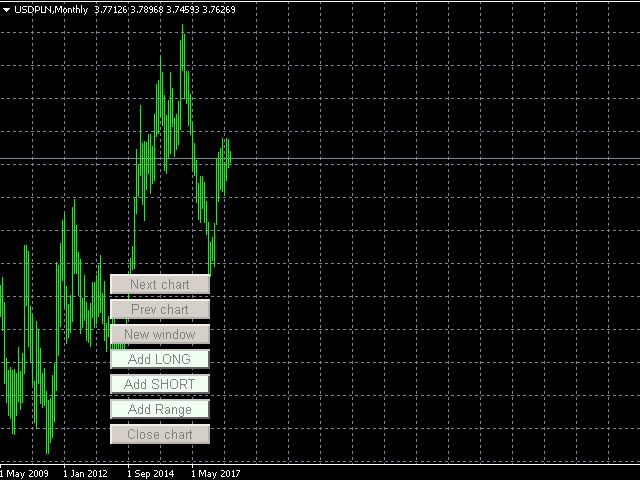
The price position of USDPLN is even better than that of EURPLN. We can trade short:
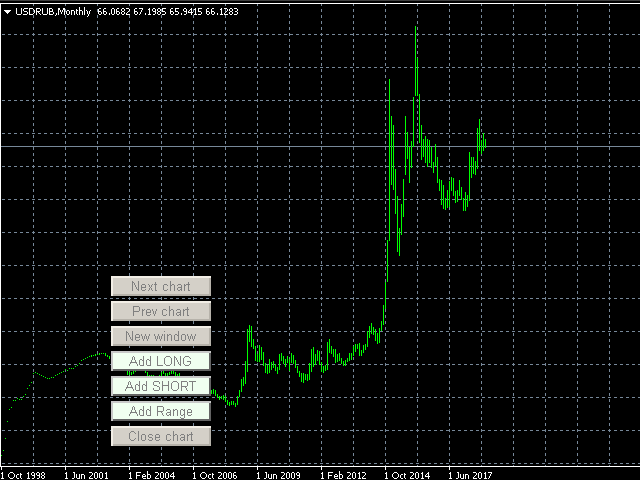
USDRUB, also short:
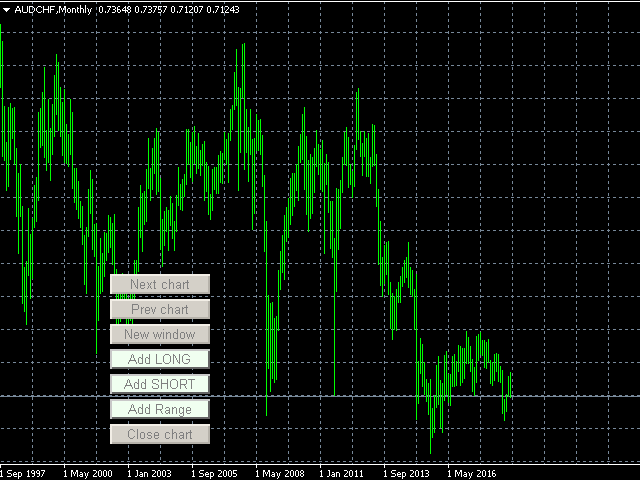
Some brokers offer positive long swap for AUDCHF, while the price is near the range minimum:
Next let us consider some other trading possibilities.
Creating a grid
The next step to do is to determine the following:
- our funds;
- the amount used for the first deal;
- when to open further deals if the price goes in the unfavorable direction;
- the maximum number of trades.
When using the martingale system, we should always be prepared for the situation when the price moves in the unfavorable direction. In this case, the volume of the next increase step should not be less than the previous one. Bearing this in mind, as well as based on the maximum number of position increase steps, we will calculate the first deal volume. Do not forget about the maintenance margin, which is frozen on the account for trading operations. Make sure to have extra free balance at the last increase step, for an unforeseen event. It is more preferable to have the free balance enough for one more martingale chain, in case the current one ends up with a Stop Loss.
As a rule, the Take Profit value is equal to Stop Loss in martingale trading. It can also be place at a distance equal to 1 up to 2 Stop Loss values. Taking into account the Take Profit, you can select the position increase volume so that it would allow to cover losses in case of market correction or reversal. The greater the volume of the follow-up deals, the earlier you will cover losses. But larger volumes require larger balance. Moreover, your loss in case of the continued movement in the wrong direction will be higher.
When talking about Stop Loss, here we mean opening a new position without closing an old one. So the actual Stop Loss is not performed until we reach the maximum number of steps.
All our considerations are theoretical without testing. However, let us set the maximum number of deals in a chain to 7. It means that we are ready to open 7 deals, expecting that the price will eventually turn in the favorable direction.
The Take Profit size will be equal to Stop Loss. TheStop Loss will be set to 1 dollar. For convenience, the first deal volume will be equal to 1 lot.
| Step | Lot | Gross loss | Profit, 1 to 1 |
|---|---|---|---|
| 1 | 1 | -1 $ | 1 $ |
| 2 | 1 | -3 $ | 1 $ |
| 3 | 2 | -7 $ | 1 $ |
| 4 | 4 | -15 $ | 1 $ |
| 5 | 8 | -31 $ | 1 $ |
| 6 | 16 | -63 $ | 1 $ |
| 7 | 32 | - 127 $ | 1 $ |
Here is a geometric progression in the minimum lot size, which must be additionally bought in relation to the starting lot. At the 7th step, we lose 127 times more than we can earn. As you can see, the use of the classical martingale can lead to complete deposit loss.
If we set Take Profit 2, 3 or more times larger than the Stop Loss size, follow-up deals can be much smaller, so the total loss on the entire chain will be reduced. However, this would not allows us to profit from corrections. In this case we would have to wait for market reversals, which may not happen in some cases.
As an example, let us consider the minimum necessary deal volumes, if the Take Profit is twice as large as Stop Losses.
| Step | Lot | Gross loss | Profit, 2 to 1 |
|---|---|---|---|
| 1 | 1 | -1 $ | 2 $ |
| 2 | 1 | -3 $ | 3 $ |
| 3 | 1 | -6 $ | 3 $ |
| 4 | 1 | -10 $ | 2 $ |
| 5 | 2 | -16 $ | 2 $ |
| 6 | 3 | -25 $ | 2 $ |
| 7 | 4 | -38 $ | 1 $ |
The difference is striking. Instead of the ratio of 127 to 1, we get a much smaller ratio of 38 to 2 (on average). However, the chances of hitting Stop Loss are higher in this case.
If Take Profit is 3 times larger than Stop Loss, the total profit is reduced further and is equal to about 29 to 4.
| Step | Lot | Gross loss | Profit, 3 to 1 |
|---|---|---|---|
| 1 | 1 | -1 $ | 3 $ |
| 2 | 1 | -3 $ | 5 $ |
| 3 | 1 | -6 $ | 6 $ |
| 4 | 1 | -10 $ | 6 $ |
| 5 | 1 | -15 $ | 5 $ |
| 6 | 1 | -21 $ | 3 $ |
| 7 | 2 | -29 $ | 3 $ |
As you can see, by setting a larger Take Profit, we can reduce the chances of losing the entire deposit. But in this case, a deal should be entered when you have every reason to believe that the price will move in the desired direction now or in the near future. It means that the Take Profit to Stop Loss ratio of greater than 2 to 1, is better suitable for trading in the trend direction or from the range borders towards its middle.
Distance between positions. Another yet unanswered question is the distance for opening a new deal if the price goes in the unfavorable direction. The right way would be to use levels, which were previously formed on the chart. But in this case distances between trades will not be equal and it will be much more difficult to calculate the new deal volume.
Therefore it is better to use equal intervals between deals, as it was done in the above tables. To avoid complicated calculations, distance can be determined by the chart grid. If you look closer, you can see that the range boundaries are often located just at the borders of the squares.
Parameters of instruments for which you can open long-term positions
Let us try to find symbol charts, where we can open positions with the minimum risk right now or a bit later. And after that we will plot on the charts possible points for additional buy deals.
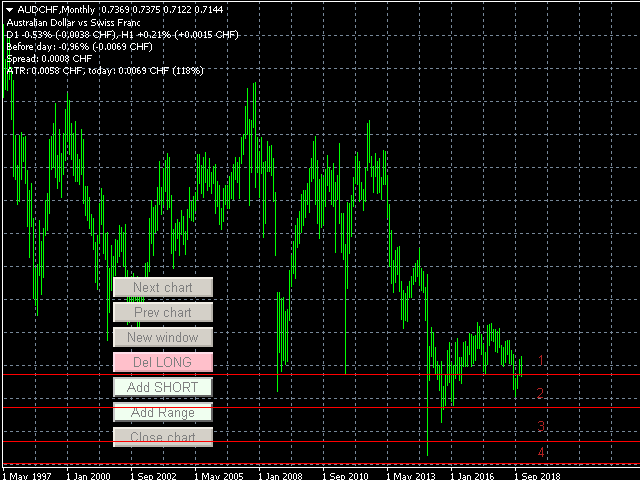
AUDCHF long trading. There is enough space for only 4 buy deals. But if the price moves even lower, more deals can be added. Although the chart is pointed downwards, with the profit to loss ratio equal to 1:1 the price can go the necessary distance on the first of further deals.
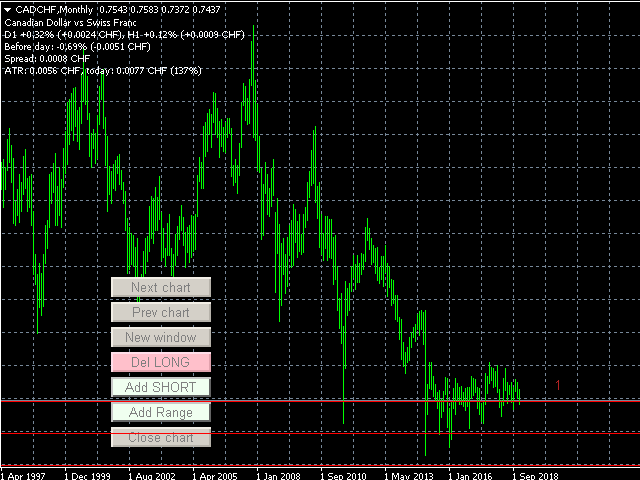
CADCHF long trading. The situation is similar, but the price is even lower than that of AUDCHF.
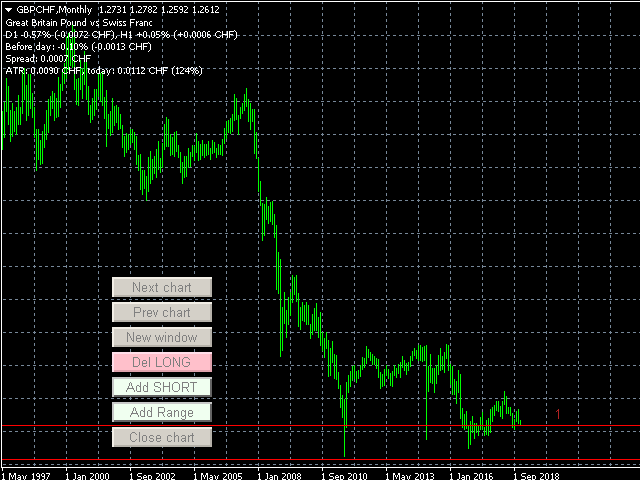
GBPCHF long trading. Here the price is very close to the minimum.
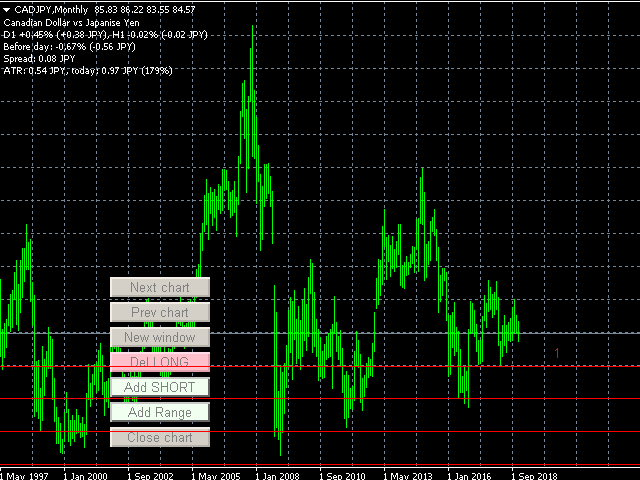
CADJPY long trading. In this case it is better to wait till the price moves one square down, and then to try to perform a buy operation.
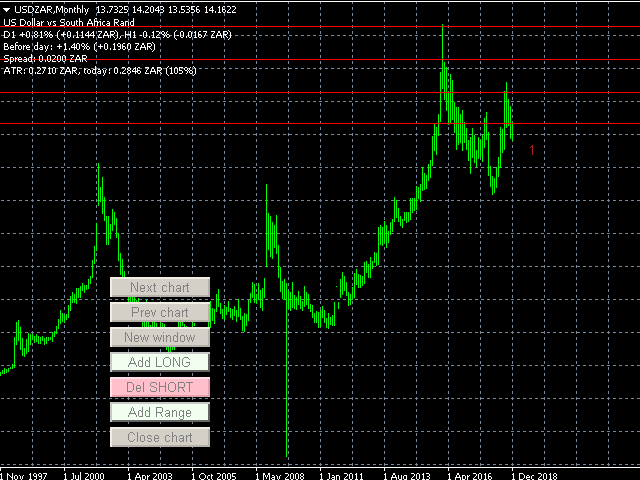
USDZAR short trading:
Using martingale in short and medium term trading
The martingale can be used not only for long-term trading. Any range in which the symbol is being traded, can be divided into similar deal levels. The possibility of earning profit remains until the symbol exits its current range. When working in short-term ranges, you can set the profit to loss ratio equal to 3:1 or more.
The number of steps is set here for demonstration purposes. You can use less steps, in which case closing of the entire chain by Stop Loss would be less crucial.
For example, if the profit to loss ratio is 3:1 and you have 4 steps in a chain, you can make 2 positive deals to cover the loss of an unsuccessful chain
If a chain has only 3 steps, losses can be covered by one profitable deal. This is the deal which first goes in the wrong direction but is eventually closed by Take Profit. The same loss can be covered by 2 deals, if they instantly go in the right direction.
Testing automated trading using RevertEA
Since the RevertEA Expert Advisor which was earlier created for testing the reversing strategy (Reversing: The holy grail or a dangerous delusion? and Reversing: Reducing maximum drawdown and testing other markets, and Reversing: Formalizing the entry point and developing a manual trading algorithm), supports trading using the martingale technique, let us try to test this trading strategy in the automated mode.
We do not set the price, above or below which the EA is allowed to enter a position. It will perform entries whenever there are no open positions for the tested symbol.
Another difference of the EA operation from the above examples, is that it will use Stop Losses. I.e. if the price goes in the wrong direction, the EA will close the previous deal and will open a new one at a better price.
Expert Advisor settings. Let us set the following parameter for the optimization of RevertEA:
- Stop Loss action: martingale (open in the same direction);
- Lot size: 0.01;
- Deal volume increase type;
- Stop Loss type: in points;
- Take Profit type: Stop Loss multiplier;
- Take profit: from 1 to 2 with an increment of 0.1;
- Max. lot multiplier during reversing and martingale: 8.
The optimization mode: M1 OHLC. After that the best testing result will be additionally tested in the Every tick based on real ticks mode. See the resulting profitability chart below.
Testing period: from year 2006.
Testing results. Testing results cannot be called impressive. Only Brent showed an interesting profit chart. In all other symbols, the use of martingale without any limitation on first position opening is not the best solution. On the other hand, we avoided total deposit loss.
USDJPY long trading, Take Profit is equal to 1.9 * Stop Loss, Stop Loss is equal to 100 points:
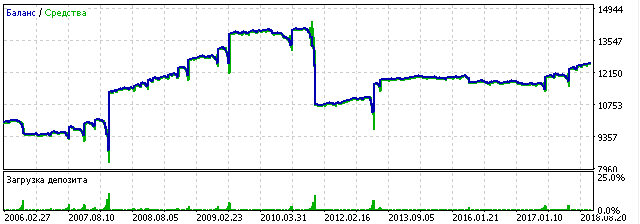
GBPAUD short trading, Take Profit is equal to Stop Loss, Stop Loss is equal to 120 points:
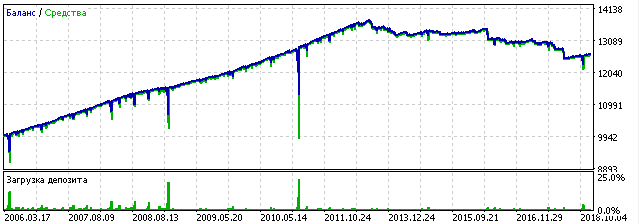
EURUSD short trading, Take Profit is equal to 1.3 * Stop Loss, Stop Loss is equal to 110 points:
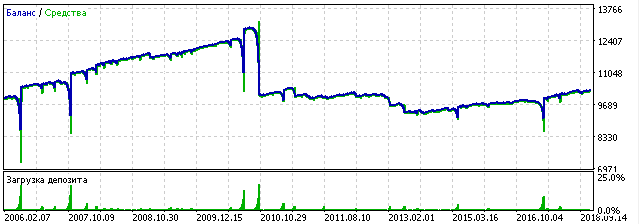
EURAUD short trading, Take Profit is equal to 1.6 * Stop Loss, Stop Loss is equal to 80 points:
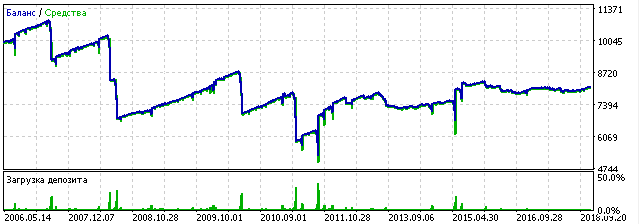
Finally, let us test Brent oil short trading, with the Take Profit level equal to 1.1 * Stop Loss, while Stop Loss is 200 points:
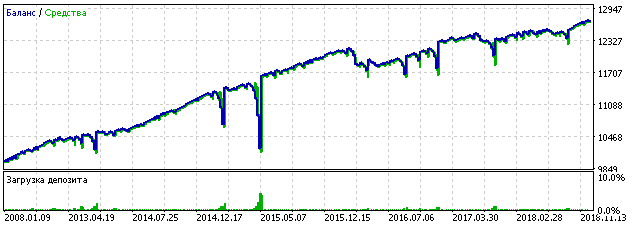
All the Strategy Tester reports, as well as SET-files with testing parameters are attached below.
Conclusion: is the Martingale technique worth using?
All considerations given in this article are theoretical. As can be seen from testing results, the automated use of martingale without appropriate rules does not always leads to good profit.
However, I believe that taking a more serious approach to developing a martingale based trading strategy, including position entering at a more appropriate price, could help to earn some profit. The advantage of such systems, is that you need to invest in trading a minimum of time, as compared with other systems which require constant monitoring.
Attachments
The following files are attached herein:
- _finder4.mq4, _finder4.ex4, _finder.mq5, _finder.ex5: version 1.2 of the utility application used for symbol selection and navigation for MetaTrader 5 and MetaTrader 4;
- RevertEA.zip: version 1.3 of the Expert Advisor for MetaTrader 5;
- tests.zip: Strategy Tester reports;
- SETfiles.zip: SET file with the RevertEA parameters.
Translated from Russian by MetaQuotes Ltd.
Original article: https://www.mql5.com/ru/articles/5269
Warning: All rights to these materials are reserved by MetaQuotes Ltd. Copying or reprinting of these materials in whole or in part is prohibited.
This article was written by a user of the site and reflects their personal views. MetaQuotes Ltd is not responsible for the accuracy of the information presented, nor for any consequences resulting from the use of the solutions, strategies or recommendations described.
 Practical Use of Kohonen Neural Networks in Algorithmic Trading. Part II. Optimizing and forecasting
 Horizontal diagrams on MеtaTrader 5 charts
 Applying Monte Carlo method in reinforcement learning
 Analyzing trading results using HTML reports
- Free trading apps
- Over 8,000 signals for copying
- Economic news for exploring financial markets
You agree to website policy and terms of use
How many times must Martingale be completely discredited before people stop writing about using it?
It's an absurd failed betting strategy from the 1800's that is provably idiotic.
How many times must Martingale be completely discredited before people stop writing about using it?
It's an absurd failed betting strategy from the 1800's that is provably idiotic.
What is wrong about discussing Martingale and which strategy is less absurd than Martingale given that more than 90% of traders loose money trading with indicators supplied with MT4/MT5 and other platforms? 😥
BTW, what appears discredited by the masses many times is simply not correctly used by the masses.
Or do you have the secret formula?
I think generally martingales can work long term, but a number of factors need to be considered and optimization of the system needs to be implemented.
Using a martingale strategy myself I've learnt that a large deposit is needed, even for 0.01 lots. It'll give the system room to breath when markets suddenly trend for days without the needed pullback. I personally have a rule of no less than $3000/0.01 lot - this is conservative but gives me fewer headaches.
Moreover the opening of a new trade/batch should be improved upon. This is where indicators come in (or smart price action) - personally I think the H1 og H4 RSI could work to help with the direction of the next batch of trades. I don't want the system to open a new buy order when RSI is fx. > 60 or a new sell order when RSI is < 40. RSI levels are generally respected on H1 and H4 and the system should have room to breath from RSI 40 down to 20 or RSI 60 up to 80 (as an example) which should help keep the DD to a minimum.
Other ways of reducing risk would be to implement a loss minimization rule - when max no. of orders is reached the system should go into loss prevention/minimization mode. That my be implementing a tight trailing stop if/when it goes into profit but still has a way to go before hitting TP. One could also implement a rule based on supply/demand zones where the system closes in loss when/if the current open trades reaches these levels if the TP level is on the wrong side of the supply/demand zones. The batch will close in loss, but account is saved.
I hope this discussion is still open and if there are any MQL developers out there I'd be happy to discuss implementing these and testing.
/Christopher