
Resolving entries into indicators

Introduction
When looking at successful trader’s series of profitable trades, do you happen to have a wish to follow his strategy? Or while looking through your trading history, you might think of how you could get rid of loss trades? I believe, many of you will answer at least one of the questions positively. In this article, I want to suggest methods of resolving trade histories into indicators, besides I will share how to choose the indicators which will help to increase trade performances.
1. Problem definition
In my previous article, I told about constructing the Kalman's filter based Expert Adviser. During testing, it demonstrated profit, but at the same time it demonstrated two strategy bottlenecks: late exit and a number of loss trades in flat.
Thus, our aim is to reduce the number of loss trades under this strategy. To do so, save values of a number of indicators at the moment of position opening. Then, make analysis and compare values of indicators with trade results. The rest is to choose between the indicators which will help to improve trading performances.
First, make an action plan.
- Determine the testing period. Test it and save a report.
- Parse the testing report and make an array of trades (with operation results).
- Determine the list of indicators to be used and data save format. Prepare classes for further application.
- Prepare report forms for result output.
- Build up analytical EA.
- Start analytical EA in strategy tester and analyze reports.
- Add necessary indicators into the EA.
- Test the updated EA and compare results.
2. The first testing of the analyzed EA
In the abovementioned article, the EA made 150 trades within one month of testing. This is insufficient for statistical analysis. For the purpose of representativeness of results, increase the testing period by eight times. Without any optimization, set a period for construction of an autoregressive function of 3,120 bars (about 3 months) and start the test.


Upon testing results we received an obviously loss balance graph, where after 1-2 profitable trades a number of loss ones follows. In general, a share of profitable trades constituted a bit less than 34%. Although, the average profit exceeds the average loss by 45%. This is insufficient to obtain profit throughout the testing period.

The price chart shows that at the absence of a clearly defined trend (in flat), the EA opens and closes positions with loss. Our task is to reduce the number of such trades and, where possible, to exclude them completely.

First of all, the testing report should be saved for further processing. However, there is a nuance: for security reasons, in MQL5 work with files is strictly controlled. Make sure that the files for performing operations by means of MQL5 tools are in the "sandbox" file. Therefore, the report must be saved therein. But since we will start the program in the Strategy tester, we must take into account that each agent works in its “sandbox”. Consequently, so that during testing at any agent the program could gain access to the report, we will save it in the shared terminal folder.
To find out the path to client terminal shared folder, open “File” menu in MetaEditor and select "Open Common Data Folder".

In the opened window, enter “Files” folder.

Then copy the full path line to the exchange buffer by pressing "Ctrl+C".

Path to “sandbox” is known and now we can save our test report. For doing this, in "Strategy Tester” choose "Result” and in any space thereof click the right mouse button. In the appearing menu, choose "Report" -> "HTML (Internet Explorer)".

After performing these operations, a system window for file saving will open. Firstly, put the path to our “sandbox” into file name input field and press “Save”. This operation will change folder for file saving.

At the following step, specify the name under which the testing report will be saved and save the file.

After saving the report in the “sandbox”, proceed to the following phase of our work - making a trade array for subsequent analysis.
3. Make the trade array
3.1. General concept of parsing
In the previous section, we saved EA testing report. Now we are going to form out of it a trade array convenient for processing. In the browser, we see a list of trades but MQL5 programs cannot download a data array directly from an html file. Thus, report parsing shoud be implemented.

Substantially, an html file is a text divided by tags which describe its formatting and design. Having opened the report in a text editor you can easily find there 2 tags "<table>”, which means that all data in the report are divided into 2 data tables. Information on trades is in the 2nd table. In its beginning there is info on orders and then - info on trades.

Table rows are marked up by tags "<tr>...</tr>". Within rows, the info is divided into cells by tags "<td>...</td>".
3.2. Class for saving info of a trade
We have determined data presentation format in the report. Now let’s proceed to data saving format in our array. So far as the analyzed EA operates only at one symbol, the symbol name may not be saved. Nevertheless, we will need it for indicator initialization. Finally, the record structure for the trade will have the following positions:
- position open time;
- position open volume;
- trade direction;
- position close volume;
- commission amount;
- swap amount;
- profit amount.
We have determined main aspects of this work stage. Let’s start writing the code. Firstly, make a deal class CDeal.
class CDeal       :  public CObject
  {
private:
   datetime          OpenTime;         // Time of open position
   double            OpenedVolume;     // Volume of opened position
   ENUM_POSITION_TYPE Direct;          // Direct of opened position
   double            ClosedVolume;     // Closed volume
   double            Comission;        // Comission to position
   double            Swap;             // Swap of position
   double            Profit;           // Profit of position

public:
                     CDeal();
                    ~CDeal();
  };
We will initialize the class when recording a new open trade, when time of position opening, volume and direction of the trade will be already known. Therefore, to parameters of initialization function their values and commission (if available) will be conveyed. Zero other parameters at initialization. As a result, class initialization function will look as follows:
CDeal::CDeal(ENUM_POSITION_TYPE type,datetime time,double volume,double comission=0.0)  : ClosedVolume(0),
                                                                                          Swap(0),
                                                                                          Profit(0)
  {
   OpenTime      = time;
   OpenedVolume  = volume;
   Direct        = type;
   Comission     = comission;
  }
In further work, we will need to check the state of already saved trades. For doing this, make IsClosed function where check whether a trade is already closed in the base. Volumes of trade opening and closing will be compared in it. If they are equal, it means that the trade is closed and the function will return “true” value. If a trade is not closed the function will return “false” and the volume remaining in the market.
bool CDeal::IsClosed(double &opened_volume)
  {
   opened_volume=OpenedVolume-ClosedVolume;
   return (opened_volume<=0);
  }
In case we need to check only the state of a trade and there is no necessity to find out the unclosed volume, make one more function with the same name.
bool CDeal::IsClosed(void)
  {
   double opened_volume;
   return IsClosed(opened_volume);
  }
In order to close a trade correctly, we should know its type. The Method “Type” will return the value of the “private” variable “Direct”. The function is rather short, therefore it can be re-written in class body.
ENUM_POSITION_TYPE Type(void) { return Direct; }
After the status is checked, unclosed trades should be closed. For doing this create “Close” function. The following parameters will be passed to it: closing volume, trade profit, commission and cumulative swap. The function will return “false” if the volume passed exceeds unclosed trade volume. In other cases the passed parameters will be saved into corresponding class variables and the function will return “true”.
bool CDeal::Close(double volume,double profit,double comission=0.0,double swap=0.0)
  {
   if((OpenedVolume-ClosedVolume)<volume)
      return false;
   ClosedVolume   += volume;
   Profit         += profit;
   Comission      += comission;
   Swap           += swap;
   return true;
  }
In furtherance, when analyzing trades we will need a function which upon a request will return trade profit. Let’s call this function GetProfit.
double CDeal::GetProfit(void)
  {
   return (Comission+Swap+Profit);
  }
As well, for timely receipt of data on indicator status we will need to know the trade time. For this purpose, create “GetTime” function.
datetime GetTime(void) { return OpenTime; }
3.3. Class of report parsing
After creating a class to store info about each trade, let’s proceed immediately to report parcing. For doing this, create “CParsing” class. In the class determine:
- object of class CArrayObj - to store trade array;
- object of class CFileTxt - to work with report file;
- variable of string type - to store symbol name.
Apart from initialization and deinitialization functions, two more functions will be in the class:
- ReadFile — immediately for parsing;
- GetSymbol — return symbol name upon request.
class CParsing
  {
private:
   CArrayObj        *car_Deals;     //Array of deals
   CFileTxt         *c_File;        //File to parsing

   string            s_Symbol;      //Symbol of deals

public:
                     CParsing(CArrayObj *&array);
                    ~CParsing();

   bool              ReadFile(string file_name);
   string            GetSymbol(void)   {  return s_Symbol;  }
  };
The main purpose of functions of this class is to create trade array for further processing. It means that the created array must be available to work in the main program. For this purpose, object of CArrayObj class for trade array storage will be declared in the main program, and a link to it will be passed to the class at initialization. As a result, initialization function will look as follows:
CParsing::CParsing(CArrayObj *&array)  :  s_Symbol(NULL)
  {
   if(CheckPointer(array)==POINTER_INVALID)
     {
      array=new CArrayObj();
     }
   car_Deals=array;
  }
Deletion of CFileTxt class object will be written to deinitialization function. File closing is specified in deinitialization function of CFile parent class, we will not provide it here.
CParsing::~CParsing()
  {
   if(CheckPointer(c_File)!=POINTER_INVALID)
      delete c_File;
  }
Let us proceed immediately to parsing. At calling ReadFile parsing function in parameters specify the name of report file. The first thing we do in the function is checking whether the passed parameter is not empty. As well, check availability of array for saving info about trades. In case if at least one condition is not complied with, terminate function execution and return “false”.
bool CParsing::ReadFile(string file_name)
  {
   //---
   if(file_name==NULL || file_name=="" || CheckPointer(car_Deals)==POINTER_INVALID)
      return false;
Then initialize CFileTxt class object and try to open the file passed in function parameter. If an error occurs, exit from function with “false” result.
   if(CheckPointer(c_File)==POINTER_INVALID)
     {
      c_File=new CFileTxt();
      if(CheckPointer(c_File)==POINTER_INVALID)
         return false;
     }
   //---
   if(c_File.Open(file_name,FILE_READ|FILE_COMMON)<=0)
      return false;
After opening a file, read all its contents into “string” type variable. If a file is empty, exit from function with “false” result.
   string html_report=NULL;
   while(!c_File.IsEnding())
      html_report+=c_File.ReadString();
   c_File.Close();
   if(html_report==NULL || html_report=="")
      return false;
In the next stage, search a character which does not occur in report text and may be used as a separator. If such character is not available, exit from function with “false” result.
   string delimiter  =  NULL;
   ushort separate   =  0;
   for(uchar tr=1;tr<255;tr++)
     {
      string temp =  CharToString(tr);
      if(StringFind(html_report,temp,0)>0)
         continue;
      delimiter   =  temp;
      separate    =  tr;
      break;
     }
   if(delimiter==NULL)
      return false;
As it was said above in html-file structure tables are closed by "</table>". Let us replace this tag by our separator and divide the complete report into lines on it. In such a manner, we separate the required table into a separate line.
   if(StringReplace(html_report,"</table>",delimiter)<=0)
      return false;
   //---
   s_Symbol=NULL;
   car_Deals.Clear();
   //---
   string html_tables[];
   int size=StringSplit(html_report,separate,html_tables);
   if(size<=1)
      return false;
Having repeated this procedure with "</tr>”, we break the table into lines.
   if(StringReplace(html_tables[size-2],"</tr>",delimiter)<=0)
      return false;
   size=StringSplit(html_tables[size-2],separate,html_tables);
   if(size<=1)
      return false;
Now let us process the received string array in cycle. Firstly, pass through all the strings which contain info about orders. Whereas, we will be oriented by the line with text "Deals” which divides orders and trades in the report.
   bool found_start=false;
   double opened_volume=0;
   for(int i=0;i<size;i++)
     {
      //---
      if(!found_start)
        {
         if(StringFind(html_tables[i],"Deals",0)>=0)
            found_start=true;
         continue;
        }
After that, divide each line into cells and convert info into respective format.
      string columns[];
      int temp=StringFind(html_tables[i],"<td>",0);
      if(temp<0)
         continue;
      if(temp>0)
         html_tables[i]=StringSubstr(html_tables[i],temp);
      StringReplace(html_tables[i],"<td>","");
      StringReplace(html_tables[i],"</td>",delimiter);
      temp=StringSplit(html_tables[i],separate,columns);
      if(temp<13)
         continue;
      //---
      ENUM_POSITION_TYPE   e_direction =  (ENUM_POSITION_TYPE)(columns[3]=="buy" ? POSITION_TYPE_BUY : columns[3]=="sell" ?
 POSITION_TYPE_SELL : -1);
      if(e_direction==-1)
         continue;
      //---
      datetime             dt_time     =  StringToTime(columns[0]);
      StringReplace(columns[5]," ","");
      double               d_volume    =  StringToDouble(columns[5]);
      StringReplace(columns[8]," ","");
      double               d_comission =  StringToDouble(columns[8]);
      StringReplace(columns[9]," ","");
      double               d_swap      =  StringToDouble(columns[9]);
      StringReplace(columns[10]," ","");
      double               d_profit    =  StringToDouble(columns[10]);
      if(s_Symbol==NULL || s_Symbol=="")
        {
         s_Symbol=columns[2];
         StringTrimLeft(s_Symbol);
         StringTrimRight(s_Symbol);
        }
At the next stage, check whether the trade is a position closing operation. If the result is positive, close positions in our base according to FIFO method.
      if(opened_volume>0 && StringFind(columns[4],"out",0)>=0)
        {
         int total=car_Deals.Total();
         double total_volume=MathMin(opened_volume,d_volume);
         for(int d=0;(d<total && e_direction!=(-1) && total_volume>0);d++)
           {
            CDeal *deal=car_Deals.At(d);
            if(CheckPointer(deal)==POINTER_INVALID)
               continue;
            //---
            if(deal.Type()==e_direction)
               continue;
            //---
            double deal_unclosed=0;
            if(deal.IsClosed(deal_unclosed))
               continue;
            double close_volume     =  MathMin(deal_unclosed,total_volume);
            double close_comission  =  d_comission/d_volume*close_volume;
            double close_swap       =  d_swap/total_volume*close_volume;
            double close_profit     =  d_profit/total_volume*close_volume;
            if(deal.Close(close_volume,close_profit,close_comission,close_swap))
              {
               opened_volume  -= close_volume;
               d_volume       -= close_volume;
               total_volume   -= close_volume;
               d_comission    -= close_comission;
               d_swap         -= close_swap;
               d_profit       -= close_profit;
              }
           }
        }
Then check whether position opening operation was made. Where necessary, make a new trade in our base.
      if(d_volume>0 && StringFind(columns[4],"in",0)>=0)
        {
         CDeal *deal = new CDeal(e_direction,dt_time,d_volume,d_comission);
         if(CheckPointer(deal)==POINTER_INVALID)
            return false;
         if(!car_Deals.Add(deal))
            return false;
         opened_volume  += d_volume;
        }
     }
If at least one trade was saved the function will return “true” in the end, otherwise - “false”.
   return (car_Deals.Total()>0);
  }
Proceed to the next work phase.
4. Preparation of classes to work with indicators
As we have already said before, one of our tasks is to screen off loss trades in the absence of a clearly defined trend. A question of trend establishment is raised regularly, including in this website (for example, articles [3] and [4]). I do not pretend to discovery of some extraordinary methods of trend establishment. I just want to suggest a technology of comparison of performed trades and indicator values for subsequent analysis and conscious optimization of trading systems. Therefore, let us consider the most widespread indicators which are already available in the standard terminal distribution pack.
4.1. Class for ATR indicator inclusion
Oscillator type indicator “Average True Range” will be considered first. As we know, at trends market volatility grows. This is what the oscillator value growth will signal about. Which values will we need to save? So far as the EA analysed sets orders only on candle opening I suggest we should save indicator value on the last closed candle, as well as ratio of this value to the previous one. The first value will show current volatility and the second one will demonstrate dynamics of volatility alteration.
The indicator considered is a typical one for its class of one buffer indicators. Therefore, for us it makes sense to make a single class to work with indicators of this kind.
Approach to saving of indicator values will be analogical to that of trade saving: firstly, we will make a class for storing indicator values for one trade, then we will make a class of upper level for immediate work with the indicator on external requests and data saving to array.
Let’s call the first class as “CValue”. It will contain 3 private variables for storing information about indicator value (Value), ratio of two last values of indicator (Dinamic) and a number of order ticket for which values were being saved (Deal_Ticket). We will need ticket number for subsequent comparison of indicator values with orders during analysis. All the values required for saving will be passed into class instance at its initialization. In order to retrieve the required info create functions GetTicket, GetValue and GetDinamic, which will return values of respective variables. Additionally, create function GetValues which will simultaneously return indicator value and its dynamics.
class CValue       : public CObject
  {
private:
   double            Value;            //Indicator's value
   double            Dinamic;          //Dinamics value of indicator
   long              Deal_Ticket;      //Ticket of deal

public:
                     CValue(double value, double dinamic, long ticket);
                    ~CValue(void);
   //---
   long              GetTicket(void)   {  return Deal_Ticket;  }
   double            GetValue(void)    {  return Value;        }
   double            GetDinamic(void)  {  return Dinamic;      }
   void              GetValues(double &value, double &dinamic);
  };
Then, make the upper level class to store data array COneBufferArray. In “private” block it will contain array of data saved and indicator handle. Let me remind that we have decided to create a universal class to work with all the one-buffer indicators. But calling of different indicators is accompanied by a varying set of parameters. Therefore, in my opinion, the simplest variant will be to initialize an indicator in the main program and only after that to initialize class and to pass to it the handle of required indicator. For subsequent indicator identification let us introduce “s_Name” variable in the report.
class COneBufferArray   :  CObject
  {
private:
   CArrayObj        *IndicatorValues;     //Array of indicator's values

   int               i_handle;            //Handle of indicator
   string            s_Name;
   string            GetIndicatorName(int handle);

public:
                     COneBufferArray(int handle);
                    ~COneBufferArray();
   //---
   bool              SaveNewValues(long ticket);
   //---
   double            GetValue(long ticket);
   double            GetDinamic(long ticket);
   bool              GetValues(long ticket, double &value, double &dinamic);
   int               GetIndyHandle(void)  {  return i_handle;     }
   string            GetName(void)        {  return (s_Name!= NULL ? s_Name : "...");       }
  };
To save data by external request create SaveNewValues function which will contain only one parameter - order ticket. In the beginning of function check the state of array for data storage and indicator handle. In case of error function will return “false” value.
bool COneBufferArray::SaveNewValues(long ticket)
  {
   if(CheckPointer(IndicatorValues)==POINTER_INVALID)
      return false;
   if(i_handle==INVALID_HANDLE)
      return false;
After that we will receive data of indicator. If indicator values fail to be downloaded function will return false.
   double ind_buffer[];
   if(CopyBuffer(i_handle,0,1,2,ind_buffer)<2)
      return false;
In the next pace create “CValue” class instance and pass required values to it. In case of error at class instance creation the function will return false.
   CValue *object=new CValue(ind_buffer[1], (ind_buffer[0]!=0 ? ind_buffer[1]/ind_buffer[0] : 1), ticket);
   if(CheckPointer(object)==POINTER_INVALID)
      return false;
In case if the class does not yet know indicator name, we will get it from the chart, having called function GetIndicatorName (function code is provided in attachment).
   if(s_Name==NULL)
      s_Name=GetIndicatorName(i_handle);
In conclusion add to array the newly created data class instance and exit from function having returned operation result.
   return IndicatorValues.Add(object);
  }
In order to return data from array at request create function GetValue, GetDinamic and GetValues, which will return required values by order ticket number.
The full class code is provided in attachment.
I applied this class to collect data by indicators CCI, Volumes, Force, Chaikin oscillator and standard deviation.
4.2. Class for MACD indicator inclusion
Let’s add to our collection one more standard indicator - MACD. As we know, it is used to determine trend force and direction.
In contrast to earlier considered indicators, MACD has 2 indicator buffers (Main and Signal). Hence, we will save information about two lines as well. Using the algorithm shown for indicators above the class code for data storage will look as follows:
class CMACDValue      : public CObject
  {
private:
   double            Main_Value;        //Main line value
   double            Main_Dinamic;      //Dinamics value of main lime
   double            Signal_Value;      //Signal line value
   double            Signal_Dinamic;    //Dinamics value of signal lime
   long              Deal_Ticket;       //Ticket of deal

public:
                     CMACDValue(double main_value, double main_dinamic, double signal_value, double signal_dinamic, long ticket);
                    ~CMACDValue(void);
   //---
   long              GetTicket(void)         {  return Deal_Ticket;     }
   double            GetMainValue(void)      {  return Main_Value;      }
   double            GetMainDinamic(void)    {  return Main_Dinamic;    }
   double            GetSignalValue(void)    {  return Signal_Value;    }
   double            GetSignalDinamic(void)  {  return Signal_Dinamic;  }
   void              GetValues(double &main_value, double &main_dinamic, double &signal_value, double &signal_dinamic);
  };
Respective changes took place in the class for work with data array, also. As opposed to the universal class as described in section 4.1, this class will work with a certain indicator, therefore at class initialization it is not indicator handle which will be passed to it, but the parameters necessary for its initialization. Indicator initialization will be implemented immediately in the class.
class CMACD
  {
private:
   CArrayObj        *IndicatorValues;     //Array of indicator's values

   int               i_handle;            //Handle of indicator

public:
                     CMACD(string symbol, ENUM_TIMEFRAMES timeframe, uint fast_ema, uint slow_ema, uint signal, ENUM_APPLIED_PRICE applied_price);
                    ~CMACD();
   //---
   bool              SaveNewValues(long ticket);
   //---
   double            GetMainValue(long ticket);
   double            GetMainDinamic(long ticket);
   double            GetSignalValue(long ticket);
   double            GetSignalDinamic(long ticket);
   bool              GetValues(long ticket, double &main_value, double &main_dinamic, double &signal_value, double &signal_dinamic);
  };
The whole logic of functions remains the same, changes concern only the quantity of indicator buffers and variables saved.
bool CMACD::SaveNewValues(long ticket)
  {
   if(CheckPointer(IndicatorValues)==POINTER_INVALID)
      return false;
   if(i_handle==INVALID_HANDLE)
      return false;
   double main[], signal[];
   if(!CopyBuffer(i_handle,0,1,2,main)<2 || !CopyBuffer(i_handle,1,1,2,signal)<2)
      return false;
   CMACDValue *object=new CMACDValue(main[1], (main[0]!=0 ? main[1]/main[0] : 1), signal[1], (signal[0]!=0 ? signal[1]/signal[0] : 1), ticket);
   if(CheckPointer(object)==POINTER_INVALID)
      return false;
   return IndicatorValues.Add(object);
  }
Similar logic of scaling is applicable to any quantity of indicator buffers. If you want to save only selected indicator buffers, it is sufficient to describe it in SaveNewValues function of the respective class. However, I would not recommend to do it at this stage so far as yet we do not know whether there is interconnection between profit trades and values of certain indicator buffers and if it exists which its degree is.
In order to consolidate material, so to speak, let me render another example of saving indicator data with 3 data buffers.
4.3. Class for ADX indicator inclusion
ADX indicator is widely used to determine trend force and direction. It corresponds to our task and is rightly added to our “money-box”.
There are 3 indicator buffers in this indicator and according to the above suggested scaling method we increase the number of variables saved. Thus, data storage class will look as follows:
class CADXValue      : public CObject
  {
private:
   double            ADX_Value;        //ADX value
   double            ADX_Dinamic;      //Dinamics value of ADX
   double            PDI_Value;        //+DI value
   double            PDI_Dinamic;      //Dinamics value of +DI
   double            NDI_Value;        //-DIvalue
   double            NDI_Dinamic;      //Dinamics value of -DI
   long              Deal_Ticket;      //Ticket of deal

public:
                     CADXValue(double adx_value, double adx_dinamic, double pdi_value, double pdi_dinamic, double ndi_value, double ndi_dinamic, long ticket);
                    ~CADXValue(void);
   //---
   long              GetTicket(void)         {  return Deal_Ticket;     }
   double            GetADXValue(void)       {  return ADX_Value;       }
   double            GetADXDinamic(void)     {  return ADX_Dinamic;     }
   double            GetPDIValue(void)       {  return PDI_Value;       }
   double            GetPDIDinamic(void)     {  return PDI_Dinamic;     }
   double            GetNDIValue(void)       {  return NDI_Value;       }
   double            GetNDIDinamic(void)     {  return NDI_Dinamic;     }
   void              GetValues(double &adx_value, double &adx_dinamic, double &pdi_value, double &pdi_dinamic, double &ndi_value, double &ndi_dinamic);
  };
An increase in data to be stored will entail changes in a class of work with array.
class CADX
  {
private:
   CArrayObj        *IndicatorValues;     //Array of indicator's values

   int               i_handle;            //Handle of indicator

public:
                     CADX(string symbol, ENUM_TIMEFRAMES timeframe, uint period);
                    ~CADX();
   //---
   bool              SaveNewValues(long ticket);
   //---
   double            GetADXValue(long ticket);
   double            GetADXDinamic(long ticket);
   double            GetPDIValue(long ticket);
   double            GetPDIDinamic(long ticket);
   double            GetNDIValue(long ticket);
   double            GetNDIDinamic(long ticket);
   bool              GetValues(long ticket,double &adx_value,double &adx_dinamic,double &pdi_value,double &pdi_dinamic,double &ndi_value,double &ndi_dinamic);
  };
bool CADX::SaveNewValues(long ticket)
  {
   if(CheckPointer(IndicatorValues)==POINTER_INVALID)
      return false;
   if(i_handle==INVALID_HANDLE)
      return false;
   double adx[], pdi[], ndi[];
   if(!CopyBuffer(i_handle,0,1,2,adx)<2 || !CopyBuffer(i_handle,1,1,2,pdi)<2 || !CopyBuffer(i_handle,1,1,2,ndi)<2)
      return false;
   CADXValue *object=new CADXValue(adx[1], (adx[0]!=0 ? adx[1]/adx[0] : 1), pdi[1], (pdi[0]!=0 ? pdi[1]/pdi[0] : 1), ndi[1], (ndi[0]!=0 ? ndi[1]/ndi[0] : 1), ticket);
   if(CheckPointer(object)==POINTER_INVALID)
      return false;
   return IndicatorValues.Add(object);
  }
I believe now everyone understands the principle of building classes for work with indicators. Therefore, we will not describe the code for following indicators to save article volume. Similarly, to the “money-box” for analysis I added BW MFI and Alligator. Everyone willing can get familiarized with the full class code in attachment.
5. Prepare report forms for result output
After obtaining info from the concerned indicators at the moment of trade making, it is time we should think about analysis of obtained data. In my opinion, the most clearly will be to build charts of trade profit dependency on respective indicator values. I propose to build charts according to the technology suggested by Victor in article [2].
Let me make a reservation: so far as I implement optimization of a trade I will search dependencies of profit on indicator values. If a reader tries to repeat any trade, he needs to search dependencies between the quantity of trades and indicator values.
First, create the classes which will prepare info on each indicator.
5.1. Universal class of one-buffer indicators
A class to work with one-buffer indicators will be created first. Which information can we analyze? Remember that we saved the value of indicator buffer and dynamics of its alteration. Therefore, we can analyze:
- dependency of profit from performed operations on indicator values at the moment of position opening,
- impact of indicator line movement tendency on profit,
- as well, complex impact of indicator value and its dynamics on the result of performed operations.
For chart drawing, create class CStaticOneBuffer. This class will contain a reference to saved data array - DataArray, array of Value indicator values with the preset step d_Step, as well as two arrays of total profit separately for long and short positions. Pay attention: arrays for total profit calculation will be two-dimensional. The size of the first measurement will correspond to that of Value array. The second measurement will contain three elements: first one - for falling indicator dynamics, second one - for horizontal indicator movement and third one - for growing movement.
At class initialization, in parameters put a reference to data array and step size for indicator values.
class CStaticOneBuffer  :  CObject
  {
private:
   COneBufferArray  *DataArray;

   double            d_Step;                    //Step in values Array
   double            Value[];                   //Array of values
   double            Long_Profit[][3];          //Array of long trades profit, direct -> DOWN-0, EQUAL-1, UP-2
   double            Short_Profit[][3];         //Array of short trades profit, direct -> DOWN-0, EQUAL-1, UP-2

   bool              AdValues(double value, double dinamic, double profit, ENUM_POSITION_TYPE type);
   int               GetIndex(double value);
   bool              Sort(void);

public:
                     CStaticOneBuffer(COneBufferArray *data, double step);
                    ~CStaticOneBuffer();
   bool              Ad(long ticket, double profit, ENUM_POSITION_TYPE type);
   string            HTML_header(void);
   string            HTML_body(void);
  };
In initialization function, save passed values and zero the arrays being used.
CStaticOneBuffer::CStaticOneBuffer(COneBufferArray *data,double step)
  {
   DataArray   =  data;
   d_Step      =  step;
   ArrayFree(Value);
   ArrayFree(Long_Profit);
   ArrayFree(Short_Profit);
  }
For collecting statistical info create Ad function to which pass info about a trade. Respective indicator parameters will be inside the function and data will be saved to required array elements.
bool CStaticOneBuffer::Ad(long ticket,double profit,ENUM_POSITION_TYPE type)
  {
   if(CheckPointer(DataArray)==POINTER_INVALID)
      return false;

   double value, dinamic;
   if(!DataArray.GetValues(ticket,value,dinamic))
      return false;
   value = NormalizeDouble(value/d_Step,0)*d_Step;
   return AdValues(value,dinamic,profit,type);
  }
//+------------------------------------------------------------------+
//|                                                                  |
//+------------------------------------------------------------------+
bool CStaticOneBuffer::AdValues(double value,double dinamic,double profit,ENUM_POSITION_TYPE type)
  {
   int index=GetIndex(value);
   if(index<0)
      return false;

   switch(type)
     {
      case POSITION_TYPE_BUY:
        if(dinamic<1)
           Long_Profit[index,0]+=profit;
        else
           if(dinamic==1)
              Long_Profit[index,1]+=profit;
           else
              Long_Profit[index,2]+=profit;
        break;
      case POSITION_TYPE_SELL:
        if(dinamic<1)
           Short_Profit[index,0]+=profit;
        else
           if(dinamic==1)
              Short_Profit[index,1]+=profit;
           else
              Short_Profit[index,2]+=profit;
        break;
     }
   return true;
  }
For chart visualisation create functions HTML_header and HTML_body, in which pieces of the code of HTML-page header and body will be generated. Principles of building HTML-page code are detailed in article [2], let us not focus on it. The full function code is provided in attachment.
5.2. Class for displaying data of Bill Williams MFI indicator
The next let us consider Bill Williams MFI indicator. By the method of displaying on chart it resembles one-buffer indicators but there is a distinction: BW MFI also has color palette buffer which has a value, too. At the same time, as opposed to two-buffer indicators we are not interested in dynamics of color buffer alteration. Therefore, to above suggested charts of one-buffer indicators there will be added charts of profit dependence on indicator color as well as charts of complex impact of values and indicator dynamics subject to the current indicator color.
For collecting statistical data and creating analytical charts create class CStaticBWMFI. Class structure is analogical to that considered above. Changes concerned arrays of profit computation, now they have three dimensions. The third dimension obtained 4 elements according to the number of colors used.
class CStaticBWMFI  :  CObject
  {
private:
   CBWMFI           *DataArray;

   double            d_Step;                       //Step in values Array
   double            Value[];                      //Array of values
   double            Long_Profit[][3][4];          //Array of long trades profit, direct -> DOWN-0, EQUAL-1, UP-2
   double            Short_Profit[][3][4];         //Array of short trades profit, direct -> DOWN-0, EQUAL-1, UP-2

   bool              AdValues(double value, double _color, double dinamic, double profit, ENUM_POSITION_TYPE type);
   int               GetIndex(double value);
   bool              Sort(void);

public:
                     CStaticBWMFI(CBWMFI *data, double step);
                    ~CStaticBWMFI();
   bool              Ad(long ticket, double profit, ENUM_POSITION_TYPE type);
   string            HTML_header(void);
   string            HTML_body(void);
  };
Full class code is provided in attachment.
5.3. Class for displaying data of MACD indicator
Further, let’s consider MACD indicator. As you know, it has two buffers: histogram and Signal Line. Under rules of interpretation of this indicator signals, histogram value and movement direction is important, as well as position of Signal Line (above or below histogram). For comprehensive analysis, we will create a number of charts.
- Dependence of trade profit factor on values of histogram and its direction (separately and in complex).
- Dependence of trade profit factor on values of Signal Line and its direction.
- Dependence of profit on Signal Line position with respect to histogram.
- Dependence of profit on joint effect of values of histogram, its direction and Signal Line position with respect to histogram.
class CStaticMACD  :  CObject
  {
private:
   CMACD            *DataArray;

   double            d_Step;                       //Step in values Array
   double            Value[];                      //Array of values
   double            SignalValue[];                //Array of values
   double            Long_Profit[][3][3];          //Array of long trades profit, direct -> DOWN-0, EQUAL-1, UP-2
   double            Short_Profit[][3][3];         //Array of short trades profit, direct -> DOWN-0, EQUAL-1, UP-2
   double            Signal_Long_Profit[][3];      //Array of long trades profit, direct -> DOWN-0, EQUAL-1, UP-2
   double            Signal_Short_Profit[][3];     //Array of short trades profit, direct -> DOWN-0, EQUAL-1, UP-2

   bool              AdValues(double main_value, double main_dinamic, double signal_value, double signal_dinamic, double profit, ENUM_POSITION_TYPE type);
   int               GetIndex(double value);
   int               GetSignalIndex(double value);
   bool              Sort(void);

public:
                     CStaticMACD(CMACD *data, double step);
                    ~CStaticMACD();
   bool              Ad(long ticket, double profit, ENUM_POSITION_TYPE type);
   string            HTML_header(void);
   string            HTML_body(void);
  };
As you can see, class structure, name and designation of functions remained the same. Changes concerned only the content of functions with which you can get familiarized in attachment.
5.4. Class for displaying data of ADX indicator
The next one to consider is CStaticADX class. It will collect statistics by values of ADX indicator. Rules of indicator signal interpretation: line +DI shows positive movement force, -DI — negative movement force, and ADX - middle movement force. Proceeding from these rules we will build charts of dependencies:
- dependence of profit on +DI value, its direction and position with respect to ADX;
- dependence of profit on -DI value, its direction and position with respect to ADX.
Creating the class for statistics collecting I decided to collect a little bit more data. As a result I needed to save information about:
- indicator value;
- direction of lines;
- position with respect to the contrary movement line;
- direction of the contrary movement line;
- position with respect to ADX line;
- direction of ADX.
class CProfitData
  {
   public:
   double         Value;
   double         LongProfit[3]/*UppositePosition*/[3]/*Upposite Direct*/[3]/*ADX position*/[3]/*ADX direct*/;
   double         ShortProfit[3]/*UppositePosition*/[3]/*Upposite Direct*/[3]/*ADX position*/[3]/*ADX direct*/;

                  CProfitData(void)
                  {  ArrayInitialize(LongProfit,0); ArrayInitialize(ShortProfit,0);  }
                 ~CProfitData(void) {};
  };
//+------------------------------------------------------------------+
//|                                                                  |
//+------------------------------------------------------------------+
class CStaticADX  :  CObject
  {
private:
   CADX             *DataArray;

   double            d_Step;           //Step in values Array
   CProfitData      *PDI[][3];         //Array of values +DI
   CProfitData      *NDI[][3];         //Array of values -DI

   bool              AdValues(double adx_value, double adx_dinamic, double pdi_value, double pdi_dinamic, double ndi_value, double ndi_dinamic, double profit, ENUM_POSITION_TYPE type);
   int               GetPDIIndex(double value);
   int               GetNDIIndex(double value);
   bool              Sort(void);

public:
                     CStaticADX(CADX *data, double step);
                    ~CStaticADX();
   bool              Ad(long ticket, double profit, ENUM_POSITION_TYPE type);
   string            HTML_header(void);
   string            HTML_body(void);
  };
In other respects approaches and pricniples of building from previous classes were preserved. Full class code is provided in attachment.
5.5. Class for displaying data of Alligator indicator
In the end of this block let’s create a class for collecting statitstics of Alligator indicator. Signals of this indicator are based on three moving averages of different periods. Hence, when interpreting indicator signals certain values of indicator lines are of no importance to us. What is much more important is direction and position of lines.
In order to make indicator signals more specific let’s introduce trend determination by position of lines. If LIPS line is higher than TEETH, while TEETH is higher than JAW — consider BUY as a trend. If LIPS is lower than TEETH, while TEETH is lower than JAW — consider SELL as a trend. In case of absence of a strict order of lines consider the trend as indefinite or FLAT.
Respectively, dependence charts will be built from trend direction signals and dynamics of indicator lines.
Following the above specified input data create CStaticAlligator class. Principles of class building are taken from previous classes.
class CStaticAlligator  :  CObject
  {
private:
   CAlligator             *DataArray;

   double            Long_Profit[3]/*Signal*/[3]/*JAW direct*/[3]/*TEETH direct*/[3]/*LIPS direct*/;  //Array of long deals profit
   double            Short_Profit[3]/*Signal*/[3]/*JAW direct*/[3]/*TEETH direct*/[3]/*LIPS direct*/; //Array of short feals profit

   bool              AdValues(double jaw_value, double jaw_dinamic, double teeth_value, double teeth_dinamic, double lips_value, double lips_dinamic, double profit, ENUM_POSITION_TYPE type);

public:
                     CStaticAlligator(CAlligator *data);
                    ~CStaticAlligator();
   bool              Ad(long ticket, double profit, ENUM_POSITION_TYPE type);
   string            HTML_header(void);
   string            HTML_body(void);
  };
Full class code is provided in attachment.
6. Building the EA for info collection and analysis
Now, when all the preparatory work is completed, let’s create an EA which will be started immediately in strategy tester for information collection and output of analytical data. First of all, in the EA input parameters specify the name of testing report file for analysis, timeframe used and all the necessary parameters of indicators used.
input string            FileName          =  "Kalman_test.html"   ;
input ENUM_TIMEFRAMES   Timefarame        =  PERIOD_CURRENT       ;
input string            s1                =  "ADX"                ;  //---
input uint              ADX_Period        =  14                   ;
input string            s2                =  "Alligator"          ;  //---
input uint              JAW_Period        =  13                   ;
input uint              JAW_Shift         =  8                    ;
input uint              TEETH_Period      =  8                    ;
input uint              TEETH_Shift       =  5                    ;
input uint              LIPS_Period       =  5                    ;
input uint              LIPS_Shift        =  3                    ;
input ENUM_MA_METHOD    Alligator_Method  =  MODE_SMMA            ;
input ENUM_APPLIED_PRICE Alligator_Price  =  PRICE_MEDIAN         ;
input string            s3                =  "ATR"                ;  //---
input uint              ATR_Period        =  14                   ;
input string            s4                =  "BW MFI"             ;  //---
input ENUM_APPLIED_VOLUME BWMFI_Volume    =  VOLUME_TICK          ;
input string            s5                =  "CCI"                ;  //---
input uint              CCI_Period        =  14                   ;
input ENUM_APPLIED_PRICE CCI_Price        =  PRICE_TYPICAL        ;
input string            s6                =  "Chaikin"            ;  //---
input uint              Ch_Fast_Period    =  3                    ;
input uint              Ch_Slow_Period    =  14                   ;
input ENUM_MA_METHOD    Ch_Method         =  MODE_EMA             ;
input ENUM_APPLIED_VOLUME Ch_Volume       =  VOLUME_TICK          ;
input string            s7                =  "Force Index"        ;  //---
input uint              Force_Period      =  14                   ;
input ENUM_MA_METHOD    Force_Method      =  MODE_SMA             ;
input ENUM_APPLIED_VOLUME Force_Volume    =  VOLUME_TICK          ;
input string            s8                =  "MACD"               ;  //---
input uint              MACD_Fast         =  12                   ;
input uint              MACD_Slow         =  26                   ;
input uint              MACD_Signal       =  9                    ;
input ENUM_APPLIED_PRICE MACD_Price       =  PRICE_CLOSE          ;
input string            s9                =  "Standart Deviation" ;  //---
input uint              StdDev_Period     =  14                   ;
input uint              StdDev_Shift      =  0                    ;
input ENUM_MA_METHOD    StdDev_Method     =  MODE_SMA             ;
input ENUM_APPLIED_PRICE StdDev_Price     =  PRICE_CLOSE          ;
input string            s10               =  "Volumes"            ;  //---
input ENUM_APPLIED_VOLUME Applied_Volume  =  VOLUME_TICK          ;
Then declare instances of all the above described classes.
CArrayObj         *Deals;
CADX              *ADX;
CAlligator        *Alligator;
COneBufferArray   *ATR;
CBWMFI            *BWMFI;
COneBufferArray   *CCI;
COneBufferArray   *Chaikin;
COneBufferArray   *Force;
CMACD             *MACD;
COneBufferArray   *StdDev;
COneBufferArray   *Volume;
CStaticOneBuffer  *IndicatorsStatic[];
CStaticBWMFI      *BWMFI_Stat;
CStaticMACD       *MACD_Stat;
CStaticADX        *ADX_Stat;
CStaticAlligator  *Alligator_Stat;
6.1. EA initialization function
So far as our EA is designated for data analysis in strategy tester, first we check the environment in which it is started. If the start begins off the tester, its initialization must be aborted.
int OnInit()
  {
//---
   if(!MQLInfoInteger(MQL_TESTER) || MQLInfoInteger(MQL_OPTIMIZATION))
      return INIT_FAILED;
Then make parsing of data from testing report file. After data readout from the report the parsing class instance is not needed any more and we delete it from the memory.
   CParsing *Parsing =  new CParsing(Deals);
   if(CheckPointer(Parsing)==POINTER_INVALID)
      return INIT_FAILED;
   if(!Parsing.ReadFile(FileName) || CheckPointer(Deals)==POINTER_INVALID || Deals.Total()<=0)
     {
      delete Parsing;
      return INIT_FAILED;
     }
   delete Parsing;
After that carry out initialization of indicator classes.
//---
   ADX =  new CADX(_Symbol,Timefarame,ADX_Period);
   if(CheckPointer(ADX)==POINTER_INVALID)
      return INIT_FAILED;
//---
   Alligator =  new CAlligator(_Symbol,Timefarame,JAW_Period,JAW_Shift,TEETH_Period,TEETH_Shift,LIPS_Period,LIPS_Shift,Alligator_Method,Alligator_Price);
   if(CheckPointer(Alligator)==POINTER_INVALID)
      return INIT_FAILED;
//---
   int handle=iATR(_Symbol,Timefarame,ATR_Period);
   if(handle>0)
     {
      ATR      =  new COneBufferArray(handle);
      if(CheckPointer(ATR)==POINTER_INVALID)
         return INIT_FAILED;
     }
//---
   BWMFI    =  new CBWMFI(_Symbol,Timefarame,BWMFI_Volume);
   if(CheckPointer(BWMFI)==POINTER_INVALID)
      return INIT_FAILED;
//---
   handle=iCCI(_Symbol,Timefarame,CCI_Period,CCI_Price);
   if(handle>0)
     {
      CCI      =  new COneBufferArray(handle);
      if(CheckPointer(CCI)==POINTER_INVALID)
         return INIT_FAILED;
     }
//---
   handle=iChaikin(_Symbol,Timefarame,Ch_Fast_Period,Ch_Slow_Period,Ch_Method,Ch_Volume);
   if(handle>0)
     {
      Chaikin  =  new COneBufferArray(handle);
      if(CheckPointer(Chaikin)==POINTER_INVALID)
         return INIT_FAILED;
     }
//---
   handle=iForce(_Symbol,Timefarame,Force_Period,Force_Method,Force_Volume);
   if(handle>0)
     {
      Force    =  new COneBufferArray(handle);
      if(CheckPointer(Force)==POINTER_INVALID)
         return INIT_FAILED;
     }
//---
   MACD     =  new CMACD(_Symbol,Timefarame,MACD_Fast,MACD_Slow,MACD_Signal,MACD_Price);
   if(CheckPointer(MACD)==POINTER_INVALID)
      return INIT_FAILED;
//---
   handle=iStdDev(_Symbol,Timefarame,StdDev_Period,StdDev_Shift,StdDev_Method,StdDev_Price);
   if(handle>0)
     {
      StdDev   =  new COneBufferArray(handle);
      if(CheckPointer(StdDev)==POINTER_INVALID)
         return INIT_FAILED;
     }
//---
   handle=iVolumes(_Symbol,Timefarame,Applied_Volume);
   if(handle>0)
     {
      Volume   =  new COneBufferArray(handle);
      if(CheckPointer(Volume)==POINTER_INVALID)
         return INIT_FAILED;
     }
In closing of OnInit function set order counter to 0 and exit from the function.
   cur_ticket   =  0;
//---
   return(INIT_SUCCEEDED);
  }
6.2. Collection of statistical data
Collection of data regarding indicator state will be performed in OnTick function. In the beginning of the function check whether information on all the orders is collected. If yes, exit from the function.
void OnTick()
  {
   if(cur_ticket>=Deals.Total())
      return;
In the next step the time of performance of the trade analyzed is compared to the time of the tick processed. If the trade time has not come, exit from the function.
   CDeal *object  =  Deals.At(cur_ticket);
   if(object.GetTime()>TimeCurrent())
      return;
If previous checkups are passed through, check the state of indicator class instances and save the needed info calling SaveNewValues function for each indicator class.
   if(CheckPointer(ADX)!=POINTER_INVALID)
      ADX.SaveNewValues(cur_ticket);
   //---
   if(CheckPointer(Alligator)!=POINTER_INVALID)
      Alligator.SaveNewValues(cur_ticket);
   //---
   if(CheckPointer(ATR)!=POINTER_INVALID)
      ATR.SaveNewValues(cur_ticket);
   //---
   if(CheckPointer(BWMFI)!=POINTER_INVALID)
      BWMFI.SaveNewValues(cur_ticket);
   //---
   if(CheckPointer(CCI)!=POINTER_INVALID)
      CCI.SaveNewValues(cur_ticket);
   //---
   if(CheckPointer(Chaikin)!=POINTER_INVALID)
      Chaikin.SaveNewValues(cur_ticket);
   //---
   if(CheckPointer(Force)!=POINTER_INVALID)
      Force.SaveNewValues(cur_ticket);
   //---
   if(CheckPointer(MACD)!=POINTER_INVALID)
      MACD.SaveNewValues(cur_ticket);
   //---
   if(CheckPointer(StdDev)!=POINTER_INVALID)
      StdDev.SaveNewValues(cur_ticket);
   //---
   if(CheckPointer(Volume)!=POINTER_INVALID)
      Volume.SaveNewValues(cur_ticket);
In the end of the function increase the counter of processed orders and exit from the function.
   cur_ticket++;
   return;
  }
6.3. Chart output for analysis
Data analysis and report output will be implemented in OnTester function. When launching the function check the quantity of trades for analysis.
double OnTester()
  {
   double ret=0.0;
   int total=Deals.Total();
If there is a necessity to carry out analysis perform initialization of statistical classes.
In order to facilitate subsequent processing gather statistical classes of one-buffer indicators into array. Therefore, in parallel with initialization count one-buffer indicators used.
   int total_indy=0;
   if(total>0)
     {
      if(CheckPointer(ADX)!=POINTER_INVALID)
         ADX_Stat=new CStaticADX(ADX,1);
      //---
      if(CheckPointer(Alligator)!=POINTER_INVALID)
         Alligator_Stat=new CStaticAlligator(Alligator);
      //---
      if(CheckPointer(ATR)!=POINTER_INVALID)
        {
         CStaticOneBuffer *indy=new CStaticOneBuffer(ATR,_Point*10);
         if(CheckPointer(indy)!=POINTER_INVALID)
           {
            if(ArrayResize(IndicatorsStatic,total_indy+1)>0)
              {
               IndicatorsStatic[total_indy]=indy;
               total_indy++;
              }
           }
        }
      //---
      if(CheckPointer(BWMFI)!=POINTER_INVALID)
         BWMFI_Stat=new CStaticBWMFI(BWMFI,_Point*100);
      //---
      if(CheckPointer(CCI)!=POINTER_INVALID)
        {
         CStaticOneBuffer *indy=new CStaticOneBuffer(CCI,10);
         if(CheckPointer(indy)!=POINTER_INVALID)
            if(ArrayResize(IndicatorsStatic,total_indy+1)>0)
              {
               IndicatorsStatic[total_indy]=indy;
               total_indy++;
              }
        }
      //---
      if(CheckPointer(Chaikin)!=POINTER_INVALID)
        {
         CStaticOneBuffer *indy=new CStaticOneBuffer(Chaikin,100);
         if(CheckPointer(indy)!=POINTER_INVALID)
            if(ArrayResize(IndicatorsStatic,total_indy+1)>0)
              {
               IndicatorsStatic[total_indy]=indy;
               total_indy++;
              }
        }
      //---
      if(CheckPointer(Force)!=POINTER_INVALID)
        {
         CStaticOneBuffer *indy=new CStaticOneBuffer(Force,0.1);
         if(CheckPointer(indy)!=POINTER_INVALID)
            if(ArrayResize(IndicatorsStatic,total_indy+1)>0)
              {
               IndicatorsStatic[total_indy]=indy;
               total_indy++;
              }
        }
      //---
      if(CheckPointer(MACD)!=POINTER_INVALID)
         MACD_Stat=new CStaticMACD(MACD,_Point*10);
      //---
      if(CheckPointer(StdDev)!=POINTER_INVALID)
        {
         CStaticOneBuffer *indy=new CStaticOneBuffer(StdDev,_Point*10);
         if(CheckPointer(indy)!=POINTER_INVALID)
            if(ArrayResize(IndicatorsStatic,total_indy+1)>0)
              {
               IndicatorsStatic[total_indy]=indy;
               total_indy++;
              }
        }
      //---
      if(CheckPointer(Volume)!=POINTER_INVALID)
        {
         CStaticOneBuffer *indy=new CStaticOneBuffer(Volume,100);
         if(CheckPointer(indy)!=POINTER_INVALID)
            if(ArrayResize(IndicatorsStatic,total_indy+1)>0)
              {
               IndicatorsStatic[total_indy]=indy;
               total_indy++;
              }
        }
     }
Further, compare indicator data with respective trades and group up information by directions required for output of graphic reports. For this purpose in each statistical class call Ad function, having passed info about the trade in its parameters.
   for(int i=0;i<total;i++)
     {
      CDeal               *deal     =  Deals.At(i);
      ENUM_POSITION_TYPE   type     =  deal.Type();
      double               d_profit =  deal.GetProfit();

      for(int ind=0;ind<total_indy;ind++)
         IndicatorsStatic[ind].Ad(i,d_profit,type);
      if(CheckPointer(BWMFI_Stat)!=POINTER_INVALID)
         BWMFI_Stat.Ad(i,d_profit,type);
      if(CheckPointer(MACD_Stat)!=POINTER_INVALID)
         MACD_Stat.Ad(i,d_profit,type);
      if(CheckPointer(ADX_Stat)!=POINTER_INVALID)
         ADX_Stat.Ad(i,d_profit,type);
      if(CheckPointer(Alligator_Stat)!=POINTER_INVALID)
         Alligator_Stat.Ad(i,d_profit,type);
     }
After data grouping create a report file Report.html and save it in the shared folder of terminals.
   if(total_indy>0 || CheckPointer(BWMFI_Stat)!=POINTER_INVALID || CheckPointer(MACD_Stat)!=POINTER_INVALID
      || CheckPointer(ADX_Stat)!=POINTER_INVALID || CheckPointer(Alligator_Stat)!=POINTER_INVALID )
     {
      int handle=FileOpen("Report.html",FILE_WRITE|FILE_TXT|FILE_COMMON);
      if(handle<0)
         return ret;
In file beginning write the header of our html-report.
      FileWrite(handle,"<!DOCTYPE HTML PUBLIC \"-//W3C//DTD HTML 4.01//EN\" \"http://www.w3.org/TR/html4/strict.dtd\">");
      FileWrite(handle,"<html> <head> <meta http-equiv=\"Content-Type\" content=\"text/html; charset=utf-8\">");
      FileWrite(handle,"<title>Deals to Indicators</title> <!-- - -->");
      FileWrite(handle,"<script src=\"http://ajax.googleapis.com/ajax/libs/jquery/1.4.4/jquery.js\" type=\"text/javascript\"></script>");
      FileWrite(handle,"<script src=\"https://code.highcharts.com/highcharts.js\" type=\"text/javascript\"></script>");
      FileWrite(handle,"<!-- - --> <script type=\"text/javascript\">$(document).ready(function(){");
Then, calling one by one HTML_header function of all statistical classes enter into our file data for chart drawing.
      for(int ind=0;ind<total_indy;ind++)
         FileWrite(handle,IndicatorsStatic[ind].HTML_header());
      if(CheckPointer(BWMFI_Stat)!=POINTER_INVALID)
         FileWrite(handle,BWMFI_Stat.HTML_header());
      if(CheckPointer(MACD_Stat)!=POINTER_INVALID)
         FileWrite(handle,MACD_Stat.HTML_header());
      if(CheckPointer(ADX_Stat)!=POINTER_INVALID)
         FileWrite(handle,ADX_Stat.HTML_header());
      if(CheckPointer(Alligator_Stat)!=POINTER_INVALID)
         FileWrite(handle,Alligator_Stat.HTML_header());
After that, calling one by one HTML_body function of each statistical class create a template for report output. Note: by the call of this function we finish work with the statistical class and delete it to clear memory.
      FileWrite(handle,"});</script> <!-- - --> </head> <body>");
      for(int ind=0;ind<total_indy;ind++)
        {
         FileWrite(handle,IndicatorsStatic[ind].HTML_body());
         delete IndicatorsStatic[ind];
        }
      if(CheckPointer(BWMFI_Stat)!=POINTER_INVALID)
        {
         FileWrite(handle,BWMFI_Stat.HTML_body());
         delete BWMFI_Stat;
        }
      if(CheckPointer(MACD_Stat)!=POINTER_INVALID)
        {
         FileWrite(handle,MACD_Stat.HTML_body());
         delete MACD_Stat;
        }
      if(CheckPointer(ADX_Stat)!=POINTER_INVALID)
        {
         FileWrite(handle,ADX_Stat.HTML_body());
         delete ADX_Stat;
        }
      if(CheckPointer(Alligator_Stat)!=POINTER_INVALID)
        {
         FileWrite(handle,Alligator_Stat.HTML_body());
         delete Alligator_Stat;
        }
In the end, finish writing closing tags, close the file, clear arrays and exit from function.
      FileWrite(handle,"</body> </html>");
      FileFlush(handle);
      FileClose(handle);
     }
//---
   ArrayFree(IndicatorsStatic);
//---
   return(ret);
  }
Do not forget to delete remaining classes in OnDeinit function.
7. Information analysis
Our work is coming to a logical end. Now it is the time we should take a look at results. For doing this return to the strategy tester, repeat all the settings in it which we were using when testing the adviser studied in the second section of our article and start the test of our newly created analytical EA.
After testing completion open the shared terminal folder and find there Report.html. Open it in the browser. Further, I will supply examples from my report.
7.1. ATR

When analyzing charts of profit dependence on ATR indicator I cannot see potentially profitable areas and, therefore, there is no possibility of trade filtration.
7.2. CCI

Charts of profit dependence on CCI indicator allow to absorb some profit by BUY trades at indicator value higher than 200 and at growing indicator line. But by SELL trades profitable areas are not available.
7.3. Chaikin

Chaikin oscillator just like ATR did not reveal interconnection between indicator values and profit from trades.
7.4. Force indicator

Analytical charts of force indicator did not reveal any dependencies, as well.
7.5. Standard deviation

Analysis of dependencies on StdDev indicator values allows to reveal some problem areas for buy orders, but a possibility to filter sell trades is absent.
7.6. Volume indicator

We failed to detect dependences at analysis of volume indicator data, as well.
7.7. Bill Williams MFI

Indicator BW MFI allows to receive profit at filtering buy trades if they are open only at color 0. But we failed to detect any dependences for sell trades.
7.8. MACD


Signals of MACD indicator allow to filter profitable buy trades. This is possible if you make buy trades when Signal Line is above histogram. But analysis does not show profitable areas for sell trades. At the same time, the indicator allows to reduce loss operations, having excluded sell trades at growing histogram and position of Signal Line under or equal to histogram.
7.9. ADX
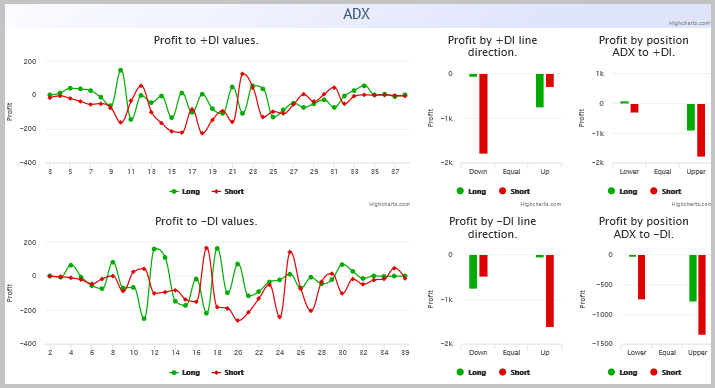
Analysis of ADX indicator signals does not allow to filter trades.
7.10. Alligator


The use of Alligator indicator for trade filtration, in my opinion, is the most perspective. Patterns for making trades may be found in combinations of position and direction of lines. Thus, profitable buy trades may be executed if:
- indicator line position shows a sell trend and LIPS or JAW line turns upwards;
- indicator line position shows a buy trend and LIPS and TEETH lines are directed upwards;
- trend is indefinite and TEETH and JAW lines are directed downwards.
For sell trades, mirror signals will be used.
8. Correcting initial EA
We have carried out a very extensive work on analyzing trades of our EA. Now, let’s see how this will influence performance of our strategy. For this purpose, into trading signal module from article [1] add indicators with filtration rules according to the above specified analysis. I propose to add MACD and Alligator to our module.
I would recommend to add the indicator filters sequentially and to cyclically perform the procedure of resolving trades into indicators after addition of each filter. This will provide more distinct understanding of influence by each filter upon the whole strategy and will help to evaluate their complex influence. Thereunto, if at the first stage analysis does not allow to detect profit dependence on values of any indicator it does not mean at all that you will not see such dependence at subsequent iterations. I am not doing this now simply not to bubble up this article which is rather large without it.
First, add indicator parameters into module description.
//| Parameter=JAW_Period,uint,13,JAW Period                                   |
//| Parameter=JAW_Shift,uint,8,JAW Shift                                      |
//| Parameter=TEETH_Period,uint,8,TEETH Period                                |
//| Parameter=TEETH_Shift,uint,5,TEETH Shift                                  |
//| Parameter=LIPS_Period,uint,5,LIPS Period                                  |
//| Parameter=LIPS_Shift,uint,3,LIPS_Shift                                    |
//| Parameter=Alligator_Method,ENUM_MA_METHOD,MODE_SMMA,Method                |
//| Parameter=Alligator_Price,ENUM_APPLIED_PRICE,PRICE_MEDIAN,Alligator Price |
//| Parameter=MACD_Fast,uint,12,MACD Fast                                     |
//| Parameter=MACD_Slow,uint,26,MACD Slow                                     |
//| Parameter=MACD_Signal,uint,9,MACD Signal                                  |
//| Parameter=MACD_Price,ENUM_APPLIED_PRICE,PRICE_CLOSE,MACD Price            |
Add the variables for storing the parameters to the private block, while the functions for their saving are added to the public one.
   uint              ci_MACD_Fast;
   uint              ci_MACD_Slow;
   uint              ci_MACD_Signal;
   ENUM_APPLIED_PRICE ce_MACD_Price;
   uint              ci_JAW_Period;
   uint              ci_JAW_Shift;
   uint              ci_TEETH_Period;
   uint              ci_TEETH_Shift;
   uint              ci_LIPS_Period;
   uint              ci_LIPS_Shift;
   ENUM_MA_METHOD    ce_Alligator_Method;
   ENUM_APPLIED_PRICE ce_Alligator_Price;
   void              JAW_Period(uint value)                 {  ci_JAW_Period  =  value;   }
   void              JAW_Shift(uint value)                  {  ci_JAW_Shift   =  value;   }
   void              TEETH_Period(uint value)               {  ci_TEETH_Period=  value;   }
   void              TEETH_Shift(uint value)                {  ci_TEETH_Shift =  value;   }
   void              LIPS_Period(uint value)                {  ci_LIPS_Period =  value;   }
   void              LIPS_Shift(uint value)                 {  ci_LIPS_Shift  =  value;   }
   void              Alligator_Method(ENUM_MA_METHOD value) {  ce_Alligator_Method  =  value;   }
   void              Alligator_Price(ENUM_APPLIED_PRICE value) {  ce_Alligator_Price=  value;   }
   void              MACD_Fast(uint value)                  {  ci_MACD_Fast   =  value;   }
   void              MACD_Slow(uint value)                  {  ci_MACD_Slow   =  value;   }
   void              MACD_Signal(uint value)                {  ci_MACD_Signal =  value;   }
   void              MACD_Price(ENUM_APPLIED_PRICE value)   {  ce_MACD_Price  =  value;   }
As well, we must add classes for work with indicators and functions of initialization of necessary data receiving. For working with MACD I used a standard class. So far as for Alligator a standard class does not exist I replaced it with three classes of moving averages, assigning to them names according to names of indicator lines.
protected:
   CiMACD            m_MACD;           // object-oscillator
   CiMA              m_JAW;
   CiMA              m_TEETH;
   CiMA              m_LIPS;

   //--- method of initialization of the indicators
   bool              InitMACD(CIndicators *indicators);
   bool              InitAlligator(CIndicators *indicators);
   //--- methods of getting data
   double            Main(int ind)                     { return(m_MACD.Main(ind));      }
   double            Signal(int ind)                   { return(m_MACD.Signal(ind));    }
   double            DiffMain(int ind)                 { return(Main(ind+1)!=0 ? Main(ind)-Main(ind+1) : 0); }
   int               AlligatorTrend(int ind);
   double            DiffJaw(int ind)                  { return(m_JAW.Main(ind+1)!=0 ? m_JAW.Main(ind)/m_JAW.Main(ind+1) : 1); }
   double            DiffTeeth(int ind)                { return(m_TEETH.Main(ind+1)!=0 ? m_TEETH.Main(ind)/m_TEETH.Main(ind+1) : 1); }
   double            DiffLips(int ind)                 { return(m_LIPS.Main(ind+1)!=0 ? m_LIPS.Main(ind)/m_LIPS.Main(ind+1) : 1); }
By the next step, enter changes into InitIndicators to add our indicators into EA library.
bool CSignalKalman::InitIndicators(CIndicators *indicators)
  {
//--- initialization of indicators and timeseries of additional filters
   if(!CExpertSignal::InitIndicators(indicators))
      return(false);
//--- initialize close serias
   if(CheckPointer(m_close)==POINTER_INVALID)
     {
      if(!InitClose(indicators))
         return false;
     }
//--- create and initialize MACD oscilator
   if(!InitMACD(indicators))
      return(false);
//--- create and initialize Alligator
   if(!InitAlligator(indicators))
      return(false);
//--- create and initialize Kalman Filter
   if(CheckPointer(Kalman)==POINTER_INVALID)
      Kalman=new CKalman(ci_HistoryBars,ci_ShiftPeriod,m_symbol.Name(),ce_Timeframe);

//--- ok
   return(true);
  }
Then enter additions into functions of decision making. At the same time, remember that the indicators added act as the filter. Therefore, address to indicators only after receiving the main signal.
int CSignalKalman::LongCondition(void)
  {
   if(!CalculateIndicators())
      return 0;
   int result=0;
   //---
   if(cd_correction>cd_forecast)
     {
      if(Signal(1)>Main(1))
         result=80;
      else
        {
         switch(AlligatorTrend(1))
           {
            case 1:
              if(DiffLips(1)>1 && DiffTeeth(1)>1 && DiffJaw(1)<=1)
                 result=80;
              break;
            case -1:
              if(DiffLips(1)>1 || DiffJaw(1)>1)
                 result=80;
              break;
            case 0:
              if(DiffJaw(1)<1)
                {
                 if(DiffLips(1)>1)
                    result=80;
                 else
                    if(DiffTeeth(1)<1)
                       result=80;
                }
              break;
           }
        }
     }
   return result;
  }
Analogous changes are entered into ShortCondition function. The full code of trading decision module is provided in attachment.
9. Testing of EA after entering changes
After entering changes into trading decision module, create a new EA (detailed description of EA creation with the use of the trading signal module is provided in article [5]). Let’s test the newly created EA with the parameters similar to the initial testing in section 2 hereof.
As testing outcomes show, without changing EA parameters, the use of filters allowed to increase the profit factor from 0.75 to 1.12. I.e. at loss parameters of the original EA we managed to gain profit. Let me remind that in the beginning, I intentionally took non-optimized parameters of the original EA.


Conclusion
This article demonstrated a technology of resolving a trade history into indicators which allowed to arrange a standard indicator-based filter system. By testing outcomes, this system showed tangible result in operation profitability of the EA analyzed. The suggested system may be applied not only at optimization of the existing trading system but at attempts to create a new one.
References
- The use if Kalman's filter in price trend forecast
- Charts and diagrams in HTML format
- For how long does a trend last?
- Several ways of trend determination at MQL5
- Considering in practice the adaptive method of following the market
Programs used in the article:
| # | Name | Type | Description |
|---|---|---|---|
| 1 | Kalman.mqh | Class library | Kalman's filter class |
| 2 | SignalKalman.mqh | Class library | Trading signal module by Kalman's filter |
| 3 | SignalKalman+Filters.mqh | Class library | Trading signal module by Kalman's filter after adding indicator filters |
| 4 | Kalman_expert.mq5 | Expert Adviser | Original Expert Adviser on strategy with Kalman's filter application |
| 5 | Kalman+Filters.mq5 | Expert Adviser | Modified Expert Adviser on strategy with Kalman's filter application |
| 6 | Deals_to_Indicators.mq5 | Expert Adviser | Expert Adviser for resolving trade history into indicators |
| 7 | Deal.mqh | Class library | Class for saving information about a trade |
| 8 | Parsing.mqh | Class library | Class for trade history parsing from testing report |
| 9 | Value.mqh | Class library | Class for saving data on indicator buffer state |
| 10 | OneBufferArray.mqh | Class library | Class for saving data history of one-buffer indicator |
| 11 | StaticOneBuffer.mqh | Class library | Class for collecting and analysis of one-buffer indicator statistics |
| 12 | ADXValue.mqh | Class library | Class for saving data on ADX indicator state |
| 13 | ADX.mqh | Class library | Class for saving data history of ADX indicator |
| 14 | StaticADX.mqh | Class library | Class for collecting and analysis of ADX indicator statistics |
| 15 | AlligatorValue.mqh | Class library | Class for saving data on Alligator indicator state |
| 16 | Alligator.mqh | Class library | Class for saving data history of Alligator indicator |
| 17 | StaticAlligator.mqh | Class library | Class for collecting and analysis of Alligator indicator statistics |
| 18 | BWMFIValue.mqh | Class library | Class for saving data on BW MFI indicator state |
| 19 | BWMFI.mqh | Class library | Class for saving data history of BW MFI indicator |
| 20 | StaticBWMFI.mqh | Class library | Class for collecting and analysis of BW MFI indicator statistics |
| 21 | MACDValue.mqh | Class library | Class for saving data on MACD indicator state |
| 22 | MACD.mqh | Class library | Class for saving data history of MACD indicator |
| 23 | StaticMACD.mqh | Class library | Class for collecting and analysis of MACD indicator statistics |
| 24 | Reports.zip | Archive | Archive contains results of adviser testing in strategy tester and the analytical report. |
Translated from Russian by MetaQuotes Ltd.
Original article: https://www.mql5.com/ru/articles/3968
Warning: All rights to these materials are reserved by MetaQuotes Ltd. Copying or reprinting of these materials in whole or in part is prohibited.
This article was written by a user of the site and reflects their personal views. MetaQuotes Ltd is not responsible for the accuracy of the information presented, nor for any consequences resulting from the use of the solutions, strategies or recommendations described.

 Using the Kalman Filter for price direction prediction
 R-squared as an estimation of quality of the strategy balance curve
- Free trading apps
- Over 8,000 signals for copying
- Economic news for exploring financial markets
You agree to website policy and terms of use
You yourself write that only coincidences of trades and filter readings are analysed.
And if you remove trades and leave only the filter, there will be other inputs. They will not be profitable.
I was talking about the situation when trades of a strategy can overlap.
For example, there was a buy signal at 12:00 and the position was closed only at 20:00. The next one opened at 23:00.
But at 14:00 and 16:00 there could be 2 more buy signals (which were not executed because the position was already open). So, if the filter cancels the entry at 12:00, but does not cancel one of the next entries (14:00 or 16:00), there will be another trade, which was not analysed for profitability and combination with the filter at all.
That's why the results will be different from the variant with filter embedding and subsequent optimisation.
Yes, I analysed the coincidence of trades with the filter readings. And if the filter cancels one deal, but misses another one later, then with a high probability the new deal will bring profit. This follows from the statistical analysis and is confirmed by the post-testing conducted at the end of the article.
You still don't understand me, but that's fine.
I think even a good strategy doesn't always work, you have to take the situation into account as well.
I think even a good strategy doesn't always work, you have to take the situation into account as well.
I'm trying to run it but I can't.
It gives an error in StaticMACD.mqh
2017.12.29 08:11:23.672 2017.12.14 18:16:59 array out of range in 'StaticMACD.mqh' (375,45)