
Wolfe Waves

Contents
- Introduction
- Rules for determining Wolfe Waves
- Choosing a ZigZag to work with
- Collecting data about the ZigZag peaks
- A bit of geometry
- Determining Waves
- Drawing waves and targets
- Deleting graphical objects
- The alert function
- Expert Advisor
- A few more tips from Bill Wolfe's book
- Conclusion
- Attachments
Introduction
Wolfe Wave is a graphical analysis pattern that was discovered and described in detail by Bill Wolfe. The pattern looks like a triangle or a wedge (Wolfe called it 'a rising wedge'), and has a few specific nuances. The graphical method proposed by Bill Wolfe allows to detect a pattern, based on which a moment and direction for entry can be found, and also it helps forecast the target which the price should reach, as well as the time of target reaching.
In this article, we will consider in detail the rules of detecting and interpreting Wolfe waves. We will create an indicator for the automated detection and display of waves based on the ZigZag indicator from the Universal ZigZag article. We will additionally create a simple Expert Advisor based on the resulting indicator. The EA will allow us to test the indicator performance and get the first impression of the graphical analysis proposed by Bill Wolfe and discussed in this article.
Rules for determining Wolfe Waves
Let us consider Wolfe Waves on the example of buying (Fig. 1). The price forms two consecutively declining lower peaks (blue line, points 1 and 3) and two successively declining higher peaks (points 2 and 4). After the reversal and formation of a peak in point 4, the price continues to fall. Once the price forms the line 1—3, a buy operation is performed (point 5).
Fig. 1. Wolfe Waves for buying. The blue line is the price, the red line is a formation for determining the target. Entry is performed in point 5, the target is point 7
Point 6 at the intersection of lines 1—3 and 2—4 determines target reaching time. The target value (point 7) is defined as the intersection of line 1—4 and the vertical line drawn through point 6. The methodology does not provide stop loss calculation algorithm, and the general advice is to use SL at your discretion. Above were all the wave determining rules from Wolfe's book.
A few more rules have been found when developing an indicator for this article.
- Point 3 must be considerably lower than point 1, the following condition should be checked:
v3<v1-d1
where:
- v3 — the level of point 3;
- v1 — the level of point 1;
- d1 — the vertical distance between points 1 and 2 (segment 1''-2''), multiplied by K1 (K1 is a parameter from the properties window, its default value is 0.1).
- Line 1—4 determining the target must be directed upwards, i.e. point 4 must be considerably higher than point 1. The following condition should be checked:
v4>v1+d1;
v4 — the level of point 4.
- Point 4 must be considerably lower than point 2, the following condition should be checked:
v4<v2-d2;
where v2 is the level of point 2, d2 is the vertical distance between points 2 and 3 (segment 2''-3''), multiplied by K2 (K1 is a parameter from the properties window, its default value is 0.1).
Lines 2-4 and 1-3 determining the target reaching time, must intersect on the right, so the height of 2-2' must be considerably higher than the height of 4-4'. The following check is performed here:
h2-h4>K3*h2;
where h2 is the height of segment 2-2', h4 is the 4-4'segment size, K3 is the ratio (K3 is a parameter from the properties window, its default value is 0.1).
These clarifying rules do not pretend to be absolutely correct. Further we describe in detail the indicator creation process. Based on this material, you will be able to adjust the code in accordance with your own ideas.
Choosing a ZigZag to work with
Before getting started, let us download the attachment to the Universal ZigZag article, which contains many different versions of the ZigZag indicator. We need to select one of them to use in our article. We do not use iUniZigZagPrice and iUniZigZagPriceSW, which are designed for ZigZag calculation based on some other indicator running on a chart, so they are only useful for a visual analysis. Other indicators seem more interesting. Each of them can be used to create Expert Advisors. Also, we will not use iCloseZigZag and iHighLowZigZag, which are only initial examples of how to create a ZigZag. Two versions are left, i.e. iUniZigZag and iUniZigZagSW. The iUniZigZagSW indicator working in a subwindow suits us better, because it provides wider capabilities. The attachment also includes the iUniZigZagSWEvents indicator, which shows an example of using the iCustom() function when accessing the iUniZigZagSW indicator. We will use this variant, because it will allow us to use all the possibilities of the iUniZigZagSW indicator and additionally separate the Wolfe Wave determining code from the ZigZag code.
The iUniZigZagSWEvents indicator is displayed on the price chart, four buffers are used to draw the indicator: two buffers with arrows, and the other two with points. That's what we need for determining Wolfe Waves. The arrows will indicate pattern identification places, and points will be used for targets. Our indicator will draw waves and formations for determining the target using graphical objects, in particular the trendline. If you draw it as a segment without extending the ray, it is a very convenient tool for displaying different formations.
In addition to determining moments and direction for entries, Wolfe Waves are also used to predict the target. Therefore, difficulties arise when using iUniZigZagSW. The indicator has the SrcSelect parameter which allows selecting the source of analyzed data, based on which ZigZag is drawn. One of the following four options can be selected:
- Src_HighLow — by high and low prices;
- Src_Close — by close prices;
- Src_RSI — by the RSI indicator;
- Src_MA — by the Moving Average.
A trading Expert Advisor will be created based on the indicator that we are creating now. That is why, if we build the ZigZag using the price, the predicted target can be used for placing Take Profit. There are no problems displaying the target on the chart. But if we calculate ZigZag using RSI (SrcSelect=Src_RSI), the predicted target will be for the RSI indicator, not for the price. So, once the RSI indicator reaches the target value, we'll need to close by market, and it will be impossible to display the target price and additional formations on the chart.
When using ZigZag drawn based on the price (Src_HighLow or Src_Close), the target price and additional formations will be displayed on the chart. In all other cases, only an arrow will be displayed, indicating the found formation and its direction. The target value will still be available in the appropriate price buffer (to be able to close by market in the Expert Advisor of for any other purpose), but it will not be displayed.
Most likely, the idea of a market closure once the indicator reaches the target level cannot be implemented in practice. The values of most indicators vary in a certain range, and the target result can be outside this range. However, the buffer will contain the target value in any case.
Collecting data about the ZigZag peaks
Let's start creating the indicator. We open the iUniZigZagSWEvents file in the editor and save it as iWolfeWaves. We will work with this indicator.
It would be very convenient to have a direct access to all the Zigzag peaks—in this case we will not have to search for them in history each time. Let's create an array for storing the values. Now, a new element will be added to the array every time when the ZigZag changes its direction. If the indicator simply extends the last segment (updates the extremum), the last element of the array will be updated.
For each peak, we will save the peak value, direction and the index of the bar on which the peak is located (indexing from left to right). For this purpose, we will use a structure of three fields:
struct SPeackTrough{
   double   Val; // value
   int      Dir; // direction
   int      Bar; // bar index
};
Let us create an array of these structures:
SPeackTrough PeackTrough[];
If only ZigZag based on high and low (SrcSelect = Src_HighLow) were used, in case of direction change it would be enough to increase the array, set the values and update the last element with the extension of the last indicator segment. It is more difficult for a ZigZag based on the close price (SrcSelect = Src_Close) or data of any other indicator. During the formation of the bar, on which direction changed, ZigZag can return to its original state (that was before the opening of the current bar). It means that for each new calculation of the same bar, the array for peaks needs to be returned to its initial state that the array had on the previous bar. If we often change the array size, this may slow down the indicator operation. Therefore, let us introduce an additional variable, in which the used array size will be stored. The array will be changed in blocks when necessary, only allowing size increase. Before re-counting the same bar, we will return the initial value of this variable.
We will use two variables to store the array size. In one variable, the array size on the previous bar will be stored. The size on the currently calculated bar will be stored in the second one:
int PreCount; // the size of the PeackTrough array on the previous bar
int CurCount; // the size of the PeackTrough array on the currently calculated bar
After completion of bar formation and calculation, or after the calculation of a historic bar, the value of the CurCount variable should be transfered to the PreCount variable. Then, before each calculation of the new forming bar, we will move the value from PreCount to CurCount. Only the CurCount variable will be used in all calculations. The PreCount variable is auxiliary. Information about the completion of bar formation can only be known at the opening of the net bar (or when switching to the calculation of the next bar in history). The emergence of a new bar will be determined by time: if the bar time has changed, then a new bar has appeared (or the calculation of the next bar in history has started). An auxiliary variable is needed in order to determine the new bar:
datetime LastTime; PreCount, LastCount and LastTime are global variables of the indicator. But they can also be declared as static ones in the OnCalculate() indicator function.
Let's move on to the OnCalculate() function. Based on the value of prev_calculated, it is determined whether the first indicator calculation is performed or only new bars are calculated. 0 means full calculation. In this case, the variables PreCount, CurCount and LastTime need to be initialized. The following code, which defines the range of bars for calculation and initializes auxiliary variables is located at the very top of the OnCalculte() function:
int start; // a variable for the index if the first calculated bar

if(prev_calculated==0){ // full calculation of all bars
   start=1;
   CurCount=0;
   PreCount=0;
   LastTime=0;
}
else{ // new bar calculation
   start=prev_calculated-1;
}
Now let us deal with the standard indicator cycle. At its beginning, we'll organize the transfer of values in variables PreCount, CurCount:
for(int i=start;i<rates_total;i++){

   if(time[i]>LastTime){ // the first calculation of a new (next) bar
      LastTime=time[i];
      PreCount=CurCount;
      PreDir=CurDir;
   }
   else{ // re-calculation of a bar
      CurCount=PreCount;
      CurDir=PreDir;
   }
In all calculations, only the CurCount variable will be used, while PreCount is only designed to maintain the current value of CurCount. At the opening of a new bar, CurCount first contains the value obtained after the calculation of the previous bar. That is why we move this value to PreCount. After the new bar calculation, the value of CurCount can change. But we can only know for sure that the value is final at the opening of the next bar. That is why, in case of re-calculation of the same bar, the value of the PreCount variable is placed to CurCount.
The main indicator cycle should contain the following code taken from the iUniZigZagSWEvents indicator:
UpArrowBuffer[i]=EMPTY_VALUE;
DnArrowBuffer[i]=EMPTY_VALUE;

UpDotBuffer[i]=EMPTY_VALUE;
DnDotBuffer[i]=EMPTY_VALUE;

// direction

double dir[2];
if(CopyBuffer(handle,3,rates_total-i-1,2,dir)<=0){
   return(0);
}
if(dir[0]==1 && dir[1]==-1){
   DnArrowBuffer[i]=high[i];
   c++;

}
else if(dir[0]==-1 && dir[1]==1){
   UpArrowBuffer[i]=low[i];
   c++;
}

// new High

double lhb[2];
if(CopyBuffer(handle,4,rates_total-i-1,2,lhb)<=0){
   return(0);
}
if(lhb[0]!=lhb[1]){
   UpDotBuffer[i]=high[i];
}

// new Low

double llb[2];
if(CopyBuffer(handle,5,rates_total-i-1,2,llb)<=0){
   return(0);
}
if(llb[0]!=llb[1]){
   DnDotBuffer[i]=low[i];
}
The part of code where arrows are drawn will not be used, so let's delete it.
During operation, the indicator will monitor each change of ZigZag, including direction change and each extension of the last segment, because the last segment is required for determining point 5 (see Fig. 1). We will use part of code from the above fragment, which is related to drawing of new extrema.
To monitor ZigZag direction and determine its changes, we will need a couple of variables similar to CurCount and PreCount: PreDir and CurDir:
int PreDir; // ZigZag direction on the previous bar
int CurDir; // ZigZag direction on the currently calculated bar
They can also be both global and static in OnCalculate(). At the beginning of indicator calculation, we also need to initialize these variables and move values after bar calculation, similar to PreCount and CurCount. Below is the final code of OnCalculate() as of the current step of indicator creation:
int OnCalculate(const int rates_total,
                const int prev_calculated,
                const datetime &time[],
                const double &open[],
                const double &high[],
                const double &low[],
                const double &close[],
                const long &tick_volume[],
                const long &volume[],
                const int &spread[])
  {

   int start; // a variable for the starting bar of calculation

   if(prev_calculated==0){ // full calculation
      start=1;
      CurCount=0;
      PreCount=0;
      CurDir=0;
      PreDir=0;
      LastTime=0;
   }
   else{ // calculating only new bars
      start=prev_calculated-1;
   }

   // the main indicator cycle
   for(int i=start;i<rates_total;i++){

      if(time[i]>LastTime){ // new bar
         LastTime=time[i];
         PreCount=CurCount;
         PreDir=CurDir;
      }
      else{ // re-calculation of a bar
         CurCount=PreCount;
         CurDir=PreDir;
      }

      // clearing buffers that draw arrows and points

      UpArrowBuffer[i]=EMPTY_VALUE;
      DnArrowBuffer[i]=EMPTY_VALUE;

      UpDotBuffer[i]=EMPTY_VALUE;
      DnDotBuffer[i]=EMPTY_VALUE;

      // auxiliary variables

      double hval[1];
      double lval[1];

      double zz[1];

      // new High

      double lhb[2];
      // receiving two elements of the buffer with the indexes of bars with new highs
      if(CopyBuffer(handle,4,rates_total-i-1,2,lhb)<=0){
         return(0);
      }
      if(lhb[0]!=lhb[1]){ // there is a new high
         // getting the high price value (or data, based on which ZigZag is calculated)
         if(CopyBuffer(handle,0,rates_total-i-1,1,hval)<=0){
            return(0);
         }
         if(CurDir==1){ // the last known upward direction
            // update information about the last ZigZag point
            RefreshLast(i,hval[0]);
         }
         else{ // ZigZag direction changed
               // add a new value
            AddNew(i,hval[0],1);
         }
         // here we'll add check conditions for recognizing downward Wolfe Waves
      }

      // new Low

      double llb[2];
      // receiving two elements of the buffer with the indexes of bars with new lows
      if(CopyBuffer(handle,5,rates_total-i-1,2,llb)<=0){
         return(0);
      }
      if(llb[0]!=llb[1]){ // there is a new low
         // getting the low price value (or data, based on which ZigZag is calculated)
         if(CopyBuffer(handle,1,rates_total-i-1,1,lval)<=0){
            return(0);
         }
         if(CurDir==-1){ // last known downward direction
            // update information about the last ZigZag point
            RefreshLast(i,lval[0]);
         }
         else{ // ZigZag direction changed
            // add a new value
            AddNew(i,lval[0],-1);
         }
         // here we'll add check conditions for recognizing upward Wolfe Waves
      }
   }
   return(rates_total);
}
This code contains functions AddNew() and RefreshLast(). The index of the bar, on which ZigZag was changed, and the new extremum value are passed to both functions. The ZigZag direction is additionally passed to AddNew().
The AddNew() function for adding a new point:
void AddNew(int i,double v,int d){
   if(CurCount>=ArraySize(PeackTrough)){ // there are no free elements in the array
      ArrayResize(PeackTrough,ArraySize(PeackTrough)+1024); // increasing the array size
   }
   PeackTrough[CurCount].Dir=d; // setting the direction
   PeackTrough[CurCount].Val=v; // setting the value
   PeackTrough[CurCount].Bar=i; // setting the bar
   CurCount++; // increasing the variable with the number of occupied array elements
   CurDir=d; // remember the last ZigZag direction
}
The RefreshLast() function for refreshing the last point:
void RefreshLast(int i,double v){
   PeackTrough[CurCount-1].Bar=i; // setting a new bar
   PeackTrough[CurCount-1].Val=v; // setting a new value
}
The indicator can be saved at this stage, and it can be used as a basis for the development of indicators defining various Zigzag patterns. In the below attachment, the indicator name is "iWolfeWaves_Step_1".
A bit of geometry
We will need a bit of geometry when identifying Wolfe waves and adding shapes that determine the target. Let us view these problems separately and write functions to solve them.
Problem #1. A straight line is set by a pair of points x-y, where x is the bar index, y is the value (price or indicator value). We know the x coordinate of the third point, we need to find the value of the line in this point (Fig. 2).
Fig. 2. Given: X1, Y1, X2, Y2, X3. We need to find Y3.
Problem #1 solution. We determine the value of line increase along the Y axis per one unit of increase along the X axis:
D=(Y2-Y1)/(X2-X1)
Where D is the increment, Y1 is the price or indicator value at point 1, Y2 is the price or indicator value at point 2, X1 is the bar index at point 1, X2 is the bar index at point 2.
Determining Y3:
Y3=Y1+(X3-X1)*D
Where X3 is the bar index at point 3, Y3 is the sought line value at point 3.
We get the following function:
double y3(double x1,double y1,double x2,double y2,double x3){
   return(y1+(x3-x1)*(y2-y1)/(x2-x1));
}
The following parameters are passed to the function:
- x1 — bar index at point 1;
- y1 — value at point 1;
- x2 — bar index at point 2;
- y2 — value at point 2.
Problem #2. Two lines are set by two points x-y. We need to find the x coordinate of their intersection point (Fig. 3). The following question may arise here: why do have we chosen the x coordinate? In any case, after obtaining the x coordinate, the y coordinate of point 3 will be calculated (using the equation of one of the lines). Therefore, we can first obtain the y coordinate of point 3, and then find the x value using an equation.
Fig. 3. Two lines are given. We need to find the point of their intersection
First, using the coordinates of two points, we obtain line equations in the form of y=a+b*x.
Let us perform the pre-calculations. The line slope value (in units along the y axis per one unit along the x axis):
D1=(Y12-Y11)/(X12-X11)
Here D1 is the desired slope value of the first line (line value change per bar), X11 is the bar index at point 1 of the first line, X12 is the bar index at point 2 of the first line, Y11 is the value of the first line at point 1, Y12 is the value of the first line at point 2.
The value of line 2 slope:
D2=(Y22-Y21)/(X22-X21)
Here D2 is the desired slope value of the second line (line value change per par), X21 is the bar index at point 1 of the second line, X22 is the bar index at point 2 of the second line, Y21 is the value of the second line at point 1, Y22 is the value of the second line at point 2.
Here are the equations of the line. Line 1 equation:
Y3=Y11+D1*(X3-X11)
Where Y3 is the line value at the intersection point (point 3), X3 is the bar index at point 3.
Line 2 equation:
Y3=Y21+D2*(X3-X21)
At the intersection point, the values of the lines are equal. So let's equate the line 1 equation to the line 2 equation:
Y11+D1*(X3-X11)=Y21+D2*(X3-X21);
Using the expression obtained, we find X3. As a result, we obtain the TwoLinesCrossX() function for determining the X coordinate of the intersection point:
double TwoLinesCrossX(double x11,double y11,double x12,double y12,double x21,double y21,double x22,double y22){
   double k2=(y22-y21)/(x22-x21);
   double k1=(y12-y11)/(x12-x11);
   return((y11-y21-k1*x11+k2*x21)/(k2-k1));
}
The following parameters are passed to the function:
- x11, which is the bar index at point 1 of the first line
- y11, which is the value at point 1 of the first line
- x12, which is the bar index at point 2 of the first line
- y12, which is the value at point 2 of the first line
- x21, which is the bar index at point 1 of the second line
- y21, which is the value at point 1 of the second line
- x22, which is the bar index at point 2 of the second line
- y22, which is the value at point 2 of the second line
Once the x coordinate of the line-line intersection point is defined, the y coordinate can be calculated using the coordinates of two points of one line, and the function y3() that was obtained when solving problem #1.
If we need to obtain the y coordinate first, the line equations should be converted so as to express the x coordinate through y. Here is an equation for one line:
X3=X11+(Y3-Y11)/D1
For the second line:
X3=X21+(Y3-Y21)/D2
Equate the two expressions:
X11+(Y3-Y11)/D1=X21+(Y3-Y21)/D2
Let's find Y3 based on the above equation. Thus we obtain the TwoLinesCrossY() function:
double TwoLinesCrossY(double x11,double y11,double x12,double y12,double x21,double y21,double x22,double y22){
   double k2=(x22-x21)/(y22-y21);
   double k1=(x12-x11)/(y12-y11);
   return((x11-x21-k1*y11+k2*y21)/(k2-k1));
}
The function parameters are identical to those of TwoLinesCrossX().
Determining Waves
Now that we have easy access to all ZigZag peaks and auxiliary geometrical functions, we can proceed to determining Wolfe Waves. We need to "catch" the moment when the last ZigZag segment crosses line 1-3 (see Fig. 1), i.e. point 5. So we will check Wolfe Wave conditions every time when a new ZigZag extremum appears (both when the direction changes and when the last segment is extended). All places where conditions should be checked are commented in detail in the OnCalculate() function code above. The CheckDn() and CheckUp() functions will be called from them. Let's consider in detail one of them, the CheckUp() function:
void CheckUp(int rates_total,const double & low[],const datetime & time[],int i){

   if(CurCount<5 || CurDir!=-1){
      // if there are not enough peaks or ZigZag is not directed downwards, do not check
      return;
   }

   // preparing short variables with the peak data

   // variables with peak values
   double v1=PeackTrough[CurCount-5].Val;
   double v2=PeackTrough[CurCount-4].Val;
   double v3=PeackTrough[CurCount-3].Val;
   double v4=PeackTrough[CurCount-2].Val;
   double v5=PeackTrough[CurCount-1].Val;

   // variables with the peak bars
   int i1=PeackTrough[CurCount-5].Bar;
   int i2=PeackTrough[CurCount-4].Bar;
   int i3=PeackTrough[CurCount-3].Bar;
   int i4=PeackTrough[CurCount-2].Bar;
   int i5=PeackTrough[CurCount-1].Bar;

   if(CurLastBuySig!=i4){ // if waves have not been detected at this ZigZag configuration
      double d1=K1*(v2-v1); // the minimum value of peak 3 indent relative to peak 1
      if(v3<v1-d1){ // peak 3 is noticeably lower than peak 1
         if(v4>v1+d1){ // line 1-4 is directed upwards
            double d2=K2*(v2-v3); // the minimum value of peak 4 indent relative to peak 2
            if(v4<v2-d2){ // peak 4 is noticeably lower than peak 2
               double v5l=y3(i1,v1,i3,v3,i); // the value of point 5
               if(v5<v5l){ // the last zigzag segment crossed line 1-3
                  double v4x=y3(i1,v1,i3,v3,i4); // the value in point 4'
                  double v2x=y3(i1,v1,i3,v3,i2); // the value in point 2'
                  double h4=v4-v4x; // height 4-4'
                  double h2=v2-v2x; // height 2-2'
                  if(h2-h4>K3*h2){ // lines 1-3 and 2-4 meet
                     double tb=TwoLinesCrossX(i1,v1,i3,v3,i2,v2,i4,v4); // the bar on which lines 1-3 and 2-4 intersect
                     double tv=y3(i1,v1,i4,v4,tb); // the value at the point of intersection of lines 1-3 and 2-4
                     UpArrowBuffer[i]=low[i]; // display of the up arrow
                     UpDotBuffer[i]=tv; // display of a point at the target level
                     CurLastBuySig=i4; // remember, that at this ZigZag configuration a shape has been found
                     if(_DrawWaves){ // drawing the shape and the formation
                        DrawObjects(BuyColor,BuyTargetColor,v1,v2,v3,v4,v5l,i1,i2,i3,i4,i5,time,i,tb,tv,rates_total);
                     }
                  }
               }
            }
         }
      }
   }
}
In order to determine a wave, we need at least 5 ZigZag peaks. Additional condition: in order to determine waves that would later turn upwards, the Zigzag should be directed downwards:
if(CurCount<5 || CurDir!=-1){
   // if there are not enough peaks or ZigZag is not directed downwards, do not check
   return;
}
To obtain peak data, we can address directly the PeakTrough array, but it is not convenient. It is simpler to use auxiliary variables with short names:
// variables with peak values
double v1=PeackTrough[CurCount-5].Val;
double v2=PeackTrough[CurCount-4].Val;
double v3=PeackTrough[CurCount-3].Val;
double v4=PeackTrough[CurCount-2].Val;
double v5=PeackTrough[CurCount-1].Val;

// variables with the peak bars
int i1=PeackTrough[CurCount-5].Bar;
int i2=PeackTrough[CurCount-4].Bar;
int i3=PeackTrough[CurCount-3].Bar;
int i4=PeackTrough[CurCount-2].Bar;
int i5=PeackTrough[CurCount-1].Bar;
If a wave has been detected and an arrow has been set, then it is no longer necessary to use the same Zigzag configuration. ZigZag configuration is identified by checking the index of peak 4 (the last formed peak):
if(CurLastBuySig!=i4){ // if waves have not been detected at this ZigZag configuration
To store the value of the configuration id, we use a pair of variables similar to CurCount and PreCount.
Now we proceed directly to wave determining. We calculate the value of the minimum shift of point 3 relative to point one, and shift of point 2 relative to point 1:
double d1=K1*(v2-v1); // the minimum value of peak 3 indent relative to peak 1
Then shift of points is checked:
if(v3<v1-d1){ // peak 3 is noticeably lower than peak 1
   if(v4>v1+d1){ // line 1-4 is directed upwards
We calculate the minimum value of the point 4 indent relative to point 2:
double d2=K2*(v2-v3); // the minimum value of peak 4 indent relative to peak 2
Checking the position of points 2 and 4:
if(v4<v2-d2){ // peak 4 is noticeably lower than peak 2
Now let's calculate the value of the point located on line 1-3, which corresponds to the calculated bar:
double v5l=y3(i1,v1,i3,v3,i); // the value of point 5
Check if line 1-3 was touched:
if(v5<v5l){ // the last zigzag segment crossed line 1-3
Calculate values in points 4' and 2':
double v4x=y3(i1,v1,i3,v3,i4); // the value in point 4'
double v2x=y3(i1,v1,i3,v3,i2); // the value in point 2'
Calculate heights 4-4' and 2-2':
double h4=v4-v4x; // height 4-4'
double h2=v2-v2x; // height 2-2'
Using these heights, check if lines 1-3 and 2-4 meet on the right:
if(h2-h4>K3*h2){ // lines 1-3 and 2-4 meet
If this condition is met, it means that a wave is found.
Define the target. First define the target bar:
double tb=TwoLinesCrossX(i1,v1,i3,v3,i2,v2,i4,v4); // the bar on which lines 1-3 and 2-4 intersect
Note that the 'double' variable is used for the precision of calculations.
Target value:
double tv=y3(i1,v1,i4,v4,tb); // the value at the point of intersection of lines 1-3 and 2-4
Display the icons and "remember" the zigzag configuration ID:
UpDotBuffer[i]=tv; // display of a point at the target level
CurLastBuySig=i4; // remember, that at this ZigZag configuration a shape has been found
Finally, we draw waves and the formation determining the target:
if(_DrawWaves){ // drawing the shape and the formation
   DrawObjects(BuyColor,BuyTargetColor,v1,v2,v3,v4,v5l,i1,i2,i3,i4,i5,time,i,tb,tv,rates_total);
}
Drawing of waves and formations, i.e. the DrawObjects() function, will be considered in a separate section of the article.
Downward waves (for selling) are determined by the CheckDn function, which is identical to CheckUp, except for small differences, which are connected with the direction. The function code and differences form the CheckUp()function are available below:
void CheckDn(int rates_total,const double & high[],const datetime & time[],int i){

   // not enough peaks or not directed upwards
   if(CurCount<5 || CurDir!=1){
      return;
   }

   double v1=PeackTrough[CurCount-5].Val;
   double v2=PeackTrough[CurCount-4].Val;
   double v3=PeackTrough[CurCount-3].Val;
   double v4=PeackTrough[CurCount-2].Val;
   double v5=PeackTrough[CurCount-1].Val;

   int i1=PeackTrough[CurCount-5].Bar;
   int i2=PeackTrough[CurCount-4].Bar;
   int i3=PeackTrough[CurCount-3].Bar;
   int i4=PeackTrough[CurCount-2].Bar;
   int i5=PeackTrough[CurCount-1].Bar;

   if(CurLastSellSig!=i4){
      double d1=K1*(v1-v2); // peak v1 is higher than peak v2
      if(v3>v1+d1){ // peak v3 is higher than peak v1
         if(v4<v1-d1){ // peak v4 is lower than peak v1
            double d2=K2*(v3-v2); // peak v3 is higher than peak v2
            if(v4>v2+d2){ // peak v4 is higher than peak v2
               double v5l=y3(i1,v1,i3,v3,i);
               if(v5>v5l){ // ZigZag breaks line 1-3 upwards
                  double v4x=y3(i1,v1,i3,v3,i4);
                  double v2x=y3(i1,v1,i3,v3,i2);
                  double h4=v4x-v4; // point 4' is higher than point 4
                  double h2=v2x-v2; // point 2' is higher than point 2
                  if(h2-h4>K3*h2){
                     double tb=TwoLinesCrossX(i1,v1,i3,v3,i2,v2,i4,v4);
                     double tv=y3(i1,v1,i4,v4,tb);
                     DnArrowBuffer[i]=high[i];
                     DnDotBuffer[i]=tv;
                     CurLastSellSig=i4;
                     if(_DrawWaves){
                        // drawing with other colors
                        DrawObjects(SellColor,
                                    SellTargetColor,
                                    v1,
                                    v2,
                                    v3,
                                    v4,
                                    v5l,
                                    i1,
                                    i2,
                                    i3,
                                    i4,
                                    i5,
                                    time,
                                    i,
                                    tb,
                                    tv,
                                    rates_total);
                     }
                  }
               }
            }
         }
      }
   }
}
The first difference is in the initial check:
// not enough peaks or not directed upwards
if(CurCount<5 || CurDir!=1){
   return;
}
If there are not enough peaks or ZigZag is directed downwards, the function operation should be completed.
For the downward direction, peaks and troughs change places: points 1, 3, 5, 6 are above, points 2, 4, 7 are below, therefore the places of some variables in formulas are also changed. Determining the minimum distance between peaks 1, 3 and 1, 4:
double d1=K1*(v1-v2); // peak v1 is higher than peak v2
Checking the position of peaks 1, 3:
if(v3>v1+d1){ // peak v3 is higher than peak v1
Checking the position of peaks 1, 4:
if(v4<v1-d1){ // peak v4 is lower than peak v1
Calculating the minimum distance between peaks 2, 3 and checking it:
double d2=K2*(v3-v2); // peak v3 is higher than peak v2
if(v4>v2+d2){ // peak v4 is higher than peak v2
Checking whether point 5 is formed (ZigZag breaks line 1-3 upwards):
if(v5>v5l){ // ZigZag breaks line 1-3 upwards
Calculating heights 2-2' and 4-4' to check if lines 1-3 and 2-4 meet on the right:
double h4=v4x-v4; // point 4' is higher than point 4
double h2=v2x-v2; // point 2' is higher than point 2
The wave and formations are drawn using different colors:
// drawing with other colors
DrawObjects(SellColor,
            SellTargetColor,
            v1,
            v2,
            v3,
            v4,
            v5l,
            i1,
            i2,
            i3,
            i4,
            i5,
            time,
            i,
            tb,
            tv,
            rates_total);
Drawing waves and targets
All waves and formations are drawn using a single algorithm, so one DrawObjects() function is used. Elements directed up and down are drawn in different colors. For this purpose, the color parameter BuyColor or SellColor is passed to the function. Waves and formations defining the target are also drawn in different colors, so parameters BuyTargetColor or SellTargetColor are also passed to the function. These variables are external variables of the indicator, using which you can set desired colors. In addition to color, a few more external parameters are required. Below are all the additional parameters required for the wave and object drawing function:
input bool   DrawWaves       =  true;             // enable drawing of waves and objects
input color  BuyColor        =  clrAqua;          // the color of buy waves
input color  SellColor       =  clrRed;           // the color of sell waves
input int    WavesWidth      =  2;                // the width of waves
input bool   DrawTarget      =  true;             // additionally enable/disable formations
input int    TargetWidth     =  1;                // the width of objects
input color  BuyTargetColor  =  clrRoyalBlue;     // the color of buy objects
input color  SellTargetColor =  clrPaleVioletRed; // the color of sell objects
After passing the color, all variables with the values and indexes of peak bars are passed to the function. The exception is the value of peak 5, for which the calculated value of line 1-3 is passed instead of the value at the end of the ZigZag segment. Coordinates of all ZigZag points are given in bars, while graphical objects need time, so a pointer to the 'time' array is passed to the function. The index of the calculated bar — i, target bar — tb, target value — tv, and the total number of bars on the chart — rates_total are passed to the function then.
We've already noted at the beginning of the article, that waves and objects should be drawn only if the ZigZag is calculated using high/low (SrcSelect is set to Src_HighLow) or close (SrcSelect is set to Src_Close). So, depending on the SrcSelect variable, drawing should be forcibly disabled in the OnInit() function (the DrawWaves variable). For this purpose we declare an additional variable that will be used instead of DrawWaves:
bool _DrawWaves; Next, in the OnInit () function, we set the value of the DrawWaves variable to it or disable it by setting to false. In addition, set an invisible color for the target drawing buffer:
if(SrcSelect==Src_HighLow || SrcSelect==Src_Close){
   _DrawWaves=DrawWaves;
}
else{
   _DrawWaves=false;
   PlotIndexSetInteger(2,PLOT_LINE_COLOR,clrNONE);
   PlotIndexSetInteger(3,PLOT_LINE_COLOR,clrNONE);
}
Let's move on to the DrawObjects() function. First, we provide the entire function code, and then we'll consider it in more detail:
void DrawObjects( color col,
                  color tcol,
                  double v1,
                  double v2,
                  double v3,
                  double v4,
                  double v5,
                  int i1,
                  int i2,
                  int i3,
                  int i4,
                  int i5,
                  const datetime & time[],
                  int i,
                  double target_bar,
                  double target_value,
                  int rates_total){

   // prefix for the graphical object names
   string prefix=MQLInfoString(MQL_PROGRAM_NAME)+"_"+IntegerToString(time[i])+"_";

   // drawing waves
   fObjTrend(prefix+"12",time[i1],v1,time[i2],v2,col,WavesWidth);
   fObjTrend(prefix+"23",time[i2],v2,time[i3],v3,col,WavesWidth);
   fObjTrend(prefix+"34",time[i3],v3,time[i4],v4,col,WavesWidth);
   fObjTrend(prefix+"45",time[i4],v4,time[i5],v5,col,WavesWidth);

   // drawing formations
   if(DrawTarget){

      datetime TargetTime;

      // getting an integer for the target bar index
      int tbc=(int)MathCeil(target_bar);

      if(tbc<rates_total){ // target within the existing bars on the chart
         TargetTime=time[tbc];
      }
      else{ // target in future
         TargetTime=time[rates_total-1]+(tbc-rates_total+1)*PeriodSeconds();
      }

      // calculating the values of lines on the target bar
      double tv13=y3(i1,v1,i3,v3,tbc);
      double tv24=y3(i2,v2,i4,v4,tbc);
      double tv14=y3(i1,v1,i4,v4,tbc);

      // formations

      fObjTrend(prefix+"13",time[i1],v1,TargetTime,tv13,tcol,TargetWidth);
      fObjTrend(prefix+"24",time[i2],v2,TargetTime,tv24,tcol,TargetWidth);
      fObjTrend(prefix+"14",time[i1],v1,TargetTime,tv14,tcol,TargetWidth);

      // horizontal target line
      fObjTrend(prefix+"67",TargetTime,tv24,TargetTime,tv14,tcol,TargetWidth);
      // vertical target line
      fObjTrend(prefix+"7h",time[i],target_value,TargetTime,target_value,tcol,TargetWidth);
   }
}
All drawing is performed using several trend lines, for which the common prefix of names is first formed:
// prefix for the graphical object names
string prefix=MQLInfoString(MQL_PROGRAM_NAME)+"_"+IntegerToString(time[i])+"_";
Then waves are drawn, coordinates of all peaks are passed to the function:
// drawing waves
fObjTrend(prefix+"12",time[i1],v1,time[i2],v2,col,WavesWidth);
fObjTrend(prefix+"23",time[i2],v2,time[i3],v3,col,WavesWidth);
fObjTrend(prefix+"34",time[i3],v3,time[i4],v4,col,WavesWidth);
fObjTrend(prefix+"45",time[i4],v4,time[i5],v5,col,WavesWidth);
Draw the formation that defines the goal. Check if drawing is enabled:
// drawing formations
if(DrawTarget){
If enabled, then draw the constructions. When displaying the indicator on history, the target bar is most likely to appear on an existing historic bar, but if waves are detected on recently emerged bars, the target can appear in future, i.e. to the right of the last bar. So, we need two variants of calculation of the target bar time. For this purpose we declare a variable:
datetime TargetTime; The target_bar variable has a fractional value, so let's increase it to the nearest integer:
// getting an integer for the target bar index
int tbc=(int)MathCeil(target_bar);
Then we will use the obtained tbc variable. Here we could use the MathFloor() function and obtain the nearest lower integer. This wouldn't affect the final result, because formations only have an informatory purpose. When using MathCeil(), the ends of lines 1-3 and 2-4 will necessarily intersect near the target bar, and formations will look more natural.
Let us determine the target reaching time. If the target is located on one of existing bars, we only need to calculate the index of the target bar and get its time from the 'time' array. If the target is on the right of the last bar, then we need to determine by how many bars the target is distanced from the last bar, as well as to calculate the time:
if(tbc<rates_total){ // target within the existing bars on the chart
   TargetTime=time[tbc];
}
else{ // target in future
   TargetTime=time[rates_total-1]+(tbc-rates_total+1)*PeriodSeconds();
}
Let's calculate the values of all lines (1-3, 2-4 and 1-4) on the target bar:
// calculating the values of lines on the target bar
double tv13=y3(i1,v1,i3,v3,tbc);
double tv24=y3(i2,v2,i4,v4,tbc);
double tv14=y3(i1,v1,i4,v4,tbc);
Despite the fact that the earlier calculated target value is passed to the function (the target_value variable), it will be calculated anew for formations and even for the line 2-4. This is connected with the fact that instead of the exact value from the target_bar variable, we use a value from the tbc variable, which is slightly larger than target_bar. By using these calculations we ensure that on the exact target_bar coordinate, the lines will intersect exactly at the target_value level.
Let us draw lines using the calculated values:
fObjTrend(prefix+"13",time[i1],v1,TargetTime,tv13,tcol,TargetWidth);
fObjTrend(prefix+"24",time[i2],v2,TargetTime,tv24,tcol,TargetWidth);
fObjTrend(prefix+"14",time[i1],v1,TargetTime,tv14,tcol,TargetWidth);
Lines are drawn using the auxiliary fObjTrend() function:
void fObjTrend(   string  aObjName,
                  datetime aTime_1,
                  double   aPrice_1,
                  datetime aTime_2,
                  double   aPrice_2,
                  color    aColor      =  clrRed,
                  color    aWidth      =  1,
                  bool     aRay_1      =  false,
                  bool     aRay_2      =  false,
                  string   aText       =  "",
                  int      aWindow     =  0,
                  color    aStyle      =  0,
                  int      aChartID    =  0,
                  bool     aBack       =  false,
                  bool     aSelectable =  false,
                  bool     aSelected   =  false,
                  long     aTimeFrames =  OBJ_ALL_PERIODS
               ){
   ObjectCreate(aChartID,aObjName,OBJ_TREND,aWindow,aTime_1,aPrice_1,aTime_2,aPrice_2);
   ObjectSetInteger(aChartID,aObjName,OBJPROP_BACK,aBack);
   ObjectSetInteger(aChartID,aObjName,OBJPROP_COLOR,aColor);
   ObjectSetInteger(aChartID,aObjName,OBJPROP_SELECTABLE,aSelectable);
   ObjectSetInteger(aChartID,aObjName,OBJPROP_SELECTED,aSelected);
   ObjectSetInteger(aChartID,aObjName,OBJPROP_TIMEFRAMES,aTimeFrames);
   ObjectSetString(aChartID,aObjName,OBJPROP_TEXT,aText);
   ObjectSetInteger(aChartID,aObjName,OBJPROP_WIDTH,aWidth);
   ObjectSetInteger(aChartID,aObjName,OBJPROP_STYLE,aStyle);
   ObjectSetInteger(aChartID,aObjName,OBJPROP_RAY_LEFT,aRay_1);
   ObjectSetInteger(aChartID,aObjName,OBJPROP_RAY_RIGHT,aRay_2);
   ObjectMove(aChartID,aObjName,0,aTime_1,aPrice_1);
   ObjectMove(aChartID,aObjName,1,aTime_2,aPrice_2);
}
It is a universal function, which can also be used to quickly create a trend line and set all its parameters. The function parameters are described in table 1. The most frequently changed parameters are at the beginning of the table (5 required parameters), the rest are optional, you can choose not to pass them to the function. This variation makes the use of the function very convenient.
Table 1. The fObjTrend() function parameters
| Parameter | Purpose |
|---|---|
| string aObjName | Object name |
| datetime aTime_1 | The time of the first anchor point |
| double aPrice_1 | The price of the first anchor point |
| datetime aTime_2 | The time of the second anchor point |
| double aPrice_2 | The price of the second anchor point |
| color aColor | Color |
| color aWidth | Width |
| bool aRay_1 | Extend the line from the first anchor point |
| bool aRay_2 | Extend the line from the second anchor point |
| string aText | Hint text |
| int aWindow | Subwindow |
| color aStyle | Line style |
| int aChartID | Chart ID |
| bool aBack | Draw in the background |
| bool aSelectable | The object is selectable |
| bool aSelected | The object is selected |
| long aTimeFrames | Timeframes to draw the line on |
Now we need to draw two additional lines: a vertical line on the target bar, and a horizontal line on the target level:
fObjTrend(prefix+"67",TargetTime,tv24,TargetTime,tv14,tcol,TargetWidth);
fObjTrend(prefix+"7h",time[i],target_value,TargetTime,target_value,tcol,TargetWidth);
As a result, we get an image of waves and formations:
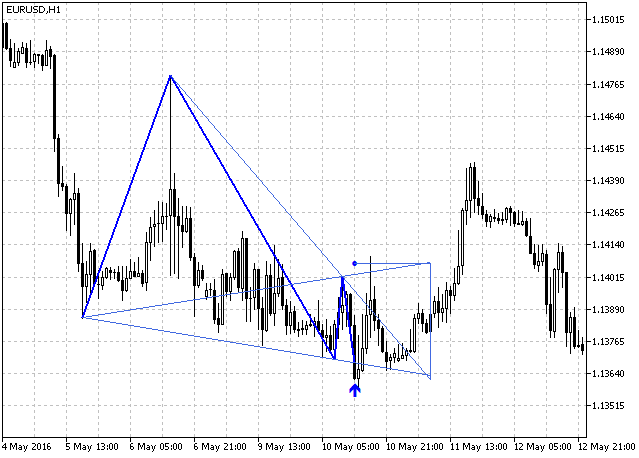
Fig. 4. Wolfe Waves and formations for determining the target for buy trades
Deleting graphical objects
When using a ZigZag based on Close (SrcSelect=Src_Close) or based on another indicator, a shape may appear or disappear from time to time while the bar is being formed. For this purpose, the buffers with arrows and points are cleared at the beginning of the main indicator cycle:
UpArrowBuffer[i]=EMPTY_VALUE;
DnArrowBuffer[i]=EMPTY_VALUE;

UpDotBuffer[i]=EMPTY_VALUE;
DnDotBuffer[i]=EMPTY_VALUE;
Deletion of graphical objects should also be implemented at the cycle beginning. If drawing of waves and formations is enabled, then the DeleteObjects() function is called at the beginning of the indicator cycle:
if(_DrawWaves){
   DeleteObjects(time[i]);
}
The DeleteObjects() function code:
void DeleteObjects(datetime time){
   string prefix=MQLInfoString(MQL_PROGRAM_NAME)+"_"+IntegerToString(time)+"_";
   ObjectDelete(0,prefix+"12");
   ObjectDelete(0,prefix+"23");
   ObjectDelete(0,prefix+"34");
   ObjectDelete(0,prefix+"45");
   ObjectDelete(0,prefix+"13");
   ObjectDelete(0,prefix+"24");
   ObjectDelete(0,prefix+"14");
   ObjectDelete(0,prefix+"67");
   ObjectDelete(0,prefix+"7h");
}
The time of the calculated bar is passed to the function. All graphical objects with the names corresponding to the calculated bar are also deleted in this function.
When removing the indicator form the chart, we need to delete all graphical objects that were created by the indicator. The ObjectsDeleteAll() function is called from the DeInit() function, which is automatically executed when the indicator operation is completed. The name of the indicator, which is also used as a prefix for all its graphical objects, is passed as the second parameter to the function. This ensures that only graphical objects belonging to the indicator will be deleted:
void OnDeinit(const int reason){
   ObjectsDeleteAll(0,MQLInfoString(MQL_PROGRAM_NAME));
   ChartRedraw(0);
}
The alert function
Let us add to the indicator an alert function to notify of every new arrow. The function is similar to the one used in the universal trend indicator described in "Universal Trend with the Graphical Interface".
The alert function allows you to track the emergence of an arrow on the forming bar (suitable for the high-low based ZigZag) or on a formed bar (suitable for a ZigZag based on close or other indicators). Let us create an enumeration for selecting the alert type:
enum EAlerts{
   Alerts_off=0,  // the alert is disabled
   Alerts_Bar0=1, // alert on the forming bar
   Alerts_Bar1=2  // alert on a completed bar
};
Add the variable to the properties window:
input EAlerts Alerts = Alerts_off; The alert function code is available as a separate CheckAlerts() function. The number of bars on the chart and the time array are passed to this function:
void CheckAlerts(int rates_total,const datetime & time[]){
   if(Alerts!=Alerts_off){ // alerts are enabled
      static datetime tm0=0; // a variable for the time of the bar of the last buy alert
      static datetime tm1=0; // a variable for the time of the bar of the last buy alert
      if(tm0==0){ // the first function execution
         // initialization of variables
         tm0=time[rates_total-1];
         tm1=time[rates_total-1];
      }
      string mes=""; // a variable for the message

      // there is an arrow up, and there was no alert at the last bar
      if(UpArrowBuffer[rates_total-Alerts]!=EMPTY_VALUE &&
         tm0!=time[rates_total-1]
      ){
         tm0=time[rates_total-1]; // remember the last alert time
         mes=mes+" buy"; // forming a message
      }

      // there is an arrow down, and there was no alert at the last bar
      if(DnArrowBuffer[rates_total-Alerts]!=EMPTY_VALUE &&
         tm1!=time[rates_total-1]
      ){
         tm1=time[rates_total-1]; // remember the last alert time
         mes=mes+" sell"; // forming a message
      }
      if(mes!=""){ // there is a message
         // opening a window with the message
         Alert(MQLInfoString(MQL_PROGRAM_NAME)+"("+Symbol()+","+IntegerToString(PeriodSeconds()/60)+"):"+mes);
      }
   }
}
The CheckAlerts() function is called at the end of the OnCalculate() function after the main cycle. A chart refresh function for speeding up wave and construction drawing is also called at the end of the OnCalculate() function:
if(_DrawWaves){
   ChartRedraw(0);
}
Now creation of the indicator is fully complete. It is called iWolfeWaves, and is available in the attachment to the article.
Expert Advisor
We have created a rather complicated indicator. Let's try to make sure that it can work properly not only on a static history, and evaluate the effectiveness of the considered method of graphical analysis. To do this, we create a simple Expert Advisor.
The EA should open positions on all signals of the indicator. This will allow us to evaluate the effectiveness. Therefore, it will work on hedging accounts, and will not have restrictions on the number of open positions.
Let us create a new Expert Advisor in the editor, and name it eWolfeWaves. Copy external parameters from the indicator and add them to the EA file. Below we add additional parameters that determine stop-loss and take-profit:
input double               StopLoss_K     =  1;      // stop loss ratio
input bool                 FixedSLTP      =  false;  // fixed stop loss and take profit
input int                  StopLoss       =  50;     // the fixed stop loss value
input int                  TakeProfit     =  50;     // the fixed take profit value
These parameters will allow us to choose one of two SL and TP options.
If FixedSLTP=false, the StopLoss_K variable is used. In this case Take Profit is set based on the indicator value — at the level of the point denoting the target, and Stop Loss is calculated in proportion to Take Profit using the StopLoss_K multiplier. This SL and TP defining option is only suitable for the price-based ZigZag: using high-low or close (SrcSelect is set to Src_HighLow or Src_Close).
If FixedSLTP=true, the StopLoss and TakeProfit variables are used. It can be used both for ZigZag based on indicators and on price values.
We check the account type in the OnInit() function. If the account does not allow hedging, the EA operation will stop:
if(AccountInfoInteger(ACCOUNT_MARGIN_MODE)!=ACCOUNT_MARGIN_MODE_RETAIL_HEDGING){
   Print("Its not hedging account");
   return(INIT_FAILED);
}
If the Expert Advisor is not tested in the visual mode, we disable drawing of waves and formations:
bool _DrawWaves;

if(MQLInfoInteger(MQL_VISUAL_MODE)){
   _DrawWaves=DrawWaves;
}
else{
   _DrawWaves=false;
}
The _DrawWaves variable will be used instead of DrawWaves when the iWolfeWaves indicator is called by the iCustom() function. Call the indicator and check if it is successfully loaded:
h=iCustom(  Symbol(),
            Period(),
            "iWolfeWaves",
            Alerts,
            SrcSelect,
            DirSelect,
            RSIPeriod,
            RSIPrice,
            MAPeriod,
            MAShift,
            MAMethod,
            MAPrice,
            CCIPeriod,
            CCIPrice,
            ZZPeriod,
            K1,
            K2,
            K3,
            _DrawWaves,
            BuyColor,
            SellColor,
            WavesWidth,
            DrawTarget,
            TargetWidth,
            BuyTargetColor,
            SellTargetColor);

if(h==INVALID_HANDLE){
   Print("Cant load indicator");
   return(INIT_FAILED);
}
If the indicator loading fails, the EA operation should stop.
When using a high-low based indicator, the arrow does not disappear, so the EA can work on the incomplete current bar. In all other cases, the EA should check the indicator arrow on the first complete bar. For this purpose we use the EA's global variable 'Shift':
int Shift; Set a required value to it depending on the ZigZag type:
if(SrcSelect==Src_HighLow){
   Shift=0;
}
else{
   Shift=1;
}
Below is the entire code of the OnInit() function:
int OnInit(){

   // checking the account type
   if(AccountInfoInteger(ACCOUNT_MARGIN_MODE)!=ACCOUNT_MARGIN_MODE_RETAIL_HEDGING){
      Print("Its not hedging account");
      return(INIT_FAILED);
   }

   // disable drawing of waves and formations

   bool _DrawWaves;

   if(MQLInfoInteger(MQL_VISUAL_MODE)){
      _DrawWaves=DrawWaves;
   }
   else{
      _DrawWaves=false;
   }

   // loading the indicator
   h=iCustom(  Symbol(),
               Period(),
               "iWolfeWaves",
               Alerts,
               SrcSelect,
               DirSelect,
               RSIPeriod,
               RSIPrice,
               MAPeriod,
               MAShift,
               MAMethod,
               MAPrice,
               CCIPeriod,
               CCIPrice,
               ZZPeriod,
               K1,
               K2,
               K3,
               _DrawWaves,
               BuyColor,
               SellColor,
               WavesWidth,
               DrawTarget,
               TargetWidth,
               BuyTargetColor,
               SellTargetColor);

   // checking if the indicator has been loaded successfully
   if(h==INVALID_HANDLE){
      Print("Cant load indicator");
      return(INIT_FAILED);
   }

   // define the bar on which the EA should check the indicator arrow
   if(SrcSelect==Src_HighLow){
      Shift=0;
   }
   else{
      Shift=1;
   }

   return(INIT_SUCCEEDED);
}
Let's move on to the OnTick() function. The EA must be able to work both with bars and ticks. Let's add variables for the time of the forming bar and of the last processed bar (the variables are declared in the OnTick() function):
datetime tm[1];     // time of the forming bar
static datetime lt; // time of the last processed bar
Get the time of the last (forming) bar:
if(CopyTime(Symbol(),Period(),0,1,tm)<=0)return;
Check the bar time:
if(Shift==0 || tm[0]!=lt){
If Shift==0, the EA works on every tick. Otherwise, if the lt variable is not equal to the time of the forming bar (calculation once pro bar).
Declare auxiliary variables and get indicator values:
double tp,sl; // variables for the calculation of stop loss and take profit

double buf_buy[1];         // for a buy arrow
double buf_sell[1];        // for a sell target

double buf_buy_target[1];  // for a buy target
double buf_sell_target[1]; // for a sell target

if(CopyBuffer(h,0,Shift,1,buf_buy)<=0)return;
if(CopyBuffer(h,1,Shift,1,buf_sell)<=0)return;
if(CopyBuffer(h,2,Shift,1,buf_buy_target)<=0)return;
if(CopyBuffer(h,3,Shift,1,buf_sell_target)<=0)return;
If there are trading signals, stop loss and take profit are calculated, and a position is opened:
// there is an arrow, no buy position has been opened on this bar
if(buf_buy[0]!=EMPTY_VALUE && LastBuyTime!=tm[0]){
   // stop loss and take profit
   if(FixedSLTP){
      tp=SymbolInfoDouble(Symbol(),SYMBOL_ASK)+_Point*TakeProfit;
      sl=SymbolInfoDouble(Symbol(),SYMBOL_ASK)-_Point*StopLoss;
   }
   else{
      tp=NormalizeDouble(buf_buy_target[0],_Digits);
      double ask=SymbolInfoDouble(Symbol(),SYMBOL_ASK);
      sl=NormalizeDouble(ask-StopLoss_K*(tp-ask),_Digits);
   }
   // opening
   if(!trade.Buy(0.1,Symbol(),0,sl,tp))return;
   // "remember" the last open time
   LastBuyTime=tm[0];
}
If fixed SL and TP are used (FixedStopLoss=true), Take Profit will be calculated by adding the value of the TakeProfit variable multiplied by _Point to the position open price (Ask price when buying). To calculate Stop Loss, the value of the StopLoss variable multiplied by _Point is subtracted from the open price. After the calculations, the resulting values are normalized using the NormalizeDouble() function up to the number of decimal places corresponding to the number of digits in symbol quotes (this number can be obtained using the _Digits variable).
If SL and TP are not fixed, we first determine the value of Take Profit, and then calculate Stop Loss. If position opening fails, the OnTick() function is terminated, a new attempt to open a position will be made on the next tick. Attempts will be made all the time as long as there is the indicator signal, i.e. during one bar. If a position is opened successfully, the time of the current bar will be assigned to the LastBuyTime variable to avoid re-opening on the same bar (when working with ticks, i.e. Shift=0). LastBuyTime is the global variable of the Expert Advisor.
Selling is similar to buying, with a few corrections:
// there is an arrow, no sell position has been opened on this bar
if(buf_sell[0]!=EMPTY_VALUE && LastSellTime!=tm[0]){
   // Stop Loss and Take Profit
   if(FixedSLTP){
      tp=SymbolInfoDouble(Symbol(),SYMBOL_BID)-_Point*TakeProfit;
      sl=SymbolInfoDouble(Symbol(),SYMBOL_BID)+_Point*StopLoss;
   }
   else{
      tp=NormalizeDouble(buf_sell_target[0],_Digits);
      double bid=SymbolInfoDouble(Symbol(),SYMBOL_ASK);
      sl=NormalizeDouble(bid+StopLoss_K*(bid-tp),_Digits);
   }
   // opening
   if(!trade.Sell(0.1,Symbol(),0,sl,tp))return;
   // "remember" the last open time
   LastSellTime=tm[0];
}
For buy trades, LastSellTime is used instead of the LastBuyTime variable, and Stop Loss / Take profit levels are calculated using the bid price.
At the end, the time of the forming bar is assigned to the lt variable, to prevent the EA from performing any action on the same bar (if the EA is set to work on each bar, i.e. Shift=1). Below is the entire code of the OnTick() function:
void OnTick(){

   datetime tm[1]; // time of the forming bar
   static datetime lt; // time of the last processed bar

   // copy the time
   if(CopyTime(Symbol(),Period(),0,1,tm)<=0)return;

   if(Shift==0 || tm[0]!=lt){ // check if the EA operates once pro bar

      double tp,sl; // variables for the calculation of stop loss and take profit

      double buf_buy[1];         // for a buy arrow
      double buf_sell[1];        // for a sell target

      double buf_buy_target[1];  // for a buy target
      double buf_sell_target[1]; // for a sell target

      if(CopyBuffer(h,0,Shift,1,buf_buy)<=0)return;
      if(CopyBuffer(h,1,Shift,1,buf_sell)<=0)return;
      if(CopyBuffer(h,2,Shift,1,buf_buy_target)<=0)return;
      if(CopyBuffer(h,3,Shift,1,buf_sell_target)<=0)return;

      // there is an arrow, no buy position has been opened on this bar
      if(buf_buy[0]!=EMPTY_VALUE && LastBuyTime!=tm[0]){
         // stop loss and take profit
         if(FixedSLTP){
            tp=SymbolInfoDouble(Symbol(),SYMBOL_ASK)+_Point*TakeProfit;
            sl=SymbolInfoDouble(Symbol(),SYMBOL_ASK)-_Point*StopLoss;
         }
         else{
            tp=NormalizeDouble(buf_buy_target[0],_Digits);
            double ask=SymbolInfoDouble(Symbol(),SYMBOL_ASK);
            sl=NormalizeDouble(ask-StopLoss_K*(tp-ask),_Digits);
         }
         // opening
         if(!trade.Buy(0.1,Symbol(),0,sl,tp))return;
         // "remember" the last open time
         LastBuyTime=tm[0];
      }

      // there is an arrow, no sell position has been opened on this bar
      if(buf_sell[0]!=EMPTY_VALUE && LastSellTime!=tm[0]){
         // stop loss and take profit
         if(FixedSLTP){
            tp=SymbolInfoDouble(Symbol(),SYMBOL_BID)-_Point*TakeProfit;
            sl=SymbolInfoDouble(Symbol(),SYMBOL_BID)+_Point*StopLoss;
         }
         else{
            tp=NormalizeDouble(buf_sell_target[0],_Digits);
            double bid=SymbolInfoDouble(Symbol(),SYMBOL_ASK);
            sl=NormalizeDouble(bid+StopLoss_K*(bid-tp),_Digits);
         }
         // opening
         if(!trade.Sell(0.1,Symbol(),0,sl,tp))return;
         // "remember" the last open time
         LastSellTime=tm[0];
      }

      lt=tm[0];
   }
}
The Expert Advisor code can be found in the attached eWolfeWaves file.
Let's test the resulting Expert Advisor. If you attach the indicator to the chart after testing, you can see that the EA enters the market at each arrow regardless of whether there are open positions (Fig. 5).
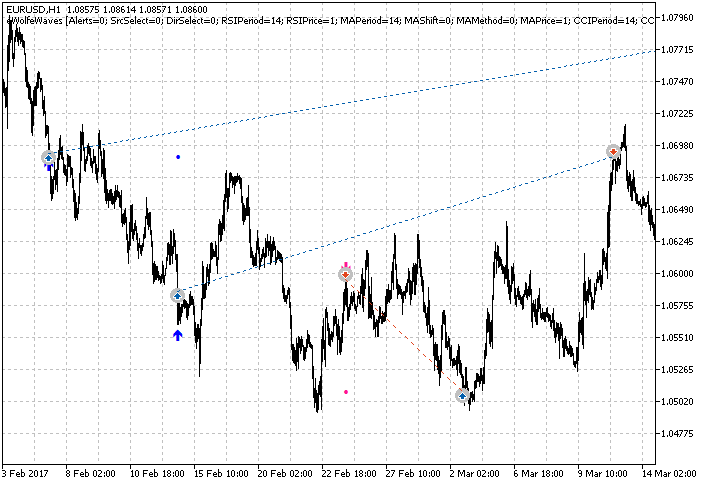
Fig. 5. The Expert Advisor enters at each indicator arrow
Of course, we are first of all interested in how effective the indicator is in trading. The results of the EA testing with default settings using the entire EURUSD H1 history are shown in Fig. 6.
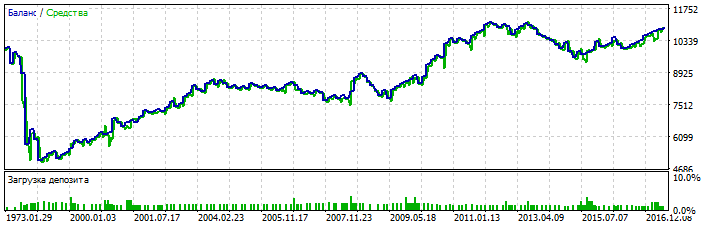
Fig. 6. EA testing results on the entire EURUSD H1 history
At the very beginning of the testing interval, there is a significant drop, which is possibly related to the low quality of history at the initial stage. Further, beginning with about 1991, a period of steady growth starts. In general, testing results are positive even without optimization and additional checks.
A few more tips from Bill Wolfe's book
In addition to wave detection rules, Bill Wolfe provides a few tips, which he calls 'psychological and technical remarks'. One of the most important technical remarks is the advice to monitor the tick volume: it can be decreased at reversal points, and this decrease may indicate a reversal. The second advice is to follow trend lines. The wave movements discovered by Bill Wolfe often occur after a trend break, i.e. after the breakout of the trend line. I.e. waves appearing after trend breakout can be more reliable. The third advice is to monitor line 1-4, especially point 4, and exit in case of any unforeseen events: backward wave, a strong increase in volume or in case of a quick good profit.
Conclusion
The positive results of Expert Advisor testing (even with default settings) suggest that the graphical analysis method discussed in the article is definitely effective and can be interesting for further investigation.
Some of readers may want to improve the indicator. At the moment, indicator external parameters have three variable coefficients: K1, K2, K3. K1 is used for checking the position of point 3 relative to point 1, and position of point 4 relative to point 1. Probably, it would be better to use separate coefficients for these checks. On the other hand, an increase in the number of parameters complicates optimization and increases the risk overfitting instead of optimization. It may be better to combine the coefficients K1 and K2. This will make the indicator setup easier and more understandable. On the other hand, it may be better to leave only one coefficient. The indicator code is clearly divided by functions to make its modification easier. Everyone can try to modify the indicator in different ways.
In addition to using the indicator to search for Wolfe waves, it can be used as a template when creating other indicators that search for any other ZigZag patterns. You only need to change the code of the CheckUp and CheckDn functions. The most important thing is that the question of accessing ZigZag values has been solved.
I'd like to draw special attention to the trick with variables CurCount, PreCount and LastTime. This is not only a solution to the narrow problem analyzed in this article. When developing indicators, we very often need additional buffers for auxiliary values obtained during intermediate calculations. On each bar, the value from the previous buffer element is moved to the current one; occasionally this value is changed. The value of one element is used in calculations, while the entire buffer is used for this purpose. Using two variables allows to significantly reduce the amount of RAM used by the indicator.
Attachments
The files of indicators and the Expert Advisor created in this article are attached below. The files are placed in right folders. They should be saved to the same folders of the terminal. The following files are available in the attachment:
- Indicators/iWolfeWaves_Step_1.mq5
- Indicators/iWolfeWaves.mq5
- Experts/eWolfeWaves.mq5
To provide the operation of the above files, you will also need to download files from the article "Universal ZigZag":
- Indicators/iUniZigZagSW.mq5
- Include/CSorceData.mqh
- Include/CZZDirection.mqh>
- Include/CZZDraw.mqh
Translated from Russian by MetaQuotes Ltd.
Original article: https://www.mql5.com/ru/articles/3131
Warning: All rights to these materials are reserved by MetaQuotes Ltd. Copying or reprinting of these materials in whole or in part is prohibited.
This article was written by a user of the site and reflects their personal views. MetaQuotes Ltd is not responsible for the accuracy of the information presented, nor for any consequences resulting from the use of the solutions, strategies or recommendations described.

- Free trading apps
- Over 8,000 signals for copying
- Economic news for exploring financial markets
You agree to website policy and terms of use
Hello the indicators are giving error.
Follow image
The files of indicators and the Expert Advisor created in the article are attached below the article.
The files are placed in right folders.
They should be saved to the same folders of the terminal.
Thank you for sharing, to introduce a gold 0.3 U.S. dollars can return to the capital of the broker, there is a need to contact the user name WeChat whkh18