
Auto search for divergences and convergences

Contents
- Introduction
- Divergence and convergence (concept definition)
- Methods for determining the price and indicator movement direction
- Defining tops/bottoms using bars
- Defining tops/bottoms by a threshold value
- Maximum/minimum value above/below the indicator center line
- Divergence classification systems
- Complete systematization of the price and indicator movement
- Triple divergence
- Universal indicator for defining divergence
- Selecting an oscillator
- Creating a new indicator
- Applying a universal oscillator
- Defining the oscillator extreme values
- Extreme values definition classes
- Defining extreme values by bars
- Defining extreme values by a threshold value
- Defining extreme values by their position relative to the oscillator's midpoint
- Method of setting the divergence type
- Classes for checking divergence conditions
- Preparing for checking the divergence conditions
- Defining divergence
- Indicator completion
- Conclusion
- Attachments
Introduction
The term "divergence" comes from the Latin word "divergere" ("to detect discrepancy"). The divergence is usually defined as a discrepancy in the indicator readings and the price movement. The antonymous term is "convergence" coming from the Latin word "convergo" ("I bring together"). There are broader divergence/convergence classification systems, including such definitions as "hidden divergence", "extended divergence", divergences of A, B and C classes etc.
In this article, we will first deal with the basic terms: divergence and convergence. Then we will dwell on other methods of their classification, perform their comparative analysis as well as identify the advantages and disadvantages. Finally, we will develop our own classification which is more complete and has no evident drawbacks, as well as a universal indicator for searching and displaying convergences/divergences on the chart.
Divergence and convergence (concept definition)
So, divergence is a discrepancy in the indicator readings and the price movement. We also have the second term — convergence — having the opposite meaning. According to this logic, if divergence is a discrepancy in the indicator readings and the price movement, then convergence means conformity. However, this is not the case since conformity cannot be equated to convergence.
In order for both terms — divergence and convergence — to have a more precise meaning, they need more narrow definitions. Let's look at the price and indicator charts. If the price moves up, while the indicator goes down, we have a divergence. If the price moves down, while the indicator goes up, we have a convergence (Fig. 1).
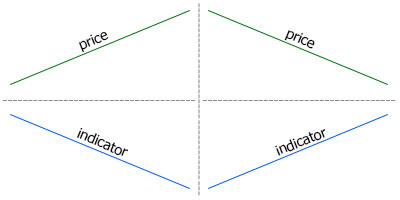
Fig. 1. Discrepancy in the price and the indicator movements. On the left, the price moves up,
while the indicator moves down — divergence. On the right, the price moves down, while the indicator moves up — convergence
We are used to the fact that the indicator is usually placed below the price chart, so this definition seems acceptable at first glance. However, if we reverse the positions of the indicator and the price chart, everything changes radically: divergence turns into convergence and vice versa (Fig. 2).
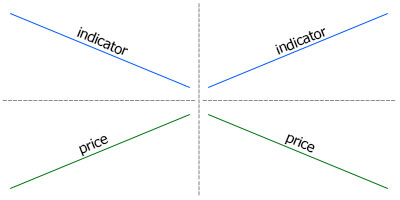
Fig. 2. Discrepancy in the price and the indicator movements. On the left, the price moves up,
while the indicator moves down — convergence. On the right, the price moves down, while the indicator moves up — divergence
Now have a look at Figures 1 and 2 from the point of view of choosing the direction of trade. Suppose that the price moves up, while the indicator moves down, so we have decided to sell. Following the analogy, we should sell when the price moves down, while the indicator moves up (Fig. 3).
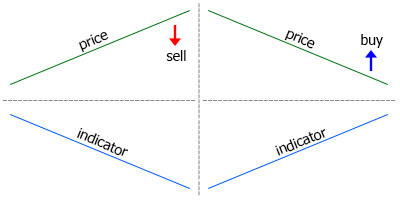
Fig. 3. Left: conditions for selling, the price and the indicator diverge. Right: conditions
for buying (similar to selling ones), the price and the indicator converge
It turns out that in case of selling, the price and the indicator diverge, while in case of buying, they converge, although buy and sell conditions are identical albeit opposite. This means, we can call one of the conditions bearish, while the second one is bullish. This means the location of the indicator below the price chart is not enough to define convergence and divergence.
All provided definitions have to do with selling direction, while the case is opposite for buying. But there is a simpler and more precise version of the definition based on the very essence of technical analysis. If we add the assumption of the further price movement to the definition of divergence and convergence, it becomes simple and concise.
Divergence is a price reversal signal in the form of a discrepancy of the indicator readings and the price movement direction
Since this is a reversal signal, the price should first move up for selling and down — for buying. In order for the said discrepancy to appear, the indicator should move down and up respectively. In this definition, selling is used as a specimen direction, while the indicator should be placed under the price chart. Divergence shown on Fig. 3 follows this definition.
Convergence represents the opposite case: now, the price should move down, while the indicator moves up. However, the estimated price direction does not change. Hence, the following convergence definition:
Convergence is a trend continuation signal in the form of a discrepancy of the indicator readings and the price movement direction
Since this is a continuation signal, the price should move down for selling and up — for buying. The indicator should move up and down respectively (Fig. 4).
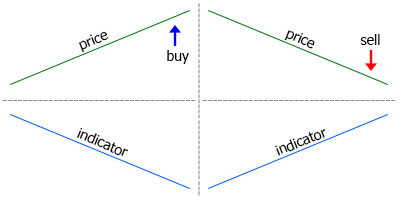
Fig. 4. Convergence signals
Of course, one can argue whether the divergence is a reversal signal, and convergence is a continuation signal. But this is already a matter of practical application of the technical analysis possibilities.
The Fig. 5 shows divergence and convergence signals simultaneously to let you master the terminology.
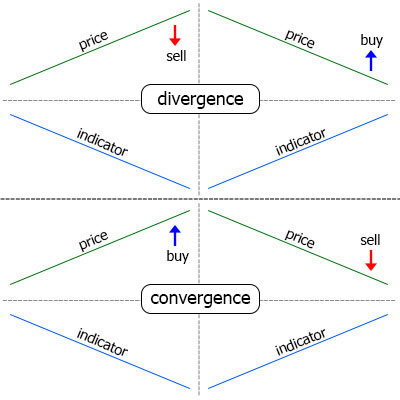
Fig. 5. Divergence and convergence signals
Methods for determining the price and indicator movement direction
The indicator and price chart line have been straight so far. But this is an abstraction that has nothing to do with the real price movement. Therefore, let's consider the methods that can be used to define the price and indicator direction and detect a divergence. Then, we will have a look at the divergences classification systems in practice.
In general, we first need to identify the prices or the tops and bottoms on the chart, then compare their values. The bullish divergence (buy signals) is detected by bottoms: if one bottom is higher than the previous one, then the indicator is pointing upwards, and vice versa. The bearish divergence (sell signals) is detected by the tops.
There are three ways to detect extreme points on the chart.
- By bars.
- By overcoming the threshold value from the last High/Low.
- Maximum/minimum value is above/below the center line of the indicator.
Detecting tops/bottoms by bars. We use the number of top/bottom bars. For example, if the parameter is 2, the indicator value at the top bar should exceed two bars to the left and two bars to the right. Accordingly, the value for the bottom should be lower than the one for the neighboring bars (Fig. 6).
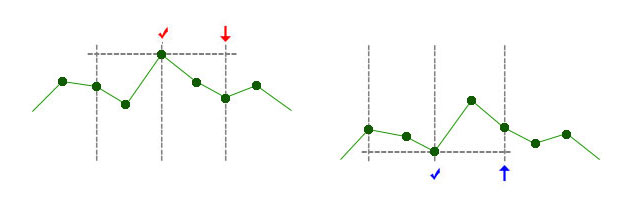
Fig. 6. Defining tops and bottoms by two bars. The definition of the top is to the left. On the bar marked with arrow, it became known
of the top marked by a check mark. The definition of the bottom is to the right
The required number of bars to the left and right of the top/bottom may vary: for example, 5 to the left and 2 to the right (Fig. 7).
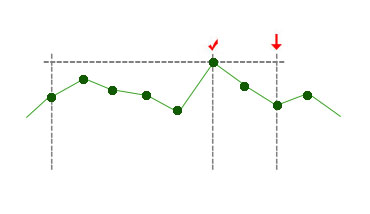
Fig. 7. The top defined by five bars to the left and two bars to the right
Defining tops/bottoms by a threshold value. When the indicator moves up, the system tracks its maximum value. On the bars without a new extreme value, the current value is compared with the previously fixed top/bottom. If the difference exceeds the threshold set by the external parameter, it is assumed that the indicator has changed direction, while the bar, at which the maximum/minimum value has been reached is considered the top/bottom (Fig. 8).
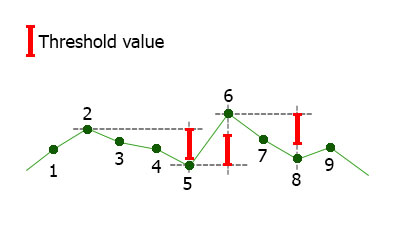
Fig. 8. Defining tops and bottoms by the threshold value. The threshold value is displayed in the upper left corner.
Up to bar 2, the indicator moved up, the maximum value has been fixed at bar 2, while at bar 5, the value
has decreased by the threshold value meaning the indicator changes its direction. At bar 6, the indicator
has overcome the threshold value again and changed direction etc.
Defining by bars is the most convenient since it does not depend on the indicator at all. On the contrary, the value of the threshold value depends on the indicator type. For example, for RSI with the oscillation range 0-100, the threshold value can be about 5. For Momentum, the threshold is 0.1-1, since the indicator slightly fluctuates around the level of 100. Besides, the magnitude of these fluctuations depends on the timeframe. This further complicates the use of the threshold value.
Maximum/minimum value is above/below the center line of the indicator. This method is used less often than other ones. It also depends on the applied indicator since not all indicators have an average value of 0 (for example, the average value of RSI is 50). But its main drawback is a strong lag (Fig. 9).
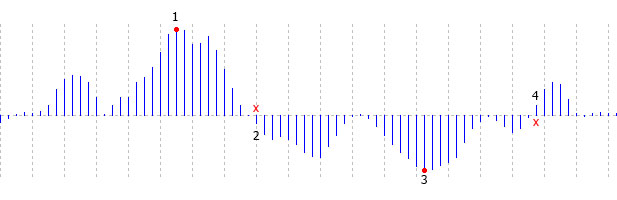
Fig. 9. Defining tops and bottoms by crossing the central line. We will know about the top 1
only after the central line is crossed on the bar 2. We will know about the bottom 3
after the crossing on the bar 4
Divergence classification systems
You can find a lot of articles about divergence on the web. They describe a variety of approaches that differ both in terminology and in the principles of systematizing divergence and convergence. You can find simple, classic, hidden and extended divergence. Someone, authors divide it into A, B and C classes. We are not going to analyze the primary sources in this article. Instead, let's pass through some of the identified types.
Classic divergence. This type has already been described above and shown in Fig. 5.
Hidden divergence. The hidden divergence differs from the classic one by the direction of the price movement and indicator movements. In other words, the hidden divergence is similar to convergence.
Extended Divergence. So far, we have discussed only the up and down directions of the price and the indicator movement. If we add the horizontal movement, the number of options increases. Despite multiple options we can obtain by combining three directions of price movement and three directions of the indicator movement, only one version of the extended divergence has been singled out:
- Horizontal price movement, the indicator is moving downwards — extended bearish divergence (sell signal)
- Horizontal price movement, the indicator is moving upwards — extended bullish divergence (buy signal).
Classes: A, B, C. А class is a classic divergence, while B and C classes are extended divergence versions.
B class:
- Horizontal price movement, the indicator is moving downwards — bearish (sell signal).
- Horizontal price movement, the indicator is moving upwards — bullish (buy signal).
С class:
- The price goes up, the indicator tops are at one level — bearish (sell signal).
- The price goes down, the indicator bottoms are at one level — bullish (buy signal).
As we can see, B and С classes are the methods of extended divergence. The B class fully repeats the above definition.
The main conclusion I have made while browsing through available materials on divergence is the lack of clear terminology and incomplete coverage of possible versions. Therefore, we will analyze the various options for combining the price and the indicator directions and systematize them.
Complete systematization of the price and indicator movement
First, let's define two possible price and indicator movement directions.
- Two movement directions: up and down.
- Three movement directions: up, down and horizontal.
The first case provides only four possible combinations. Let's have a look at them using sell signals as an example.
- Price up, indicator up.
- Price up, indicator down (divergence).
- Price down, indicator up (convergence).
- Price down, indicator down.
Now that we have dealt with direction defining methods, let's visualize these options (Fig. 10).
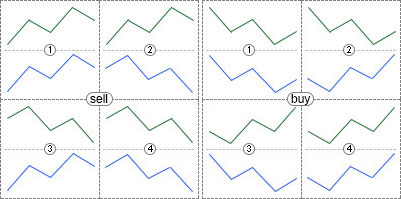
Fig. 10. All possible combinations of the price and the indicator movements in case of two available directions
In case of three directions, there already may be nine combinations.
- Price up, indicator up.
- Price up, indicator horizontal.
- Price up, indicator down (divergence).
- Price horizontal, indicator up.
- Price horizontal, indicator horizontal.
- Price horizontal, indicator down.
- Price down, indicator up (convergence).
- Price down, indicator horizontal.
- Price down, indicator down.
All these combinations are displayed in Fig. 11.
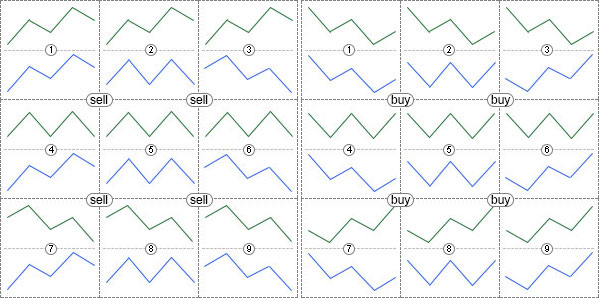
Fig. 11. All possible combinations of the price and the indicator movements in case of three available directions
If you create an indicator that allows you to choose any of the options considered, then you are able to choose the divergence, convergence, hidden or extended divergence you think to be correct. In other words, we get a universal indicator useful even for those who do not agree with the systematization and the definitions given in this article.
Triple divergence
Until now, the direction of the price and the indicator movement was determined by two points: up, down and horizontally. We may add the third point to increase the number of possible price and indicator movement options. In total, there are nine options:
- Up, up.
- Up, horizontal.
- Up, down.
- Horizontal, up.
- Horizontal, horizontal.
- Horizontal, down.
- Down, up.
- Down, horizontal.
- Down, down.
In this case, it would be more correct to speak of the form of movement rather than direction. Movement types defined by three tops are displayed in Fig. 12.
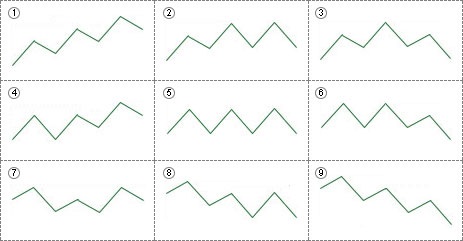
Fig. 12. Various possible movements based on three tops
The appropriate movements based on bottoms are displayed in Fig. 13.
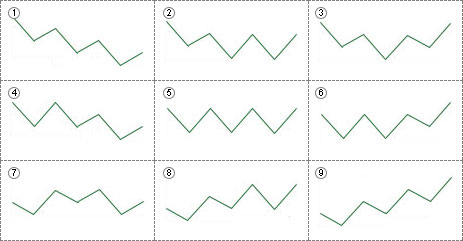
Fig. 13. Various possible movements based on three bottoms
By combining 9 types of the price movement with 9 types of the indicator movement, we may obtain 81 variations of the triple divergence.
Thus, you can determine the movement by any number of points. If we add the fourth point, we will have 81 variations of the price or indicator movement and 6561 (81*81) possible versions of their combination. Of course, the more possible options, the less likely they are. Perhaps, there is no sense in applying the fourth point, but the indicator in the current article is to have no limitations on the number of points used to define the movement type.
Universal indicator for defining divergence
Now that we have dealt with the theory, let's develop the indicator.
Selecting an oscillator. In order not to be limited by a single oscillator to define divergence, we will use the universal oscillator described in this article. It has the attachments: iUniOsc (universal oscillator) and iUniOscGUI (the same oscillator with the graphical interface). We will use the basic version — iUniOsc.
Creating a new indicator. Let's create the new iDivergence indicator in MetaEditor. We are going to use the OnCalculate function. The OnTimer() function is not needed. Tick the "Indicator in separate window" option. We create three buffers: an oscillator display line and two arrow buffers for drawing arrows when a divergence occurs. After a new file is opened in the editor, change the buffer names: 1 — buf_osc, 2 — buf_buy, 3 — buf_sell. Names should be changed where the arrays are declared, as well as in the OnInit() function. We can also adjust the buffer properties: indicator_label1, indicator_label2, indicator_label3 — the values of these properties are displayed in the tooltip when hovering the mouse over the line or the indicator label, as well as in the data window. Let's call them "osc", "buy" and "sell".
Applying the universal oscillators. Insert all external parameters of the iUniOsc indicator to the new indicator. The ColorLine1, ColorLine2 and ColorHisto parameters are not needed in the properties window. We will hide them. The Type parameter has the custom OscUni_RSI type described in the UniOsc/UniOscDefines.mqh file. We will include this file. By default, the Type parameter value is set to OscUni_ATR — ATR indicator. But ATR does not depend on the price movement direction which means it is not suitable for defining divergence. Therefore, set OscUni_RSI — RSI indicator — as default:
#include <UniOsc/UniOscDefines.mqh>

input EOscUniType          Type              =  OscUni_RSI;
input int                  Period1           =  14;
input int                  Period2           =  14;
input int                  Period3           =  14;
input ENUM_MA_METHOD       MaMethod          =  MODE_EMA;
input ENUM_APPLIED_PRICE   Price             =  PRICE_CLOSE;
input ENUM_APPLIED_VOLUME  Volume            =  VOLUME_TICK;
input ENUM_STO_PRICE       StPrice           =  STO_LOWHIGH;
      color                ColorLine1        =  clrLightSeaGreen;
      color                ColorLine2        =  clrRed;
      color                ColorHisto        =  clrGray;
Declare the handle of the universal oscillator below the external variables:
int h; Access the universal oscillator at the beginning of the OnInit() function:
h=iCustom(Symbol(),Period(),"iUniOsc", Type,
                                       Period1,
                                       Period2,
                                       Period3,
                                       MaMethod,
                                       Price,
                                       Volume,
                                       StPrice,
                                       ColorLine1,
                                       ColorLine2,
                                       ColorHisto);
if(h==INVALID_HANDLE){
   Alert("Can't load indicator");
   return(INIT_FAILED);
}
In the OnCalculate() function, copy the data of the universal oscillator to the buf_osc buffer:
int cnt;

if(prev_calculated==0){
   cnt=rates_total;
}
else{
   cnt=rates_total-prev_calculated+1;
}

if(CopyBuffer(h,0,0,cnt,buf_osc)<=0){
   return(0);
}
At this stage, we can verify the correctness of the performed actions by attaching the iDivergence indicator to the chart. If everything is done correctly, you can see the line of the oscillator in the subwindow.
Defining the oscillator extreme values. We have already considered three ways of defining extreme values. We will include them in the indicator and provide the possibility to select any of them (external variable with a drop-down list). In the Include folder, we create the UniDiver folder, in which all the additional files with the code are to be located. Create the UniDiver/UniDiverDefines.mqh include file and write the EExtrType enumeration in it:
enum EExtrType{
   ExtrBars,
   ExtrThreshold,
   ExtrMiddle
};
Enumeration options:
- ExtrBars — by bars;
- ExtrThreshold — by overcoming the threshold from the last High/Low;
- ExtrMiddle — maximum or minimum value if the indicator is above or below its middle.
In the indicator, create the ExtremumType external parameter and insert it above all other external parameters. When defining extreme values by bars, we will require two parameters — number of bars to the left and right of the extreme value, while when defining by threshold, we will need the parameter for calculating the threshold value:
input EExtrType            ExtremumType      =  ExtrBars; // Extremum type
input int                  LeftBars          =  2;        // Bars to the left for ExtrBars
input int                  RightBars         =  -1;       // Bars to the right for ExtrBars
input double               MinMaxThreshold   =  5;        // Threshold value for ExtrThreshold
Let's implement the possibility to use one parameter, RightBars or LeftBars, in addition to using two at once. RightBars is equal to -1 by default. This means that it is not used and the value of the second parameter is to be assigned to it.
Extreme values definition classes. There is no need in changing the extreme value definition method during the indicator work, therefore it would be more reasonable to use OOP instead of the 'if' and 'switch' operators. Create the base class and three derived ones for three methods of defining an extreme value. One of these derived classes is to be selected when launching the indicator. These classes are to be used both for defining extreme values and performing all necessary work for finding a divergence. They are different only in the ways of defining extreme values, while the definition of convergence is completely identical in all cases. Therefore, the divergence definition function is to be located in the base class and be called from derived classes. But first, we need to provide an easy access to all indicator extreme values (like it was done with the ZigZag tops in the "Wolfe waves" article).
The SExtremum structure is used to store data about one extreme value. The structure description is located in UniDiverDefines:
struct SExtremum{
   int SignalBar;
   int ExtremumBar;
   datetime ExtremumTime;
   double IndicatorValue;
   double PriceValue;
};
The structure fields:
- SignalBar — bar, on which it became known about the formation of an extreme value
- ExtremumBar — bar with an extreme value
- ExtremumTime — time of the bar with an extreme value
- IndicatorValue — indicator value at the extremum
- PriceValue — price value on the bar with the indicator extreme value
Two arrays of these structures are to be used to store data about all tops and bottoms. They will be members of the base class.
Classes for defining extreme values are located in the UniDiver/CUniDiverExtremums.mqh file, the base class name is CDiverBase. For now, let's consider the structure of the class with basic methods only. The rest are to be added later as necessary.
class CDiverBase{
   protected:

      SExtremum m_upper[];
      SExtremum m_lower[];

      void AddExtremum( SExtremum & a[],
                        int & cnt,
                        double iv,
                        double pv,
                        int mb,
                        int sb,
                        datetime et);

      void CheckDiver(  int i,
                        int ucnt,
                        int lcnt,
                        const datetime & time[],
                        const double &high[],
                        const double &low[],
                        double & buy[],
                        double & sell[],
                        double & osc[]
      );

   public:
      virtual void Calculate( const int rates_total,
                              const int prev_calculated,
                              const datetime &time[],
                              const double &high[],
                              const double &low[],
                              double & osc[],
                              double & buy[],
                              double & sell[]
      );
};
The Calculate() virtual method allows you to select the extreme value definition option. The AddExtremum() and CheckDiver() methods are located in the 'protected' section — they are called from the Calculate() method of derived classes. The AddExtremum() method collects data about tops and bottoms to the m_upper[] and m_lower[] arrays. The CheckDiver() method checks if the divergence condition is met and sets the indicator arrows. Below, we will look at all these methods in more detail, but for now let's get acquainted with the derived classes for other ways of defining extreme values.
Defining extreme values by bars. The class for defining extreme values by bars:
class CDiverBars:public CDiverBase{
   private:

      SPseudoBuffers1 Cur;
      SPseudoBuffers1 Pre;

      int m_left,m_right,m_start,m_period;

   public:

      void CDiverBars(int Left,int Right);

      void Calculate( const int rates_total,
                      const int prev_calculated,
                      const datetime &time[],
                      const double &high[],
                      const double &low[],
                      double & osc[],
                      double & buy[],
                      double & sell[]
      );
};
The parameters for defining extreme values (the LeftBars and RightBars external variables) are passed to the class constructor, their values are verified and changed if necessary and additional parameters are calculated:
void CDiverBars(int Left,int Right){
   m_left=Left;
   m_right=Right;
   if(m_left<1)m_left=m_right;   // Left parameter is not set
   if(m_right<1)m_right=m_left;  // Right parameter is not set
   if(m_left<1 && m_right<1){    // Both parameters are not set
      m_left=2;
      m_right=2;
   }
   m_start=m_left+m_right;       // shift the interval start point
   m_period=m_start+1;           // number of the interval bars
}
The parameter values are verified first. If some of them is not positive (not set), the value of the second parameter is assigned to it. If not a single parameter is set, the default values are assigned to them (2). The indent of the initial bar for searching for an extreme value (m_start) and the total number of extremum bars (m_period) are calculated after that.
The Calculate() method is identical to the standard OnCalculate() function but it receives only the necessary price arrays rather than all: time[], high[], low[] and the indicator buffers osc[] (oscillator data), buy[] and sell[] (arrows). As usual, the range of the calculated bars is defined in the OnCalculte() function. The indicator extreme values (the ArrayMaximum() and ArrayMinimum() functions) are defined in the standard indicator cycle afterwards. After detecting an extreme point, the AddExtremum() method is called to add data to the m_upper[] or m_lower[] array. In the end, the CheckDiver() method is called to analyze data from the arrays with extreme values. If the divergence is detected, the arrows are placed.
void Calculate( const int rates_total,
                const int prev_calculated,
                const datetime &time[],
                const double &high[],
                const double &low[],
                double & osc[],
                double & buy[],
                double & sell[]
){

   int start; // variable for the initial bar index

   if(prev_calculated==0){ // complete indicator calculation
      start=m_period; // define initial calculation bar
      m_LastTime=0;   // reset the variable for defining a new bar
      Cur.Reset();    // reset auxiliary structures
      Pre.Reset();    // reset auxiliary structures
   }
   else{ // when calculating only new bars
      start=prev_calculated-1; // calculate the index of the bar, from which calculations are resumed
   }

   for(int i=start;i<rates_total;i++){ // main indicator cycle

      if(time[i]>m_LastTime){ // new bar
         m_LastTime=time[i];
         Pre=Cur;
      }
      else{ // re-calculate the same bar
         Cur=Pre;
      }

      // calculate High/Low search parameters
      int sb=i-m_start; // index of the bar, from which the interval starts
      int mb=i-m_right; // index of the bar with High/Low

      if(ArrayMaximum(osc,sb,m_period)==mb){ // there is a top
         // add the top to the array
         this.AddExtremum(m_upper,Cur.UpperCnt,osc[mb],high[mb],mb,i,time[mb]);
      }
      if(ArrayMinimum(osc,sb,m_period)==mb){ // there is a bottom
         // add the bottom to the array
         this.AddExtremum(m_lower,Cur.LowerCnt,osc[mb],low[mb],mb,i,time[mb]);
      }

      // check for divergence
      this.CheckDiver(i,Cur.UpperCnt,Cur.LowerCnt,time,high,low,buy,sell,osc);
   }
}
Let's consider this code in details. At the very start of the indicator cycle:
if(time[i]>m_LastTime){ // new bar
   m_LastTime=time[i];
   Pre=Cur;
}
else{ // recalculation of the same bar
   Cur=Pre;
}
m_LastTime variable is declared in the base class. If the time[i] bar time exceeds the variable, the bar is calculated the first time. The bar time is assigned to the m_LastTime variable, while the Cur variable value is assigned to the Pre variable. Inversely, when recalculating the same bar, the Pre variable is assigned to the Cur one. Using the Cur and Pre variables is considered in details in this article. The Pre and Cur variables are of SPseudoBuffers1 type described in the UniDiverDefines file:
struct SPseudoBuffers1{
   int UpperCnt;
   int LowerCnt;
   void Reset(){
      UpperCnt=0;
      LowerCnt=0;
   }
};
The structure includes two fields:
- UpperCount — number of used m_upper[] array elements;
- LowerCount — number of used m_lower[] array elements;
The Reset() method was created for fast resetting of all the structure fields.
After working with the Cur and Pre variables, the bar indices for searching for extreme values are calculated:
// calculate the parameters for searching for High/Low
int sb=i-m_start; // index of the bar, from which the interval starts
int mb=i-m_right; // index of the bar with top/bottom
The index of the bar, from which the search for High/Low starts, is assigned to the 'sb' variable. The index of the bar, on which the High/Low is to be located, is assigned to the 'mb' variable.
Define the top or bottom using the ArrayMaximum() and ArrayMinimum() functions:
if(ArrayMaximum(osc,sb,m_period)==mb){ // there is a top
   // add a top to the array
   this.AddExtremum(m_upper,Cur.UpperCnt,osc[mb],high[mb],mb,i,time[mb]);
}
if(ArrayMinimum(osc,sb,m_period)==mb){ // there is a bottom
   // add a bottom to the array
   this.AddExtremum(m_lower,Cur.LowerCnt,osc[mb],low[mb],mb,i,time[mb]);
}
If the ArrayMaximum() or ArrayMinimum() function returns 'mb', this means the specified number of bars is located to the left and right of the top/bottom. In turn, this indicates that the desired top/bottom has formed. The AddExtremum() method is called and the data are added to the m_upper[] or m_lower[] array.
Let's consider the simple AddExtremum() method:
void AddExtremum( SExtremum & a[], // array the data are added to
                  int & cnt,       // number of occupied array elements
                  double iv,       // indicator value
                  double pv,       // price
                  int mb,          // index of the bar with an extreme value
                  int sb,          // index of the bar, on which it has become known about an extreme value
                  datetime et      // time of the bar with an extreme value
){
   if(cnt>=ArraySize(a)){ //the array is filled
      // increase the array size
      ArrayResize(a,ArraySize(a)+1024);
   }
   // add new data
   a[cnt].IndicatorValue=iv; // indicator value
   a[cnt].PriceValue=pv;     // price value
   a[cnt].ExtremumBar=mb;    // index of the bar with an extreme value
   a[cnt].SignalBar=sb;      // index of the bar, on which it has become known of the extreme value
   a[cnt].ExtremumTime=et;   // time of the bar with an extreme value
   cnt++;                    // increase the counter of the occupied elements
}
The a[] array, the new data are to be added to, is passed to the method via the parameters. This can be the m_upper[] or m_lower[] array. The number of the occupied elements of the a[] array is passed via the 'cnt' variable. This can be the Cur.UpperCnt or Cur.LowerCnt variable. The a[] array and 'cnt' variable are passed by references since they are changed in the method.
iv — indicator value based on the extremum, pv — price on the bar with an extreme value, mb — index of the bar with an extreme value, sb — signal bar (at which it has become known about the extreme value arrival), et — time of the bar with an extreme value.
The array size is checked at the beginning of the AddExtremum() method. If it is full, its size increases up to 1024 elements. The data are added and the 'cnt' variable is increased afterwards.
We will have a look at the CheckDiver() method later.
Defining the extremum by a threshold value.
The class for defining by a threshold value is different from the class for defining by bars primarily in Cur and Pre variable types: this is the SPseudoBuffers2 type described in the UniDiverDefines.mqh file:
struct SPseudoBuffers2{
   int UpperCnt;
   int LowerCnt;
   double MinMaxVal;
   int MinMaxBar;
   int Trend;
   void Reset(){
      UpperCnt=0;
      LowerCnt=0;
      MinMaxVal=0;
      MinMaxBar=0;
      Trend=1;
   }
};
The SPseudoBuffers2 structure has the same fields as SPseudoBuffers1 plus a few more:
- MinMaxVal — variable for the maximum or minimum indicator value
- MinMaxBar — variable for the index of the bar, on which the maximum or minimum indicator value is found
- Trend — variable for the indicator movement direction. The value of 1 means the indicator moves upwards and its maximum value is tracked. In case of -1, the minimum value is tracked.
The external parameter with the threshold value — MinMaxThreshold variable — is passed to the class constructor. Its value is saved to the m_threshold variable declared in the 'private' section.
The Calculate() method of this class is different in the extreme value definition method:
switch(Cur.Trend){ // indicator current direction
   case 1: // up
      if(osc[i]>Cur.MinMaxVal){ // new maximum
         Cur.MinMaxVal=osc[i];
         Cur.MinMaxBar=i;
      }
      if(osc[i]<Cur.MinMaxVal-m_threshold){ // threshold value exceeded
         // add a top to the array
         this.AddExtremum(m_upper,Cur.UpperCnt,Cur.MinMaxVal,high[Cur.MinMaxBar],Cur.MinMaxBar,i,time[Cur.MinMaxBar]);
         Cur.Trend=-1;          // change tracked direction
         Cur.MinMaxVal=osc[i];  // initial minimum value
         Cur.MinMaxBar=i;       // bar with the initial minimum value
      }
   break;
   case -1: // down
      if(osc[i]<Cur.MinMaxVal){ // new minimum
         Cur.MinMaxVal=osc[i];
         Cur.MinMaxBar=i;
      }
      if(osc[i]>Cur.MinMaxVal+m_threshold){ // threshold value exceeded
         // add the bottom to the array
         this.AddExtremum(m_lower,Cur.LowerCnt,Cur.MinMaxVal,low[Cur.MinMaxBar],Cur.MinMaxBar,i,time[Cur.MinMaxBar]);
         Cur.Trend=1;           // change the tracked direction
         Cur.MinMaxVal=osc[i];  // initial maximum value
         Cur.MinMaxBar=i;       // bar with the initial maximum value
      }
   break;
}
If the Cur.Trend variable is 1, the oscillator value is compared with the Cur.MinMaxValue value. If the new oscillator value exceeds the value from the variable, the variable value is updated. The index of the bar, at which the new High is detected, is assigned to the Cur.MinMaxBar variable. It is also ensured that the oscillator value has not decreased from the last known maximum by the m_threshold value. If it has, the oscillator has changed its direction. The AddExtremum() method is called, the data on the new extreme value are saved in the array, Cur.Trend value is replaced with the opposite one, while the initial parameters of the new minimum are set in the Cur.MinMaxVal and Cur.MinMaxBar variables. Since the value of the Cur.Trend variable has changed, another 'case' section — tracking the minimum oscillator values and exceeding the threshold upwards — is executed from now on.
Defining extreme values by their position relative to the oscillator's midpoint. The type of the applied oscillator is passed to the class constructor. Depending on that type, the oscillator middle value is defined:
void CDiverMiddle(EOscUniType type){
   if(type==OscUni_Momentum){
      m_level=100.0;
   }
   else if(type==OscUni_RSI || type==OscUni_Stochastic){
      m_level=50.0;
   }
   else if(type==OscUni_WPR){
      m_level=-50.0;
   }
   else{
      m_level=0.0;
   }
}
For Momentum, the value is 100, for RSI and Stochastic, this is 50, for WPR, this is -50, for other oscillators, this is 0.
The very method of determining the extreme value is similar in many respects to the threshold value method:
switch(Cur.Trend){
   case 1:
      if(osc[i]>Cur.MinMaxVal){
         Cur.MinMaxVal=osc[i];
         Cur.MinMaxBar=i;
      }
      if(osc[i]<m_level){
         this.AddExtremum(m_upper,Cur.UpperCnt,Cur.MinMaxVal,high[Cur.MinMaxBar],Cur.MinMaxBar,i,time[Cur.MinMaxBar]);
         Cur.Trend=-1;
         Cur.MinMaxVal=osc[i];
         Cur.MinMaxBar=i;
      }
   break;
   case -1:
      if(osc[i]<Cur.MinMaxVal){
         Cur.MinMaxVal=osc[i];
         Cur.MinMaxBar=i;
      }
      if(osc[i]>m_level){
         this.AddExtremum(m_lower,Cur.LowerCnt,Cur.MinMaxVal,low[Cur.MinMaxBar],Cur.MinMaxBar,i,time[Cur.MinMaxBar]);
         Cur.Trend=1;
         Cur.MinMaxVal=osc[i];
         Cur.MinMaxBar=i;
      }
   break;
}
The only difference is that the direction change is done through a comparison with the middle level of the oscillator: osc[i]<m_level or osc[i]>m_level.
Method of setting the divergence type. Add the variable for selecting the type of the identified divergence to the external parameters:
input int Number = 3;
By default, the value of the parameter is 3. According to Fig. 11, this means the classic divergence. In total, 9 combinations of the price and indicator movement are displayed in Fig. 11. Let's add yet another option — "not checked". Now, we have 10 combinations. Thus, using the usual decimal number, we can describe any combination of different movements in any number (including a triple divergence). It turns out that a single-digit number corresponds to a simple divergence (on two tops/bottoms), a two-digit number is a triple number, and so on. For example, the number of 13 will correspond to the combination displayed in Fig. 14.
Fig. 14. The combination of the indicator and
price movements when Number=13 for selling
Classes for checking divergence conditions. The base and derive classes are created for checking the divergence conditions. The Number parameter value will be analyzed at the indicator launch. The most important attribute is its length since it affects the size of the array of pointers to classes. Then, the appropriate object will be generated for each array element according to the condition type.
Condition verification classes are located in the UniDiver/CUniDiverConditions.mqh file. The base class is named CDiverConditionsBase. Let's have a look at it:
class CDiverConditionsBase{
   protected:
      double m_pt;
      double m_it;
   public:
   void SetParameters(double pt,double it){
      m_pt=pt;
      m_it=it;
   }
   virtual bool CheckBuy(double i1,double p1,double i2,double p2){
      return(false);
   }
   virtual bool CheckSell(double i1,double p1,double i2,double p2){
      return(false);
   }
};
The class has two virtual methods for comparing two neighboring tops. Their parameters are passed in it:
- i1 — indicator value in point 1
- p1 — price value in point 1
- i2 — indicator value in point 2
- p2 — price value in point 2
The points are counted from right to left starting with one.
The SetParameters() method is used for setting additional comparison parameters: pt — available difference of the price values, at which the price points are assumed to be located on a single level. it — similar parameter for comparing the indicator tops. The values of these parameters are set via the properties window:
input double               IndLevel          =  0;
input int                  PriceLevel        =  0;
The code of one of the derived classes is shown below:
class CDiverConditions1:public CDiverConditionsBase{
   private:
   public:
   bool CheckBuy(double i1,double p1,double i2,double p2){
      return((p1>p2+m_pt) && (i1>i2+m_it));
   }
   bool CheckSell(double i1,double p1,double i2,double p2){
      return((p1<p2-m_pt) && (i1<i2-m_it));
   }
};
In the method for CheckBuy(), it is checked whether the point 1 price exceeds the point 2 one. The same goes for the indicator: point 1 price should exceed the value in point 2. The CheckSell() method is mirror-symmetric to the CheckBuy() method. All other classes are similar and differ only in logical expressions, except for CDiverConditions0. The CheckSell() and CheckBuy() methods return 'true' at once in that class. It is used when the conditions check is disabled (any option is possible).
Preparing for checking the divergence conditions. The array and the variable for its size are declared in the 'protected' section of the CDiverBase class:
CDiverConditionsBase * m_conditions[];
int m_ccnt;
In the SetConditions() method, the m_conditions array size is changed and the divergence condition verification objects are created:
void SetConditions(int num,      // divergence number
                   double pt,    // PriceLevel parameter
                   double it){   // IndLevel parameter
   if(num<1)num=1; // divergence number should not be less than 1
   ArrayResize(m_conditions,10); // maximum possible number of conditions
   m_ccnt=0; // counter of the actual number of conditions
   while(num>0){
      int cn=num%10; // variation of a divergence between the new pair of extreme values
      m_conditions[m_ccnt]=CreateConditions(cn); // create an object
      m_conditions[m_ccnt].SetParameters(pt,it); // set the condition verification parameters
      num=num/10; // move to the next condition
      m_ccnt++; // count the number of conditions
   }
   // correct the array size according to the actual number of conditions
   ArrayResize(m_conditions,m_ccnt);
}
The following parameters are passed to the method:
- num — Number external parameter;
- pt — PriceLevel external parameter;
- it — IndLevel external parameter.
The 'num' parameter is checked first:
if(num<1)num=1; // divergence number should not be less than 1
Then, the m_conditions array increases up to the maximum possible size (10 — length of the maximum value of the 'int' variable). After that, the object of the condition verification via the CreateConditions() method is created and the parameters are set using the SetParameters() method in the 'while' loop depending on the value of each of the digits of 'num'. After the loop, the array size changes according to the real number of applied conditions.
Let's examine the CreateConditions() method:
CDiverConditionsBase * CreateConditions(int i){
   switch(i){
      case 0:
         return(new CDiverConditions0());
      break;
      case 1:
         return(new CDiverConditions1());
      break;
      case 2:
         return(new CDiverConditions2());
      break;
      case 3:
         return(new CDiverConditions3());
      break;
      case 4:
         return(new CDiverConditions4());
      break;
      case 5:
         return(new CDiverConditions5());
      break;
      case 6:
         return(new CDiverConditions6());
      break;
      case 7:
         return(new CDiverConditions7());
      break;
      case 8:
         return(new CDiverConditions8());
      break;
      case 9:
         return(new CDiverConditions9());
      break;
   }
   return(new CDiverConditions0());
}
The method is simple: depending on the i parameter, the appropriate object is created and the reference to it is returned.
Defining divergence. Now, we can consider the CheckDivergence() method of the CDiverBase class. First, we consider all the method code, then consider it one by one:
void CheckDiver(  int i,                    // calculated bar index
                  int ucnt,                 // number of tops in the m_upper array
                  int lcnt,                 // number of tops in the m_lower array
                  const datetime & time[],  // array with the bars time
                  const double &high[],     // array with the prices of high bars
                  const double &low[],      // array with the prices of low bars
                  double & buy[],           // indicator buffer with up arrows
                  double & sell[],          // indicator buffer with down arrows
                  double & osc[]            // indicator buffer with oscillator values
){

   // clear buffers with arrows
   buy[i]=EMPTY_VALUE;
   sell[i]=EMPTY_VALUE;

   // remove graphical objects
   this.DelObjects(time[i]);

   // for tops (sell signals)
   if(ucnt>m_ccnt){ // sufficient number of tops
      if(m_upper[ucnt-1].SignalBar==i){ // a top detected on the calculated bar

         bool check=true; // assume that the divergence has occurred

         for(int j=0;j<m_ccnt;j++){ // at all pairs of tops
            // verify meeting the conditions on the new pair of tops
            bool result=m_conditions[j].CheckSell( m_upper[ucnt-1-j].IndicatorValue,
                                                   m_upper[ucnt-1-j].PriceValue,
                                                   m_upper[ucnt-1-j-1].IndicatorValue,
                                                   m_upper[ucnt-1-j-1].PriceValue
                                                );
            if(!result){ // condition is not met
               check=false; // no divergence
               break;
            }

         }
         if(check){ // divergence has occurred
            // set the indicator buffer arrow
            sell[i]=osc[i];
            // draw additional lines and/or arrow of the price chart
            this.DrawSellObjects(time[i],high[i],ucnt);
         }
      }
   }

   // for bottoms (buy signals)
   if(lcnt>m_ccnt){
      if(m_lower[lcnt-1].SignalBar==i){
         bool check=true;
         for(int j=0;j<m_ccnt;j++){
            bool result=m_conditions[j].CheckBuy(  m_lower[lcnt-1-j].IndicatorValue,
                                                   m_lower[lcnt-1-j].PriceValue,
                                                   m_lower[lcnt-2-j].IndicatorValue,
                                                   m_lower[lcnt-2-j].PriceValue
                                                );
            if(!result){
               check=false;
               break;
            }
         }
         if(check){
            buy[i]=osc[i];
            this.DrawBuyObjects(time[i],low[i],lcnt);
         }
      }
   }
}
The following parameters are passed to the method:
- i — index of the current calculated bar;
- ucnt — number of applied m_upper[] array elements;
- lcnt — number of applied m_lower[] array elements;
- time[] — array with the bars time;
- high[] — array with high bars prices;
- low[] — array with low bars prices;
- buy[] — indicator buffer for buy arrows;
- sell[] — indicator buffer for sell arrows;
- osc[] — indicator buffer with oscillator values.
Buffers with arrows are cleared first:
// clear buffers with arrows
buy[i]=EMPTY_VALUE;
sell[i]=EMPTY_VALUE;
Graphical objects corresponding to the calculated bar are removed:
// remove graphical objects
this.DelObjects(time[i]);
Apart from arrows, iDivergence applies graphical objects to display arrows on the price chart and lines connecting extreme values on the price chart with tops/bottoms on the oscillator graph.
Then there are two identical sections of code to check the conditions for selling and buying. Let's consider the first section for selling. The number of available oscillator tops should be 1 more than the number of checked conditions. Therefore, the check is performed:
// for tops (sell signals)
if(ucnt>m_ccnt){ // there is a sufficient number of tops

}
After that, we check if the top on the calculated bar exists. This is determined by the correspondence between the index of the calculated bar and the index from the array with data on tops/bottoms:
if(m_upper[ucnt-1].SignalBar==i){ // top detected on the calculated bar

}
An auxiliary variable is required for the results of checking the conditions:
bool check=true; // assume that the divergence occured
In the 'for' loop, go through all conditions passing data on tops to them:
for(int j=0;j<m_ccnt;j++){ // through all top pairs
   // check meeting the conditions on the next pair of tops
   bool result=m_conditions[j].CheckSell( m_upper[ucnt-1-j].IndicatorValue,
                                          m_upper[ucnt-1-j].PriceValue,
                                          m_upper[ucnt-1-j-1].IndicatorValue,
                                          m_upper[ucnt-1-j-1].PriceValue
                                        );
   if(!result){ // condition is not met
      check=false; // no divergence
      break;
   }
}
If any of the conditions is not fulfilled, exit the loop. 'false' is assigned to the 'check' variable. If all conditions are met, 'check' saves 'true', an arrow is set and a graphical object is created:
if(check){ // divergence occurred
   // place the indicator buffer arrow
   sell[i]=osc[i];
   // draw auxiliary lines and/or an arrow on the price chart
   this.DrawSellObjects(time[i],high[i],ucnt);
}
Display of graphical objects can be enabled/disabled in the indicator properties window. The following variables are declared for that:
input bool                 ArrowsOnChart     =  true;
input bool                 DrawLines         =  true;
input color                ColBuy            =  clrAqua;
input color                ColSell           =  clrDeepPink;
- ArrowsOnChart — enable arrows from graphical objects on the price chart
- DrawLines — enable drawing the lines connecting the price and indicator Highs and Lows
- ColBuy and ColSell — colors of graphical objects for buy and sell signals.
In the 'protected' section of the CDiverBase class, the appropriate variables are declared:
bool m_arrows;  // corresponds to the ArrowsOnChart variable
bool m_lines;   // corresponds to the DrawLines variable
color m_cbuy;   // corresponds to the ColBuy variable
color m_csell;  // corresponds to the ColSell variable
The values of these variables are set in the SetDrawParmeters() method:
void SetDrawParmeters(bool arrows,bool lines,color cbuy,color csell){
   m_arrows=arrows;
   m_lines=lines;
   m_cbuy=cbuy;
   m_csell=csell;
}
Consider the methods that work with graphical objects. Removal:
void DelObjects(datetime bartime){ // lines drawing enabled
   if(m_lines){
      // form the common prefix
      string pref=MQLInfoString(MQL_PROGRAM_NAME)+"_"+IntegerToString((long)bartime)+"_";
      for(int j=0;j<m_ccnt;j++){ // by the number of divergence conditions
         ObjectDelete(0,pref+"bp_"+IntegerToString(j)); // line on the price chart in case of a buy signal
         ObjectDelete(0,pref+"bi_"+IntegerToString(j)); // line on the indicator graph in case of a buy signal
         ObjectDelete(0,pref+"sp_"+IntegerToString(j)); // line on the price chart in case of a sell signal
         ObjectDelete(0,pref+"si_"+IntegerToString(j)); // line on the indicator graph in case of a sell signal
      }
   }
   if(m_arrows){ // enabled arrows on the price chart
      //
      ObjectDelete(0,MQLInfoString(MQL_PROGRAM_NAME)+"_"+IntegerToString((long)bartime)+"_ba");
      //
      ObjectDelete(0,MQLInfoString(MQL_PROGRAM_NAME)+"_"+IntegerToString((long)bartime)+"_sa");
   }
}
Lines connecting tops/bottoms and arrows are removed separately. Names of all graphical objects start with the indicator name followed by the time of the bar, on which the divergence was detected. The names are further formed in the loop corresponding to the number of m_ccnt conditions. "bp" is displayed for buy signals on the price chart, "bi" is displayed for buy signals on the indicator graph. Similarly, "sp" and "ip" are added for sell signals. The j index is added to the end of names. "_ba" (buy signal arrow) or "_sa" (sell signal arrow) are added to the arrow names.
Creation of graphical objects is performed in the DrawSellObjects() and DrawBuyObjects() methods. Let's consider one of them:
void DrawSellObjects(datetime bartime,double arprice,int ucnt){
   if(m_lines){ // enable display of lines

      // form the common prefix
      string pref=MQLInfoString(MQL_PROGRAM_NAME)+"_"+IntegerToString((long)bartime)+"_";

      for(int j=0;j<m_ccnt;j++){  // by all divergence conditions

         // line on the price chart
         fObjTrend(  pref+"sp_"+IntegerToString(j),
                     m_upper[ucnt-1-j].ExtremumTime,
                     m_upper[ucnt-1-j].PriceValue,
                     m_upper[ucnt-2-j].ExtremumTime,
                     m_upper[ucnt-2-j].PriceValue,
                     m_csell);

         // line on the indicator graph
         fObjTrend(  pref+"si_"+IntegerToString(j),
                     m_upper[ucnt-1-j].ExtremumTime,
                     m_upper[ucnt-1-j].IndicatorValue,
                     m_upper[ucnt-2-j].ExtremumTime,
                     m_upper[ucnt-2-j].IndicatorValue,
                     m_csell,
                     ChartWindowFind(0,MQLInfoString(MQL_PROGRAM_NAME)));
      }
   }

   if(m_arrows){ // arrows on the price chart enabled
      fObjArrow(MQLInfoString(MQL_PROGRAM_NAME)+"_"+IntegerToString((long)bartime)+"_sa",
               bartime,
               arprice,
               234,
               m_csell,
               ANCHOR_LOWER);
   }
}
Object names are formed the same way as during removal. After that, the graphical objects are created using the fObjTrend() and fObjArrow() functions. They are located in the UniDiver/UniDiverGObjects.mqh include file. The functions are fairly simple, there is no sense in analyzing them.
Indicator completion. We only have to apply the created classes in the indicator. Create the appropriate object in the OnInit() function depending on the selected type of defining extreme values:
switch(ExtremumType){
   case ExtrBars:
      diver=new CDiverBars(LeftBars,RightBars);
   break;
   case ExtrThreshold:
      diver=new CDiverThreshold(MinMaxThreshold);
   break;
   case ExtrMiddle:
      diver=new CDiverMiddle(Type);
   break;
}
One of the external parameters - PriceLevel - is measured in points, so it is convenient to correct it depending on the number of quotes' decimal places. To do this, declare another variable to be able to turn off this correction:
input bool Auto5Digits = true;
Next, declare an auxiliary variable for the corrected parameter and adjust it in the OnInit() function:
int pl=PriceLevel;
if(Auto5Digits && (Digits()==5 || Digits()==3)){
   pl*=10;
}
Set divergence and display parameters:
diver.SetConditions(Number,Point()*pl,IndLevel);
diver.SetDrawParmeters(ArrowsOnChart,DrawLines,ColBuy,ColSell);
Several strings in the OnCalculate() function remain. Call the basic Calculate() method:
diver.Calculate(  rates_total,
                  prev_calculated,
                  time,
                  high,
                  low,
                  buf_osc,
                  buf_buy,
                  buf_sell);
In case of applying graphical objects, we should speed up the plotting:
if(ArrowsOnChart || DrawLines){
   ChartRedraw();
}
When the indicator completes its work, the graphical objects should be removed. This is done in the CDiverBase class destructor. The divergence conditions verification objects are removed there as well:
void ~CDiverBase(){
   for(int i=0;i<ArraySize(m_conditions);i++){ // by all conditions
      if(CheckPointer(m_conditions[i])==POINTER_DYNAMIC){
         delete(m_conditions[i]); // remove the object
      }
   }
   // remove graphical objects
   ObjectsDeleteAll(0,MQLInfoString(MQL_PROGRAM_NAME));
   ChartRedraw();
}
At this point, the main stage of the indicator development is over. Fig. 15 displays the chart with the indicator attached to it (in the subwindow) with the enabled display of arrows on the price chart and lines plotted between the tops.
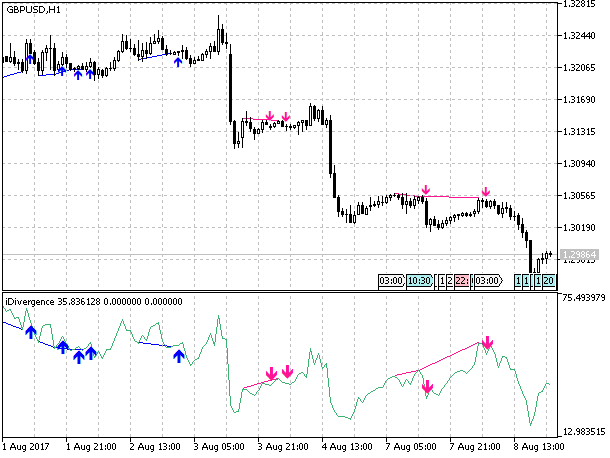
Fig. 15. The divergence indicator on the price chart with the arrows displayed on the price chart and the line connecting the extreme points
Now, we only need to add the alerts function. It is very simple and has already been described in other articles. In the attachments below, you can find a ready-made indicator with the alert function together with all the files necessary for the indicator.
Conclusion
Despite the indicator's versatility, we can also note its drawbacks. The main drawback is the IndLevel parameter dependence on the types of the applied oscillator, as well as the PriceLevel parameter dependence on a timeframe. To exclude this dependency, the default values for these parameters are 0. But at the same time, it is almost impossible to fulfill the conditions for certain combinations of the price and indicator movement. If the check for a horizontal movement is included into the divergence verification, its implementation is unlikely. In this case, the divergence options 1, 3, 7 and 9 remain. This may be an issue only when applying the tester to optimize an EA using the indicator.
In case of the correct approach to optimization, this will not be an issue since optimization is usually performed on a single symbol and timeframe. First, we need to determine the applied symbol and timeframe, and set the appropriate value for the PriceLevel parameter. Then we need to select the applied oscillator and set the appropriate value for the IndLevel parameter. There is no point in striving for auto optimization of the applied oscillator type and the PriceLevel and IndLevel parameters values, since there are many other optimization parameters besides them. First of all, this is the type of divergence (the Number variable) and the oscillator period.
Attachments
For iDivergence operation, you need a universal oscillator from the article "Universal oscillator with a graphical interface". The oscillator and all necessary files can be found in the application.
All attached files:
- Include/InDiver/CUniDiverConditions.mqh — file with the classes for checking divergence conditions;
- Include/InDiver/CUniDiverExtremums.mqh — file with the classes for defining extreme values;
- Include/InDiver/UniDiverDefines.mqh — description of structures and enumerations;
- Include/InDiver/UniDiverGObjects.mqh — functions for working with graphical objects;
- Indicators/iDivergence.mq5 — indicator;
- Indicators/iUniOsc.mq5 — universal oscillator;
- Include/UniOsc/CUniOsc.mqh — file with the universal oscillator classes;
- Include/UniOsc/UniOscDefines.mqh — description of structures and enumerations for the universal oscillator.
Translated from Russian by MetaQuotes Ltd.
Original article: https://www.mql5.com/ru/articles/3460
Warning: All rights to these materials are reserved by MetaQuotes Ltd. Copying or reprinting of these materials in whole or in part is prohibited.
This article was written by a user of the site and reflects their personal views. MetaQuotes Ltd is not responsible for the accuracy of the information presented, nor for any consequences resulting from the use of the solutions, strategies or recommendations described.

 Cross-Platform Expert Advisor: The CExpertAdvisor and CExpertAdvisors Classes
 Universal Expert Advisor: CUnIndicator and Use of Pending Orders (Part 9)
- Free trading apps
- Over 8,000 signals for copying
- Economic news for exploring financial markets
You agree to website policy and terms of use
You need to change in the parameter list to OscUni_OSMA and enter the input parameter you want like 13, 26,9 then it will work (default were 14,14,14)
Thanks it is marvelous.
One question As you had found out 15 options of divergence or convergences, at least. As you put 3 for default setting in the indicator, does it mean it only shows divergent number 3 or 3 divergent. However, there are at least 15. So, in order to catch all, do we have to change the number to 15 or do we have to try each by each number to catch the divergence or convergence variation on the chart
Thanks, regards
... on the default settings, it misses obvious divergences (!).
How to cure it ???