
An example of an indicator drawing Support and Resistance lines

Introduction
With this article, the most ancient price level forecasting method of technical analysis will become available to all who want to use it. In addition to having a ready-to-use indicator that draws trend lines (support and resistance lines), you will see how simple the indicator creation process is. You will learn how to formulate conditions for drawing any desired line by changing the indicator code.
ATTENTION: this description, as well as everything written in this article, is not a trade recommendation, and is only given for information purposes. The author is not liable for your actions, including any losses or loss of profits as a result of using the described method.
What are support and resistance lines?
First of all, we need to define the object of research. Below are definitions of support and resistance lines, which in my opinion most fully reflect their meaning.
The resistance line is the price movement line over a certain period of time, above which the price does not rise.
The support line is the price movement line over a certain period of time, below which the price does not fall.
The support line can be horizontal or inclined in any direction. The role of the line may change depending on what we observe on the chart. Let's talk about the support line. All this will be true for the resistance line, the only difference being that they are mirror-like.
- When the line is horizontal, the price is in a price channel. The role of the line is opening Buy orders and taking profit on Sell orders.
- When the line is rising, the price is in an uptrend. The role of the line is opening Buy orders.
- When the line is falling, the price is in a downtrend. The role of the line is taking profit on Sell orders.
As can be seen from the definition, any of these lines is a kind of an obstacle that does not allow the price to move in a certain direction. This in turn suggests that the price will rebound from the line and will move in the desired direction: upward for the support line and downward for resistance. If the line is broken and the price moves beyond its limits, we can conclude that the trend in this direction is over. This does not mean that the price direction will change, but you can say with certainty that trend continuation is having problems. The resistance line can be logically linked to a downward movement, and the support line can be linked to an upward movement. In this case, lines give a hint to the trader about where the market is moving, either upwards or downwards.
We can also draw horizontal lines. Such lines mean that the price is in a certain channel. For example, the price cannot fall below 1.1545 or rise above 1.1834 in a certain time interval. It is also possible to draw a resistance line in an uptrend or a support line in a downtrend. In this case the lines will be used for taking profit of your trades in the price direction. We will consider the construction of inclined support and resistance lines, as well as will draw horizontal support and resistance levels.
Conditions for selecting a starting point for an inclined line
What parameters should be taken for the correct automated construction of lines on a chart?
Since the resistance line prevents the price from rising, it is logical to build it based on peaks, and the support line that prevents the price from falling, will be drawn using troughs. Let us use Bill Williams' Fractals indicator from the MetaTrader 5 terminal in order to see possible construction points. We will see on the chart the fractal that will be used for our starting point. The desired starting point for the resistance line is the upper fractal on the chart, above which there are no fractals, and above which the price didn't rise. For the support line, we will use the lowest fractal, below which there are no other fractals. We watch here not the entire chart, but its visible part that we are going to analyze. Here we extract the following logical condition for drawing: the upper fractal must be higher than two neighboring fractals, and the lower fractal must be lower than its neighbors. So, we have a starting point.
Conditions for selecting the second point for an inclined line
We need at least two points for drawing a line, so we need to formalize rules for choosing the second point for our lines.
What criteria should be applied for the second point? First, we can take the second fractal, which follows the first point: this will show the nearest line. But we can also use other rules, such as the highest point of the chart, if the price has not crossed the line at this point upwards for the resistance line, and the opposite for the support line. You can define your own rules for selecting the second point. We will use the second nearest fractal.

Conditions for resetting a line and searching for new points for an inclined line
We have points for constructing lines. Now we need to define where our lines should end. The natural condition for the resistance line is the upward breakout, and the downward breakout for the support line. But the price sometimes breaks the line for a few points and then rolls moves, therefore we will set an allowable deviation that will not be considered a breakout. This will prevent false cancellation of lines.
Also we should take into account that the price sometimes moves far from the level and does not return to it for a long time. Let us set the maximum allowable line length in bars. So we will be able to start drawing a new line if the previous one suddenly "freezes in the air". The price movement cannot have two resistance lines and two support lines at a time, so a line is only valid until it is broken, and conditions for a new line should be searched after the previous line completion.
Once the current line is broken, we wait for conditions for a new line. We allocate a separate buffer for each line to form each line separately. This will allow us to see the fight between bulls and bears. As a result, we can choose the highest (for resistance) or the lowest (for support) fractal for the first point. The second point will be the next high or low fractal. Conditions for drawing the lines are ready. Now we need to implement them in an indicator code. Let us start writing the indicator.
An example of implementing the construction of lines using an indicator of inclined lines
First of all we create a template using default settings. Then we create two buffers, for support and resistance. Enter parameters Pips_ (the size of the line breakout) and MaxBars (maximum allowable line length). These are all automatic procedures for creating the indicator. Further comes a careful creative work.
At the indicator launch, we need to check our position. If it is the first launch of the indicator, we determine the beginning as the second bar to avoid calculation on the first two bars on which a fractal cannot be formed. According to Bill Williams, a fractal is a peak (trough), which is higher (lower) than two neighboring peaks (troughs) on the left and two of them on the right.
It is not the first launch, we calculate the indicator starting with the last calculated bar.
   int limit=prev_calculated;
   if(limit>3)limit-=3;
   if(limit<2)limit=2;
We will not copy the buffer from Bill Williams' Fractals, but will write a couple of functions for checking whether a bar is a fractal. Do not forget to protect against buffer access errors by adding handling of unexpected values.
bool up(const double &h[],int q)
  {
// check if a bar is followed by at least two bars,
// if there are less than two bars, the bar cannot be a fractal
// in this case we return false without further checks
   if(q>=ArraySize(h)-2)return(false);
// check if a bar is preceded by at least two bars,
// if there are less than two bars, the bar cannot be a fractal
// in this case we return false without further checks
   if(q<2)return(false);
// check if the bar is a fractal. If it is, we return true
   if(h[q]>=h[q-1])
      if(h[q]>=h[q-2])
         if(h[q]>h[q+1])
            if(h[q]>h[q+2])
               return(true);
// if we've passed all checks and are still in the block, the bar is not a fractal, return false
   return(false);
  }
//+------------------------------------------------------------------+
bool down(const double &h[],int q)
  {
// the block is similar to the previous one
   if(q>=ArraySize(h)-2)return(false);
   if(q<2)return(false);
   if(h[q]<=h[q-1])
      if(h[q]<=h[q-2])
         if(h[q]<h[q+1])
            if(h[q]<h[q+2])
               return(true);
   return(false);
  }
Then we need to find 1 bar in the HIGH array and check if it corresponds to our parameters. If it does, we remember it and look for the second point to draw the line. Otherwise we move to the next bar.
for(int w=limit;w<rates_total;w++)
  {
   if(up(high,w))                  //check if there is a fractal on this bar
     {
      if(r1==0)r1=w;               //if it is a fractal and we do not have peak 1, set peak 1 here
     }
  }
Once we have found the first fractal we search for the second one. Remember, it should be lower than the first bar. If it is higher than that, we should assign a new value to fractal 1.
if(high[w]>=high[r1])r1=w;                   //compare to the first peak. If the fractal is higher, set this peak as the first one
else
   {
    r2=w;                                    //get the value of the second peak
    speedr=(high[r2]-high[r1])/(r2-r1);      //calculating the line speed
    w=r1-1;                                  //return to draw a new line
   }
After finding the second fractal that meets the above conditions, we calculate the line speed and proceed to drawing it from the first fractal (by getting back to the first fractal). To avoid errors that inevitably appear when drawing from the previous point, we will calculate the line from the beginning of its drawing. As a result, the line drawing error at each point will not exceed the indicator error. We immediately check whether the line is broken according to our conditions. If it is broken, wait for a new construction. It should be noted that the breakout check is only performed after the second fractal. We are not interested in the price behavior between fractals. Calculations are similar for the support line.
ResistanceBuffer[w]=high[r1]+speedr*(w-r1);               //for the error to be minimal, we calculate from the very peak
if(w>r2)                                                  //check if there is a breakout
if(high[w]>ResistanceBuffer[w]+Pips_*_Point){r1=0;r2=0;}
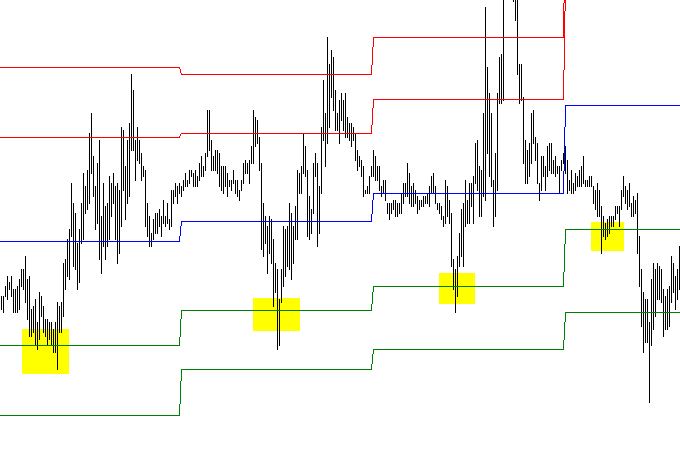
This is how the indicator looks like with different settings.


The following figure shows several indicators on one chart.


Choosing points for drawing horizontal support and resistance levels
Only one point is needed for drawing horizontal levels. So this task is easier. There are a lot of options for choosing a point. Here are just a few of them:
- Fibonacci levels based on the previous day (bar) calculation;
- Fibonacci levels based on the average daily ATR, on the average price range of the previous day;
- the maximum number of fractals in a range;
- accumulation of highs or lows, open or close prices in a certain range;
- accumulation of volumes at a certain price (market profile);
- price reversals based on selected patterns;
- etc.
You can add any desired conditions here, but the essence is the same: we search for a condition, according to which the price moves back from a certain level. The more often this condition is met, the more effective the horizontal support or resistance line is. As an example, we will consider the first version of the construction. Let us analyze the price movement during a day.

As is seen, the price moved up and down. A daily extremum is always the level, which the price reached and then moved back in the other direction. In a very rare case, the price can end its daily movement on a high or a low. Therefore, we can treat any daily High as a resistance level, and Low as a support level.
In our case, the level is formed at the end of the trading day, that is why we apply it on the next day as a reference level. But the market does not stand still, and the price direction and range constantly change. We will implement the ability to see multiple calculated levels relative to the previous day prices. When talking about the previous day, we mean the previous bar on a chart with the timeframe higher than the one used for trading. Therefore, the timeframe selection option must be implemented in the indicator. Also, let's add a coefficient to shift the line relative to the previous day prices. We apply a separate coefficient for each level. Let's start writing our indicator.
An example of implementing an indicator of horizontal support and resistance levels
We first create an indicator using standard means. Let's use the name of the previous indicator and add H at the end, which means "Horizontal". Let's set the timeframe which data we will use, 3 coefficients for each pair of lines, and 7 buffers for drawing the levels.
Data from the higher timeframe will be taken to three separate buffers: time, highs and lows. In addition to the function that copies data to our arrays, we should also increase their size if necessary.
void array_copy(int b_)
  {
   ArrayResize(time_tf,b_);                         //changing the buffer size for our data
   ArrayResize(high_tf,b_);
   ArrayResize(low_tf,b_);

   int total=b_-bars_tf;                            //calculate the required data copying

   CopyTime(_Symbol,Period_TF,0,total,time_tf)      //copy missing data to the array
   CopyHigh(_Symbol,Period_TF,0,total,high_tf);
   CopyLow(_Symbol,Period_TF,0,total,low_tf);

   bars_tf=b_;                                      //remember the array size and the amount of data
  }
We have received data. Now we need to handle them and add to arrays. All calculations will be identical, so they all will be performed in one function, to which data will be passed.
void f1(double k_fibo,int q,int r,const datetime &time_[],double &b1[],double &b2[])
  {
   for(int w=q;w<r;w++)
     {
      int b=f2(time_[w]);         //find the time of the current bar in the array of the higher timeframe
      double h=high_tf[b];        //get the high
      double l=low_tf[b];         //get the low
      double hl=h-l;              //get the movement range
      b1[w]=h-hl*k_fibo;          //add the calculated value to the support buffer
      b2[w]=l+hl*k_fibo;          //add the calculated value to the resistance buffer
     }
  }
Since the time ranges are not equal, we need to find the time of the current array bar in the time array of a higher timeframe. This is done in the following code.
int f2(datetime t_)
  {
   int b_=ArrayBsearch(time_tf,t_);      //find a bar using a standard search in sorted arrays
   if(time_tf[b_]>t_)b_--;               //if the time of the nearest bar of a higher timeframe is returned, we will reduce it by 1
   return(MathMax(0,b_-1));              //do not forget to return a bars taking into account the minimum limit
  }
That's all, this is the indicator that draws necessary support and resistance levels relative to the prices of the previous day.
   int limit=prev_calculated;
   if(limit>0)limit--;

   int bar=Bars(_Symbol,Period_TF);
   if(bars_tf==0 || bar>bars_tf)array_copy(bar);

   f1(0.5,limit,rates_total,time,buffer7,buffer7);           //draw the median
   f1(K_Fibo_1,limit,rates_total,time,buffer1,buffer2);      //draw levels with coefficient 1
   f1(K_Fibo_2,limit,rates_total,time,buffer3,buffer4);      //draw levels with coefficient 2
   f1(K_Fibo_3,limit,rates_total,time,buffer5,buffer6);      //draw levels with coefficient 3
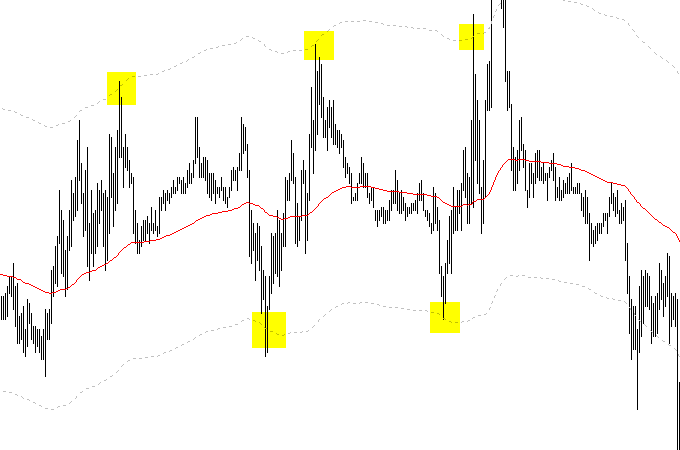
We have created an indicator that draws horizontal support and resistance levels. That's how it looks like on a chart.
You can see on the screenshot that the price bounces off the levels built by the indicator. One of them was a valid support for quite a long time. Selection of better levels is subject to optimization of parameters of a particular trading system.
Support and resistance levels based on moving averages
What else can we discuss in addition to horizontal support and resistance lines?
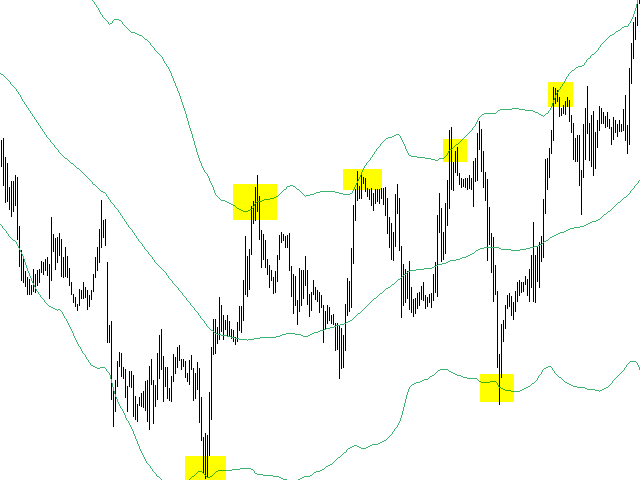
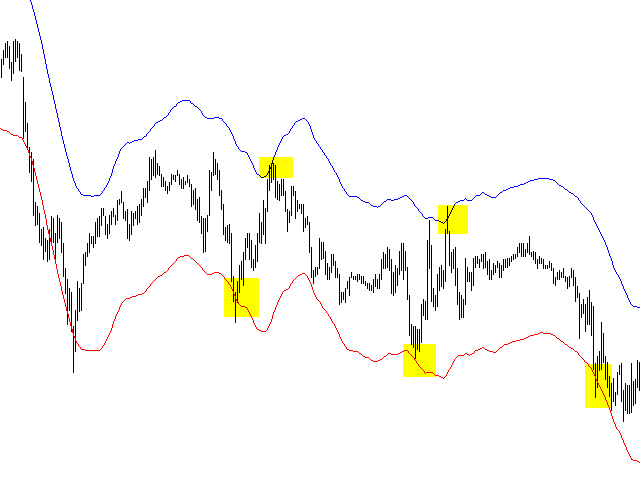
Pay attention to indicators based on moving averages. Among them is of course the Moving Average, as well as Bollinger Bands and Envelopes from the standard terminal package. They are very good indicators for showing support and resistance levels on the chart. Open the indicator properties -> the "Levels" tab, and add there two levels with a minus sign and two levels with a plus sign. We obtain an image like this:
The same results were obtained for other indicators. The price "sees" the levels and bounce off them like with usual support and resistance levels.
Conclusion
In conclusion, I would like to note an important feature of support and resistance levels. After the price breaks a level, the support line often turns into resistance, and vice versa. The use of support and resistance lines in trading requires using additional entry signals, because you cannot say for sure what will happen to the price once it reaches the level. But you should be very attentive when it approaches a level. The development of a strategy based on support and resistance levels is beyond the scope of this article.
Thank you for attention.
Translated from Russian by MetaQuotes Ltd.
Original article: https://www.mql5.com/ru/articles/3186
Warning: All rights to these materials are reserved by MetaQuotes Ltd. Copying or reprinting of these materials in whole or in part is prohibited.
This article was written by a user of the site and reflects their personal views. MetaQuotes Ltd is not responsible for the accuracy of the information presented, nor for any consequences resulting from the use of the solutions, strategies or recommendations described.

 DiNapoli trading system
- Free trading apps
- Over 8,000 signals for copying
- Economic news for exploring financial markets
You agree to website policy and terms of use
good afternoon. this article shows the possibility of determining the levels of support and resistance software running conditions for building the levels, which gives more opportunities to trade in the markets. the original article is located in Russian branch of forum. as for example code I posted source code that can be used as a template to build their levels running build conditions the sample code posted by me. I find it hard to understand english, as I don't speak it, and use automatic translation.
with respect.
Super! Cool article and most importantly useful. I like the indicator with the construction of sloping levels. Thank you.
good afternoon. this article shows the possibility of determining the levels of support and resistance software running conditions for building the levels, which gives more opportunities to trade in the markets. the original article is located in Russian branch of forum. as for example code I posted source code that can be used as a template to build their levels running build conditions the sample code posted by me. I find it hard to understand english, as I don't speak it, and use automatic translation.
with respect.
Thank you for your article & source code
I am still trying to understand the MQL5
do you have any example on drawing a horizontal line for specific time i.e. I want to draw a resistance or support line on the europe session time only (as I want to trade the EURGBP for example)
Thank you