
The Flag Pattern

Table of Contents
- Introduction
- The differences between the Pennant and the Triangle
- Horizontal Pattern
- Contracting Triangle
- Expanding Triangle
- A universal indicator to search for the Horizontal Pattern and Triangles
- A universal indicator to search for the Flag, the Pennant and the Wedge
- Tester Indicator
- Conclusion
- Attachments
Introduction
The basic feature of the Flag pattern, with which its name is connected, is a noticeable vertical price movement (the "Flagpole") followed by a sweeping horizontal movement which forms the horizontal Flag (Fig. 1).

Fig. 1. Flag
In technical analysis related books and websites, the Flag pattern is often considered in parallel with the Pennant pattern. Unlike a flag, the pennant has a triangular form (Fig. 2), that is why the Flag pattern is analyzed together with the Triangle pattern in some technical analysis related resources.
Fig. 2. Pennant
It may seem that Pennant and Triangle are just different names for the same pattern. In some technical analysis books, such as Encyclopedia of Chart Patterns by Tomas Bulkowski, these two patterns are mentioned separately. Also the book provides a description of the Wedge pattern, which is a similar triangle plotted horizontally. Its narrow part is on the left, while the price on the right moves with a broadening span (Fig. 3).
Fig. 3. Wedge
In addition to the Wedge pattern, there is the Expanding Triangle, as well as various Rectangular patterns similar to the Flag. Hence, there should be clear rules for differentiating between the Pennant and the Triangle, between the Wedge and the Expanding Triangle and between the Flag and the Horizontal Pattern. This question will be considered in the article in the first place. Then, we will create indicators to search for all these patterns.
The differences between the Pennant and the Triangle
Let us consider the differences between the Pennant and the Triangle, as well as between all of the above patterns that have a similar shape:
- The Rectangular Pattern and the Flag;
- The Triangle and the Pennant;
- The Expanding Triangle and the Wedge.
The Rectangular Pattern, the Triangle and the Expanding Triangle fall into one category, while the Flag, the Pennant and the Wedge are in the other one.
Patterns from the first category are formed of price reversal points (Fig. 4), so the ZigZag indicator can be used to search for them.
Fig. 4. Patterns: a — Horizontal pattern, b — Triangle, c — Expanding Triangle.
Patterns are shown for an expected upward movement (for buying).
Patterns of the second category are formed of bars that fill their areas (Fig. 5). Of course, the explicit form shown in the figure can hardly be seen on a chart, but the point is that one bar is greatly overlapped by the neighboring one, which forms a pattern.
Fig. 5. Patterns: a — Flag, b — Pennant, c — Wedge.
Patterns are shown for an expected upward movement (for buying).
Now that we have determined categories and their fundamental differences, let us consider each pattern separately.
Horizontal Pattern
Let's start by considering the patterns of the first category. A convenient way to determine such patterns is using the Zigzag indicator. The first pattern from this category is the Horizontal Pattern, which corresponds to the Flag from the second category. However, in most technical analysis related resources, it is the Horizontal Pattern that is called the Flag.
To form a horizontal pattern, the price should make a noticeable vertical movement, and then form at least two tops at approximately the same price level and two bottoms, also at the same price level. The price may form three tops and three bottoms (Fig. 6), or even more. Therefore, one of the indicator parameters will determine the number of tops and bottoms that form the pattern.
Fig. 6. Horizontal Patterns: a — formed of two tops/bottoms, b — formed of three tops/bottoms.
Patterns are shown for an expected upward movement (for buying)
It is not a required condition that the top and bottom edges of the pattern should be horizontal. They must be parallel, so the indicator will have one more parameter to select the pattern slope: horizontal, with an upward slope, with a downward slope (Fig. 7).
Fig. 7. a — Horizontal Pattern, b — Pattern with a downward slope, c — Pattern with an upward slope.
Patterns are shown for an expected upward movement (for buying)
Of course, patterns with an upward or downward slope cannot be called horizontal, but they are very close to a horizontal pattern in principle.
The pattern formation completes, when the price breaks the level formed by tops (Fig. 8).
Fig. 8. End of pattern formation and opening of a
buy position: a — for a horizontal pattern,
b — for a pattern with a downward slope
The entry moment for a pattern with an upward slope will be determined without taking into account the inclination of tops, while the horizontal level of the last top will be used instead (Fig. 9).
Fig. 9. Determining an entry (buying) for an upward sloping pattern
The simple variant with a horizontal level can also be used for a downward sloping pattern, so the indicator will have a variable for selecting the type of the level regardless of the pattern type.
The target for the Horizontal Pattern is determined by the size of the vertical movement before the pattern is formed. The distance that the price should make after the price formation must be equal to the distance it made before its formation (Fig. 10).
Fig. 10. Determining the target. The L1 distance that the price made before entering
the pattern is equal to the L2 distance after exiting the pattern.
Since the upper and lower pattern borders are parallel, we can use a simpler variant for determining the target: we can measure the distance made by the price to the first top of the pattern and put the same distance upward from the last bottom (Fig. 11).
Fig. 11. A simple way to determine the target. The L1 distance that the price made before forming
the first top is equal to the L2 distance from the last bottom to target
Contracting Triangle
The Contracting Triangle pattern is slightly different from the Horizontal Pattern. The only difference is that the Zigzag segments that form the pattern must be consecutively contracting (Fig. 12).
Fig. 12. Contracting Triangle Segment 3-4 must be less than
segment 1-2, and segment 5-6 must be less than 3-4
The rest conditions are similar to those of the horizontal pattern: the horizontal position of the triangle or the up/downward slope, entry at a breakout of the resistance level formed by the last two tops or of the horizontal level drawn at the last top, similar calculation of the target level.
Expanding Triangle
The above ideals about the Contracting Triangle can be applied to the Expanding Triangle, the only difference is that now the Zigzag segments that form the pattern increase (Fig. 13).
Fig. 13. Expanding Triangle. Segment 3-4 must be larger than
segment 1-2, and segment 5-6 must be larger than 3-4
Based on such a significant similarity of all three patterns, we can create one universal indicator for their search.
A universal indicator to search for the Horizontal Pattern and Triangles
In order to create the indicator, we will use the iUniZigZagSW indicator from the Universal ZigZag article. The following additional files are also required: CSorceData.mqh, CZZDirection.mqh and CZZDraw.mqh. These files and the iUniZigZagSW.mq5 file can be downloaded from the attachment to the Universal ZigZag article. Download the archive, unzip it and copy the MQL5 folder from it to the terminal data folder. After copying, the ZigZag folder will appear in MQL5/Indicators containing several files (including iUniZigZagSW.mq5), and another ZigZag folder containing files CSorceData.mqh, CZZDirection.mqh and CZZDraw.mqh will appear in MQL5/Includes. After copying the files, restart the terminal to compile the indicators or compile them one by one in the MetaEditor. Make sure that the iUniZigZagSW indicator works properly by running it on a chart in the terminal.
In the Wolfe Waves article, the iWolfeWaves_Step_1.mq5 file was saved at an intermediate step of indicator creation. It implements the access of the iUniZigZagSW.mq5 indicator using the iCustom() function. Also, an array with all ZigZag tops and bottoms is formed in it. Download the attachment to the 'Wolfe Waves' article, unzip it, copy iWolfeWaves_Step_1.mq5 to MQL5/Indicators, rename it to "iHorizontalFormation" and open it in the MetaEditor. All further work with the indicator that detects the Horizontal Pattern will be performed in this file. It may be needed to change the path to the iUniZigZagSW indicator in this file. To check this, compile the indicator and try to run it on a chart. If a window with "Error load indicator" message opens, find in OnInit() the call of iCustom(), and change the name of the indicator from "iUniZigZagSW" to "ZigZags\\iUniZigZagSW". After fixing, compile the indicator again and make sure that it can run on a chart without errors. At this stage, the indicator does not draw anything.
The entire process of search for the patterns discussed here can be divided into several independent tasks:
- Determining the value of the price movement preceding the pattern formation.
- Determining the shape of the pattern.
- Determining the slope of the pattern.
- Completion of pattern formation: immediately after pattern formation or waiting for a breakout level.
- Determining the target.
Each task (except for the first one) will be provided with several solution options. This will help us create a universal indicator that can be used to identify all three patterns. We will be able to switch between the options in the indicator parameters window using drop-down lists of enumerations.
An enumeration for selecting a shape (pattern type):
enum EPatternType{
   PatternTapered,
   PatternRectangular,
   PatternExpanding
};
The corresponding variable in the properties window:
input EPatternType Pattern = PatternRectangular; This parameter allows choosing a pattern shape: PatternTapered — contracting triangle, PatternRectangular - rectangle, PatternExpanding - expanding triangle.
An enumeration for selecting the pattern slope:
enum EInclineType{
   InclineAlong,
   InclineHorizontally,
   InclineAgainst
};
The corresponding variable in the properties window:
input EInclineType Incline = InclineHorizontally; This parameter allows selecting the pattern slope: InclineAlong — inclined in the direction of the expected movement (upward for buys and downward for sells), InclineHorizontally — no slope, InclineAgainst — inclined in the direction opposite to the expected movement.
An enumeration for selecting the pattern completion method:
enum EEndType{
   Immediately,
   OneLastVertex,
   TwoLastVertices
};
The corresponding variable in the properties window:
input EEndType CompletionType = Immediately; The following options are available: Immediately after the pattern formation, OneLastVertex — after the breakout of the last horizontal level at the last top of the pattern, TwoLastVertices — after the breakout of the last level formed by the last two tops of the pattern.
An enumeration for selecting the target calculation option:
enum ETargetType{
   FromVertexToVertex,
   OneVertex,
   TwoVertices
};
The corresponding variable in the properties window:
input ETargetType Target = OneVertex; The following options are available: FromVertexToVertex (Fig. 11), OneVertex (Fig. 10), TwoVertices, two initial bottoms of the pattern are used (See Fig. 14).
Fig. 14. A pattern of three tops. Target determining option is TwoVertices,
pattern completion method is OneLastVertex.
When the pattern completion method is set to Immediately, the Target parameter is invalid, because only FromVertexToVertex can be used. For the other two pattern completion options (OneLastVertex and TwoLastVertices), different combinations with all three CompletionType options are possible. Please note the following feature: if OneVertex or TwoVertices option is selected for determining the target, one or two first bottoms (point 2, or points 2 and 4 in Fig. 14) are used for determining the target, while the breakout level is determined based on the last one or two tops (point 5 or points 3 and 5 in Fig. 14). If a pattern of two tops were used, point 3 or points 1 and 3 would be used.
To solve task 1, we need one parameter determining the size of the price movement preceding the pattern:
input double K1 = 1.5;
The hight of segment 1-2 (see Fig. 14) is considered to be the pattern basis (its reference size), and all checks of size will be performed relative to it. The K1 parameter determines how many times the segment 0-1 should be greater than the height of segment 1-2.
To determine the pattern shape, we use the K2 parameter:
input double K2 = 0.25;
The smaller the parameter value, the more constant the height of the pattern should be over its entire length. For triangular patterns (expanding and contracting), an increase of the parameter will mean search for patterns with the most clearly expressed triangular shape.
To determine the pattern slope, we use the K3 parameter:
input double K3 = 0.25;
A smaller parameter value, means that the indicator will search for a horizontally positioned pattern. When searching for inclined patterns, a larger value of the K2 parameter will allow finding patterns with a clear slope.
Finally, one of the main parameters:
input int N = 2;
The N parameter determines the number of pattern vertices.
As a result, we have the following set of external parameters (in addition to ZigZag parameters):
input EPatternType         Pattern        =  PatternRectangular;
input EInclineType         Incline        =  InclineHorizontally;
input double               K1             =  1.5;
input double               K2             =  0.25;
input double               K3             =  0.25;
input int                  N              =  2;
input EEndType             CompletionType =  Immediately;
input ETargetType          Target         =  OneVertex;
Using the N parameter, we calculate how many ZigZag points we need to determine the pattern. First, we declare a global variable:
int RequiredCount; In the OnInit() function, we calculate its value:
RequiredCount=N*2+2;
2*N is the number of vertices that form the pattern (N tops and N bottoms). Another vertex determines the previous price movement and one more vertex is the last point of the new ZigZag segment (not used in calculations).
All further operations will be performed in the OnTick() function. The new code will be added to the very end of the main indicator cycle. Pattern formation conditions will be checked if there are enough ZigZag points and only when its direction changes. The price and level will be checked with each ZigZag change:
if(CurCount>=RequiredCount){
   if(CurDir!=PreDir){
      // Checking conditions

   }
   // Checking the price and the level

}
First, we calculate the base value, i.e. the height of segment 1-2 (see Fig. 14). This value will be used when checking all conditions for pattern formation. Then, the condition of task 1, i.e. the size of the previous movement is checked:
int li=CurCount-RequiredCount;                                            // Index of the initial pattern point in the PeackTrough array
double base=MathAbs(PeackTrough[li+1].Val-PeackTrough[li+2].Val);        // Basic value
double l1=MathAbs(PeackTrough[li+1].Val-PeackTrough[li].Val);             // Height of segment 1-2
   if(l1>=base*K1){                                                       // Checking the size of the previous movement
        // Other checks

   }
Further checks will depend on whether the last segment of the ZigZag is pointed up or down.
if(CurDir==1){              // The last ZigZag segment is pointed up
   // Checking the condition for an upward direction

}
else if(CurDir==-1){        // The last ZigZag segment is pointed down
   // Checking the condition for a downward direction

}
Let us consider the check of the condition for the upward direction:
if(CheckForm(li,base) && CheckInclineForBuy(li,base)){      // Checking the form and the direction
   if(CompletionType==Immediately){
      // Draw an indicator arrow
      UpArrowBuffer[i]=low[i];
      // Draw the target point
      UpDotBuffer[i]=PeackTrough[CurCount-1].Val+l1;
   }
   else{
      // Setting parameters of the breakout level
      SetLevelParameters(1);
      // Setting target parameters
      SetTarget(1,li);
   }
}
The pattern formation condition is checked using the two functions: CheckForm() to check the pattern form and CheckInclineForBuy() to check the slope. If the form and slope are successfully checked, then either an arrow and a target point are drawn on the chart or parameters of a breakout level to be further watched are set, depending on the type of pattern completion.
The CheckForm() function. The index of the first point of the pattern in the PeackTrough array and the basic value 'base' are passed to the function. Here is the function code:
bool CheckForm(int li,double base){
   switch(Pattern){
      case PatternTapered:
         // contracting
         return(CheckFormTapered(li,base));
      break;
      case PatternRectangular:
         // rectangular
         return(CheckFormRectangular(li,base));
      break;
      case PatternExpanding:
         // expanding
         return(CheckFormExpanding(li,base));
      break;
   }
   return(true);
}
In the function, appropriate functions are called depending on the value of the Pattern parameter: CheckFormTapered() for a contracting triangle, CheckFormRectangular() for a rectangular pattern, CheckFormExpanding() for an expanding triangle.
The CheckFormTapered() function:
bool CheckFormTapered(int li,double base){
   // Loop from 1, the first segment is not checked,
   // but all subsequent segments are checked relative to it
   for(int i=1;i<N;i++){
      // Calculating the index of the next upper point of the pattern
      int j=li+1+i*2;
      // The value of the next segment
      double lv=MathAbs(PeackTrough[j].Val-PeackTrough[j+1].Val);
      // The value of the previous segment
      double lp=MathAbs(PeackTrough[j-2].Val-PeackTrough[j-1].Val);
      // The previous segment should be larger, otherwise,
      // the function returns false
      if(!(lp-lv>K2*base)){
         return(false);
      }
   }
   return(true);
}
In the function, the ZigZag segments that form the pattern are checked in a loop, while each next segment must be smaller than the previous one.
The CheckFormExpanding() function is similar, with one difference:
if(!(lv-lp>K2*base)){
   return(false);
}
To fulfill this condition, each subsequent segment must be greater than the previous one.
The CheckFormRectangular() function:
bool CheckFormRectangular(int li,double base){
   // Loop through all the tops except the first
   for(int i=1;i<N;i++){
      // Calculating the index of the next top
      int j=li+1+i*2;
      // Calculating the size of the next segment
      double lv=MathAbs(PeackTrough[j].Val-PeackTrough[j+1].Val);
      // The segment should not differ much from the base value
      if(MathAbs(lv-base)>K2*base){
         return(false);
      }
   }
   return(true);
}
In this function, each segment is compared to the base value. If the difference is significant, the function returns false.
If the form check is successful, the slope is checked. The CheckInclineForBuy() function:
bool CheckInclineForBuy(int li,double base){
   switch(Incline){
      case InclineAlong:
         // Slope in the movement direction
         return(CheckInclineUp(li,base));
      break;
      case InclineHorizontally:
         // No slope
         return(CheckInclineHorizontally(li,base));
      break;
      case InclineAgainst:
         // Slope opposite to the movement direction
         return(CheckInclineDn(li,base));
      break;
   }
   return(true);
}
The slope checking function for selling differs in two lines:
bool CheckInclineForSell(int li,double base){
   switch(Incline){
      case InclineAlong:
         // Slope in the movement direction
         return(CheckInclineDn(li,base));
      break;
      case InclineHorizontally:
         // No slope
         return(CheckInclineHorizontally(li,base));
      break;
      case InclineAgainst:
         // Slope opposite to the movement direction
         return(CheckInclineUp(li,base));
      break;
   }
   return(true);
}
If Incline is equal to InclineAlong (in the movement direction), the CheckInclineUp() is called for buying and the CheckInclineDn() is called for selling. Oppositely for Incline = InclineAgainst.
CheckInclineUp(), the function for checking the upward slope of the pattern:
bool CheckInclineUp(int li,double base){
   // Loop through all the tops except the first
   for(int v=1;v<N;v++){
      // Calculating the index of the next top
      int vi=li+1+v*2;
      // Calculating the middle of the next ZigZag segment
      double mc=(PeackTrough[vi].Val+PeackTrough[vi+1].Val)/2;
      // Calculating the middle of the previous ZigZag segment
      double mp=(PeackTrough[vi-2].Val+PeackTrough[vi-1].Val)/2;
      // The next segment should be higher than the previous one
      if(!(mc>mp+base*K3)){
         return(false);
      }
   }
   return(true);
}
All segments of the ZigZag are checked in the function: the middle of each segment is calculated and compared to the middle of the previous segment. Each segment should be higher than the previous one by the base*K3 value.
The CheckInclineDn() function differs in one condition:
if(!(mc<mp-base*K3)){
   return(false);
}
To fulfill this condition, each subsequent segment must be lower than the previous one.
The CheckInclineHorizontally() function:
bool CheckInclineHorizontally(int li,double base){
   // The middle of the base segment
   double mb=(PeackTrough[li+1].Val+PeackTrough[li+2].Val)/2;
   for(int v=1;v<N;v++){
      // The index of the next upper point
      int vi=li+1+v*2;
      // The middle of the next segment
      double mc=(PeackTrough[vi].Val+PeackTrough[vi+1].Val)/2;
      // The middle of the next segment should not deviate too much
      // from the middle of the base segment
      if(MathAbs(mc-mb)>base*K3){
         return(false);
      }
   }
   return(true);
}
In case of successful checks of the shape and slop, the following code part is executed:
if(CompletionType==Immediately){                    // Immediate entry
   UpArrowBuffer[i]=low[i];
   UpDotBuffer[i]=PeackTrough[CurCount-1].Val+l1;
}
else{                                               // Waiting for the level breakout
   SetLevelParameters(1);
   SetTarget(1,li);
}
If the pattern completion is set to Immediately, the indicator draws an arrow an puts a target point. In other cases a breakout level is set using the SetLevelParameters() function and the target is set using SetTarget().
The SetLevelParameters() function:
void SetLevelParameters(int dir){
   CurLevel.dir=dir;
   switch(CompletionType){
      case OneLastVertex:                            // Based on one point
          CurLevel.v=PeackTrough[CurCount-3].Val;
      break;
      case TwoLastVertices:                          // Based on two points
         CurLevel.x1=PeackTrough[CurCount-5].Bar;
         CurLevel.y1=PeackTrough[CurCount-5].Val;
         CurLevel.x2=PeackTrough[CurCount-3].Bar;
         CurLevel.y2=PeackTrough[CurCount-3].Val;
      break;
   }
}
In the SetLevelParameters() function, the SLevelParameters structure is used to store the level parameters:
struct SLevelParameters{
   int x1;
   double y1;
   int x2;
   double y2;       // from x1 to y2 - inclined level parameters
   double v;        // The value of the horizontal level
   int dir;         // Direction
   double target;   // Target
   // A method for calculating the value of the inclined level
   double y3(int x3){
      if(CompletionType==TwoLastVertices){
            return(y1+(x3-x1)*(y2-y1)/(x2-x1));
      }
      else{
         return(v);
      }
   }
   // A method for initializing or resetting parameters
   void Init(){
      x1=0;
      y1=0;
      x2=0;
      y2=0;
      v=0;
      dir=0;
   }
};
The structure contains fields for the line parameters: x1, y1, x2, y2; field 'v' for the horizontal level value; 'd' is the direction of the pattern; 'target' is the target. The target can be set as a price level (when FromVertexToVertex is used) or as a breakout level value (when OneVertex or TwoVertices is used). The y3() method is used for calculating the value of the inclined level. The Init() method is used for initializing or resetting values.
If all the pattern formation conditions are met, the SetLevelParameter() function is called. Depending on the selected level type (horizontal or sloping) the parameters of the sloping level (fields x1, y1, x2, y2) or one horizontal level value 'v' are set in this function. In the y3() method, the level value is calculated using fields x1, y1, x2, y2 or the value of the 'v' field is returned.
Two variables of type SLevelParameters are declared in the indicator:
SLevelParameters CurLevel;
SLevelParameters PreLevel;
This pair of variables is used similarly to the pairs of variables CurCount-PreCount and CurDir-PreDir, and the values of the variables are reset before the initial calculation of the indicator (the code part is located at the very beginning of the OnTick() function):
int start;

if(prev_calculated==0){           // The first calculation of all bars
   start=1;
   CurCount=0;
   PreCount=0;
   CurDir=0;
   PreDir=0;
   CurLevel.Init();
   CurLevel.Init();
   LastTime=0;
}
else{                           // Calculation of new bars and of the forming bar
   start=prev_calculated-1;
}
During the calculation of each bar, the values in these variables are moved (the code is at the beginning of the indicator cycle):
if(time[i]>LastTime){
   // The first calculation of the new bar
   LastTime=time[i];
   PreCount=CurCount;
   PreDir=CurDir;
   PreLevel=CurLevel;
}
else{
   // Re-calculation of bars
   CurCount=PreCount;
   CurDir=PreDir;
   CurLevel=PreLevel;
}
Target parameters are set by calling the SetTarget() function:
void SetTarget(int dir,int li){
   switch(Target){
      case FromVertexToVertex:
         // Version 'from vertex to vertex'
         if(dir==1){
            CurLevel.target=PeackTrough[CurCount-1].Val+(PeackTrough[li+1].Val-PeackTrough[li].Val);
         }
         else if(dir==-1){
            CurLevel.target=PeackTrough[CurCount-1].Val-(PeackTrough[li].Val-PeackTrough[li+1].Val);
         }
      break;
      case OneVertex:
         // Using one vertex
         CurLevel.target=MathAbs(PeackTrough[li].Val-PeackTrough[li+2].Val);
      break;
      case TwoVertices:
         // Using two vertices
         SetTwoVerticesTarget(dir,li);
      break;
   }
}
A price value is calculated for FromVertexToVertex. For OneVertex, the value of price movement from the breakout level to the target is assigned to the 'target' field. Calculation for SetTwoVerticesTarget is performed in the SetTwoVerticesTarget() function:
void SetTwoVerticesTarget(int dir,int li){
   // Coordinate of the initial (long) line
   // of the pattern - from bottom to top
   double x11=PeackTrough[li].Bar;
   double y11=PeackTrough[li].Val;
   double x12=PeackTrough[li+1].Bar;
   double y12=PeackTrough[li+1].Val;
   // Coordinates of the line drawn through two bottoms for buying
   // or thorough two tops for selling
   double x21=PeackTrough[li+2].Bar;
   double y21=PeackTrough[li+2].Val;
   double x22=PeackTrough[li+4].Bar;
   double y22=PeackTrough[li+4].Val;
   // Value at the intersection of lines
   double t=TwoLinesCrossY(x11,y11,x12,y12,x21,y21,x22,y22);
   // Setting the target value depending on the direction
   if(dir==1){
      CurLevel.target=t-PeackTrough[li].Val;
   }
   else if(dir==-1){
      CurLevel.target=PeackTrough[li].Val-t;
   }
}
For the SetTwoVerticesTarget version, the 'target' field is assigned the value of price movement from the breakout level to the target, similar to OneVertex.
Let us consider how the price and level tracking is performed (CompletionType is not equal to Immediately):
// A level is used
if(CompletionType!=Immediately){
   // ZigZag has turned
   if(PeackTrough[CurCount-1].Bar==i){
      if(CurLevel.dir==1){                // Wait for an upward breakout
         // Get the level value to the cl variable
         double cl=CurLevel.y3(i);
         // The ZigZag breaks the level
         if(PeackTrough[CurCount-1].Val>cl){
            // Setting an arrow up
            UpArrowBuffer[i]=low[i];
            // Setting the target point
            if(Target==FromVertexToVertex){
               // Price in the 'target' field
               UpDotBuffer[i]=CurLevel.target;
            }
            else{
               // Distance from the level in the 'target' field
               UpDotBuffer[i]=cl+CurLevel.target;
            }
            // Zeroing the 'dir' field to stop tracking the level
            CurLevel.dir=0;
         }
      }
      else if(CurLevel.dir==-1){         // Wait for a downward breakout
         // Get the level value to the cl variable
         double cl=CurLevel.y3(i);
         // The ZigZag breaks the level
         if(PeackTrough[CurCount-1].Val<cl){
            // Setting an arrow down
            DnArrowBuffer[i]=low[i];
            // Setting the target point
            if(Target==FromVertexToVertex){
               // Price in the 'target' field
               DnDotBuffer[i]=CurLevel.target;
            }
            else{
               // Distance from the level in the 'target' field
               DnDotBuffer[i]=cl-CurLevel.target;
            }
            // Zeroing the 'dir' field to stop tracking the level
            CurLevel.dir=0;
         }
      }
   }
}
This check is performed every time the ZigZag changes. All ZigZag peaks are stored in the PeackTrough array, the change is determined by the correspondence of the index of the last ZigZag point to the current bar index:
if(PeackTrough[CurCount-1].Bar==i){
The current level value is calculated using the y3() method:
double cl=CurLevel.y3(i); It is checked whether the last ZigZag segment has broken through this level:
if(PeackTrough[CurCount-1].Val>cl){
If the level is broken, the indicator draws an arrow and adds a target point. The 'target' field may contain the price value of the target. In this case the value is used directly. It can also contain the distance to the target, in which case the target is calculated based on the current level value:
if(Target==FromVertexToVertex){
   UpDotBuffer[i]=CurLevel.target;
}
else{
   UpDotBuffer[i]=cl+CurLevel.target;
}
At the end, the 'dir' field is reset to stop tracking the price, until the next pattern appears:
CurLevel.dir=0; Now, the indicator creation is over. Some fragments of its operation are shown in Fig. 15.
Fig. 15. Signals of the iHorizontalFormation indicator
An alert function has been additionally added to the indicator. The ready-to-use indicator is available in the below attachment, the file name is iHorizontalFormation.
A universal indicator to search for the Flag, the Pennant and the Wedge
Now, we will create an indicator for searching for the second category patterns. Their shape is formed by bars that fill the pattern area. A pattern begins with a strong price movement. In this case it starts with a long bar. We use the ATR indicator with a large period to determine long bars. A bar is considered long if its shadow size exceeds the ATR value multiplied by a coefficient. Hence, we need external parameters for the ATR period and a coefficient:
input int                  ATRPeriod            =  50;
input double               K1                   =  3;
Let us declare a global indicator variable for the ATR handle:
int h; In the OnInit() function, load the ATR indicator and get the handle value:
h=iATR(Symbol(),Period(),ATRPeriod);
if(h==INVALID_HANDLE){
   Alert("Error load indicator");
   return(INIT_FAILED);
}
Get the ATR value in the main indicator cycle:
double atr[1];
if(CopyBuffer(h,0,rates_total-i-1,1,atr)==-1){
   return(0);
}
Check the bar size using the ATR value. If the size of the bar shadow exceeds the threshold value set by the coefficient, we will need to determine the direction of the expected price movement. The direction is determined by the color (based on Open and Close). If the Close price is above Open, further upward price movement is expected. If the Close price is below Open, further downward price movement is expected.
if(high[i]-low[i]>atr[0]*K1){    // A long bar
   if(close[i]>open[i]){         // The bar is directed upwards
      Cur.Whait=1;
      Cur.Count=0;
      Cur.Bar=i;
   }
   else if(close[i]<open[i]){    // The bar is directed downwards
      Cur.Whait=-1;
      Cur.Count=0;
      Cur.Bar=i;
   }
}
When the bar size and direction conditions are met, the fields of the Cur structure are set to the appropriate values: the expected direction is set in the Whait field (1 up, -1 down), and the Count field is reset. It is assigned a value of 0. This field will be used to count the number of bars in the pattern. The index of the initial (long) bar of the pattern is saved in the 'Bar' field.
Let us analyze the Cur structure. The structure has three fields and the Init() method for the fast reset of all fields:
struct SCurPre{
   int Whait;
   int Count;
   int Bar;
   void Init(){
      Whait=0;
      Count=0;
      Bar=0;
   }
};
Two static variables if this type and a variable of the datetime type are declared at the beginning of the OnTick() function:
static datetime LastTime=0;
static SCurPre Cur;
static SCurPre Pre;
Then we calculate the index of the first bar from which the indicator calculation starts and the Cur and Pre variables are initialized:
int start=0;

if(prev_calculated==0){           // The first calculation of the indicator

   start=1;

   Cur.Init();
   Pre.Init();

   LastTime=0;
}
else{                             // Calculation of new bars and the forming bar
   start=prev_calculated-1;
}
Values in the Cur and Pre variables are moved at the beginning of the main indicator cycle:
if(time[i]>LastTime){       // The first calculation of a bar
   LastTime=time[i];
   Pre=Cur;
}
else{                      // Re-calculation of a bar
   Cur=Pre;
}
This method with variables is discussed in detail in the Wolfe Waves article (variables PreCount and CurCount). In this article, it was used when creating the iHorizontalFormation indicator (variables with Cur and Pre prefixes).
If the Cur.Count variable is non-zero, then the indicator is refining conditions for pattern detection. The number of bars constituting a pattern is counted, and the CurCount variable is increased. The first bar after the long bar is skipped, and following checks are performed beginning with the third bar:
if(Cur.Whait!=0){
   Cur.Count++;            // Counting the number of bars
   if(Cur.Count>=3){
      // Further checks

   }
}
The main indication of further checks is the overlap of bars (Fig. 16).
Fig. 16. The overlap of two bars L is defined as the difference between
the minimum high price and the maximum low price
The overlap is calculated using two bars and is equal to the difference between the lowest High and the highest Low:
Overlapping=MathMin(high[i],high[i-1])-MathMax(low[i],low[i-1]);
Overlapping with the initial bar is not checked, so the overlapping check begins from the third bar rather than the second one.
The overlap of two bars must exceed a threshold value. If the value were set in points, the work of the indicator would strongly depend on the timeframe, since the value of the parameter would differ much on different timeframes. In order not to depend on the timeframe, let us define the base value for the checked bars using the longest shadow of two bars:
double PreSize=MathMax(high[i-1]-low[i-1],high[i]-low[i]);
Check the bar overlap value:
if(!(Overlapping>=PreSize*MinOverlapping)) If two bars do not overlap, a series of consecutive overlapping bars is considered to be over. In this case, we check the number of bars in the row:
if(Cur.Count-2>=MinCount){
   // Further checks
}
Cur.Whait=0;
If the number of bars in the row exceeds the value of the MinCount variable, additional checks are performed. Otherwise the wait for the pattern formation is terminated by zeroing the CurCount variable. In the above code, when checking the condition, 2 is subtracted from the CurCount variable, i.e. the first long bar and the finishing bar on which the overlap condition is not met are not taken into account.
MinOverlapping and MinCount are external variables of the indicator:
input double               MinOverlapping       =  0.4;
input int                  MinCount             =  5;
Once the condition on the number of overlapping bars is met, we proceed to further checks: the shape of the pattern and the slope. First we determine the parameters of the found series of overlapping bars:
double AverSize,AverBias,AverSizeDif;
PatternParameters(high,low,i-1,Cur.Count-2,AverSize,AverBias,AverSizeDif);
Parameters are determined in the PatternParameters() function, and are returned by reference in the AverSize, AverBias, AverSizeDif variables. The average bar size is return in AverSize, the average shift of bar centers is returned in AverBias, and the average difference between the sizes of two adjacent bars is returned in AverSizeDif. Let us consider in detail the PatternParameters() function in order to understand how these parameters are calculated:
void PatternParameters( const double & high[],
                        const double & low[],
                        int i,
                        int CurCnt,
                        double & AverSize,
                        double & AverBias,
                        double & AverSizeDif
){

   // The average bar size
   AverSize=high[i-CurCnt]-low[i-CurCnt];
   // The average bar shift
   AverBias=0;
   // The average difference between the sizes of two adjacent bars
   AverSizeDif=0;

   for(int k=i-CurCnt+1;k<i;k++){      // All bars of the series except for the first one
      // Average size
      AverSize+=high[k]-low[k];
      // Average shift
      double mc=(high[k]+low[k])/2;
      double mp=(high[k-1]+low[k-1])/2;
      AverBias+=(mc-mp);
      // Average difference of sizes
      double sc=(high[k]-low[k]);
      double sp=(high[k-1]-low[k-1]);
      AverSizeDif+=(sc-sp);

   }

   // Dividing sums by the quantities
   AverSize/=CurCnt;
   AverBias/=(CurCnt-1);
   AverSizeDif/=(CurCnt-1);
}
The following data is passed to the function: two arrows 'high' and 'low', the index of the bar on which overlapping ends, the length of the series and three variables for return values. Values are calculated in the for cycle. Since AverBias and AverDiff are calculated for two adjacent bars, the first bar of the series is skipped:
for(int k=i-CurCnt+1;k<i;k++)
Therefore, before the cycle, AverBias and AverDiff are reset and the AverSize variable is set to the value calculated based on the bar that was skipped in the cycle.
Bar sizes are added to AverSize in the loop:
AverSize+=high[k]-low[k];
For AverBias (shift), the middle points of bars are calculated, and then the difference between them is calculated, the resulting difference is summarized:
double mc=(high[k]+low[k])/2;
double mp=(high[k-1]+low[k-1])/2;
AverBias+=(mc-mp);
For AverSizeDif, the sizes of adjacent bars and the difference between them are calculated, the resulting difference is summarized:
double sc=(high[k]-low[k]);
double sp=(high[k-1]-low[k-1]);
AverSizeDif+=(sc-sp);
After the cycle, all sums are divided by the number of summed values:
AverSize/=CurCnt;
AverBias/=(CurCnt-1);
AverSizeDif/=(CurCnt-1);
After calculating parameters, the pattern shape is checked. This check does not depend on the direction of the expected price movement. The shape is checked using three functions: FormTapered() for a contracting shape (The Pennant), FormHorizontal() for a rectangular shape (The Flag), FormExpanding() for an expanding shape (The Wedge):
if(   FormTapered(AverSizeDif,AverSize) ||
      FormHorizontal(AverSizeDif,AverSize) ||
      FormExpanding(AverSizeDif,AverSize)
){
   // Checking the direction
}
The iHorizontalFormation indicator settings allow selecting only one of three forms, while here the three forms are used independently. This is due to the fact that conditions are met more rarely, and trading signals are also rare. Three variables in the indicator parameters allow enabling/disabling each of the patterns. In addition, each shape is provided with a coefficient in the properties window:
input bool                 FormTapered          =  true;
input double               FormTaperedK         =  0.05;
input bool                 FormRectangular      =  true;
input double               FormRectangularK     =  0.33;
input bool                 FormExpanding        =  true;
input double               FormExpandingK       =  0.05;
Let's analyze the form checking functions. The FormTapered() function:
bool FormTapered(double AverDif, double AverSize){
   return(FormTapered && AverDif<-FormTaperedK*AverSize);
}
If the average difference between the sizes of bars is less than the negative threshold value, then the bar sizes are considered to be decreasing, which corresponds to the contracting shape of the pattern:
The FormHorizontal() function:
bool FormHorizontal(double AverDif, double AverSize){
   return(FormRectangular && MathAbs(AverDif)<FormRectangularK*AverSize);
}
If the average difference between the sizes of bars is less than the negative threshold value, then the bars are considered to have equal sizes, which corresponds to the rectangular shape of the pattern:
The FormExpanding() function:
bool FormExpanding(double AverDif, double AverSize){
   return(FormExpanding && AverDif>FormExpandingK*AverSize);
}
In this function, in contrast to the contracting pattern, the average bar size difference should exceed the positive threshold value, which corresponds to increasing bars and the expanding shape.
If the shape check is successfully completed, the pattern slope is checked. This check depends on the direction of the expected price movement. CheckInclineForBuy() is used for an upward direction, CheckInclineForSell() is used for the downward direction:
if(Cur.Whait==1){
   if(CheckInclineForBuy(AverBias/AverSize)){
      // Additional checks for the upward direction

   }
}
else if(Cur.Whait==-1){
   if(CheckInclineForSell(AverBias/AverSize)){
      // Additional checks for the downward direction

   }
}
Slope checking options are enabled separately, similar to shape checking options. Appropriate variables are available in the properties window. A separate coefficient is available for each slope option in the properties window:
input bool                 InclineAlong         =  true;
input double               InclineAlongK        =  0.1;
input bool                 InclineHorizontal    =  true;
input double               InclineHorizontalK   =  0.1;
input bool                 InclineAgainst       =  true;
input double               InclineAgainstK      =  0.1;
The CheckInclineForBuy() function:
bool CheckInclineForBuy(double Val){
   return(  (InclineAlong && Val>InclineAlongK) ||
            (InclineHorizontal && MathAbs(Val)<InclineHorizontalK) ||
            (InclineAgainst && Val<-InclineAgainstK)
   );
}
The value of the relative shift of bars AverBias/AverSize is passed to the function. If it is above the positive threshold, then the pattern is considered to be sloping upward; if it is lower than the negative threshold, then the slope is downward. If the value is within the threshold value without taking into account the sign, then the pattern is horizontal:
bool CheckInclineForBuy(double Val){
   return(  (InclineAlong && Val>InclineAlongK) ||
            (InclineHorizontal && MathAbs(Val)<InclineHorizontalK) ||
            (InclineAgainst && Val<-InclineAgainstK)
   );
}
Similarly, for the downward direction:
bool CheckInclineForSell(double Val){
   return(  (InclineAlong && Val<-InclineAlongK) ||
            (InclineHorizontal && MathAbs(Val)<InclineHorizontalK) ||
            (InclineAgainst && Val>InclineAgainstK)
   );
}
Now, a downward slope corresponds to the movement direction, and an upward slope is a sign of a counter direction.
The last check is the direction of the finishing bar. There are two variants of the last check: the finishing bar is directed either in the direction of the pattern or against it. The following parameters in the properties window allow enabling variants of the last check:
input bool                 EnterAlong           =  true;
input bool                 EnterAgainst         =  true;
Check for the upward direction is performed as follows:
if((EnterAlong && close[i]>open[i]) || (EnterAgainst && close[i]<open[i])){
   Label1Buffer[i]=low[i];
   Label3Buffer[i]=close[i]+(high[Cur.Bar]-low[Cur.Bar]);
}
If EnterAlong is selected and the bar is directed upwards, or EnterAgainst is selected and the bar is directed downwards, the indicator draws an arrow and a target point. The target is at a distance equal to the size of the initial large bar.
Similarly, for the downward direction:
if((EnterAlong && close[i]<open[i]) || (EnterAgainst && close[i]>open[i])){
   Label2Buffer[i]=high[i];
   Label4Buffer[i]=close[i]-(high[Cur.Bar]-low[Cur.Bar]);
}
This indicator can be considered complete. The ready indicator with an alert function is available in the below attachment, the file name is iFlag.
Tester Indicator
The easiest and most convenient way to test the efficiency of the indicator is to run an Expert Advisor in the Strategy Tester. In the Wolfe Waves article, the author created a simple Expert Advisor. We can slightly change the EA and use it to test indicators created in this article. Indexing of buffers of the iHorizontalFormation and iFlag indicators corresponds to indexing of iWolfeWaves buffers. So we only need to change external parameters of the Expert Advisor and the iCustom() call.
There is another interesting way of testing indicators, which allows evaluating their effectiveness on the fly: a tester indicator. Trading based on the arrows of the main indicator is simulated in the additional indicator, while the equity and balance lines are displayed on the chart.
The easiest and the most obvious approach to creating a tester indicator is to use the iCustom() function. But this approach has significant disadvantages: the main indicator that draws arrows is shown in the price chart window, while the tester indicator drawing the equity and balance curves is displayed in a subwindow. So, we need to run two indicators with the same parameters in a chart. If later you need to change the parameters, you will need to do it for the two indicators, which is not convenient.
Another variant is to make the tester indicator draw arrows as graphical objects on the chart.
The third variant is to use the ChartIndicatorAdd() function. This function allows attaching another indicator to the chart. In this case, each time you change the parameters of the main indicator, you will need to find the additional tester indicator on the chart, remove it and re-start with new parameters. This is an acceptable and convenient option.
But there is also the fourth variant, which is no less convenient than the third one, and is even simpler in terms of implementation. In addition, we can create one universal tester indicator and use it with both the iHorizontalFormation indicator and the iFlag indicator with a slight modification.
The modification of iHorizontalFormation and iFlag is connected with the need to create the external ID variable:
input int ID = 1;
Then, we set a short indicator name in OnInit using this variable:
string ShortName=MQLInfoString(MQL_PROGRAM_NAME)+"-"+IntegerToString(ID);
IndicatorSetString(INDICATOR_SHORTNAME,ShortName);
A short name consists of the indicator file name, the "-" sign and the value of the ID variable. The tester indicator will be able to find the main indicator and get its handle using this short name.
The iHorizontalFormation indicator is based on a ZigZag which can be calculated using high-low, close or other indicators. When calculated using high-low, drawn arrows do not disappear from the chart. And if we use this indicator for trading, we can analyze its signals on the currently forming bar. In other cases when calculating Zigzag using Close prices and other indicators, the arrows should be tracked on the already formed bar. So, we need to inform the tester indicator on what bar it should check the arrow.
The iHorizontalFormation and iFlag indicators draw target points that can be used for setting take profit. But for iHorizontalFormation it is only possible if the ZigZag is calculated using the price. So we need to inform the tester indicator of whether it should use the target points or additional parameters of take profit and stop loss. The first idea is to use a global variable to pass data. But the MetaTrader 5 terminal has the following peculiarity: when indicator parameters are changed, a new instance of the indicator is loaded with a new handle, but the previous instance is not unloaded from memory immediately. Therefore, if we return the indicator external parameters, the new loading and calculation of the indicator will not be performed, which means that the OnInit() function will not be executed and the prev_calculated variable will not be reset. As a result, global variables will not receive a new value.
Parameters required for the tester indicator will be passed using an indicator buffer. One buffer element is enough for this. We use the existing element, which is the very first and the leftmost element. We need to pass two values. One of them determines whether the tester indicator should analyze the main indicator on the completely formed bar or on the currently emerging one. The second value sets whether to use the target point for the take profit of a position. The following code is added to OnCalculate() if prev_calculate=0:
int ForTester=0;       // A variable for the value
if(!(SrcSelect==Src_HighLow)){
   // Work on the completely formed bar
   ForTester+=10;
}
if(!(SrcSelect==Src_HighLow || SrcSelect==Src_Close)){
   // The target point can be used
   ForTester+=1;
}
UpArrowBuffer[0]=ForTester;
Using one array element, we need to pass two values which are not greater than 10. That is why we multiply one of them by ten and add the second one to it. Since the passed numbers can only have values of 0 or 1, we could use a number with a base of 2, but the amount of data transferred is insignificant, so there is no need to save bytes.
A similar modification should be performed for the iFlag indicator. In the OnInit() function:
string ShortName=MQLInfoString(MQL_PROGRAM_NAME)+"-"+IntegerToString(ID);
IndicatorSetString(INDICATOR_SHORTNAME,ShortName);
In OnCalculate():
Label1Buffer[0]=11;
The iFlag indicator can always be analyzed on the completely formed bar, and its target point can always be used. Therefore, the value 11 is assigned without calculations.
When using a completely formed bar, a position is obviously opened at the opening of a new bar. But when entering in the currently emerging bar, the entry price is unknown. So anther modification has been added to iHorizontalFormation: a buffer has been added to draw points on bars with arrows. The position open level is specified in this buffer.
Now we will work directly with the tester indicator. Create a new indicator named iTester and add external parameters:
input int                  ID             =  1;
input double               StopLoss_K     =  1;
input bool                 FixedSLTP      =  false;
input int                  StopLoss       =  50;
input int                  TakeProfit     =  50;
Here:
- ID is the identifier of the main indicator
- StopLoss_K is the coefficient used for calculating stop loss based on the take profit value when using the target point
- FixedSLTP means using the StopLoss and TakeProfit variables or using the target point and the StopLoss_K variable.
It would be very convenient if the tester indicator displayed in the upper left corner not just its name, but the name of the indicator which arrows it uses. But while the tested indicator is not yet attached to a chart, the name of the tester indicator will be displayed. Declare a global variable:
string IndName; In OnInit(), assign the name of the tester indicator to it:
IndName=MQLInfoString(MQL_PROGRAM_NAME);
Information about each position opened by the tester indicator is stored in an array of SPos structures, and the PosCnt variable is used to count the number of open positions:
struct SPos{
   int dir;
   double price;
   double sl;
   double tp;
   datetime time;
};
SPos Pos[];
int PosCnt;
A deal should be added to the array only once using the following variable:
datetime LastPosTime; When adding a position to the array, time from the LastPosTime variable and the time of the bar on which the position is opened are checked. When adding a position, a new time is set for the LastPosTime variable. If the bar time is equal to the time of LastPosTime, then the position is already open.
To close positions, i.e. to calculate profit, we will need two additional variables:
int Closed;
datetime CloseTime;
The profit of positions closed on one bar is assigned to the Closed variable, and the time of this bar is assigned to CloseTime. Further, we will see in detail how it works.
We have discussed all auxiliary variables and the OnInit() function. Now we can proceed to the OnCalculate() function. Declare the following auxiliary variables:
string name;
static int last_handle=-1;
static int shift=0;
static int use_target=0;
int handle=-1;
int start=2;
Description of the variables:
- name will be used for getting the indicator name in ChartIndicatorName();
- static variable last_handle will be used for storing the handle of the tested indicator;
- static variables shift and use_target will be used for parameters passed from the tested indicator;
- handle will be used for receiving the handle in ChartIndicatorGet();
- start will allow to start indicator calculation.
Let's analyze the code searching for the tested indicator. First, determine the number of indicators attached to the price chart:
int it=ChartIndicatorsTotal(0,0);
Use a loop:
for(int i=0;i<it;i++){        // All indicators on the chart
   // Getting the name of the next indicator
   name=ChartIndicatorName(0,0,i);
   // Search for the substring "-"
   int p=StringFindRev(name,"-");
   if(p!=-1){
      // The substring is found, the value of the identifier is checked
      if(StringSubstr(name,p+1,StringLen(name)-p-1)==IntegerToString(ID)){
         // The ID corresponds, get the handle
         handle=ChartIndicatorGet(0,0,name);
      }
   }
}
Let us consider the above code part in more detail. The 'name' variable is assigned the name of the indicator received using the ChartIndicatorName() function, which returns the name of an indicator with a given index. The correspondence of the received name to the ID is checked. For that purpose, the last occurrence of the substring "-" is searched. If "-" is found, the part of string that follows it is extracted. If it corresponds to the identifier, the 'handle' variable gets the handle value obtained by the ChartIndicatorGet() function, which returns a handle by the indicator name.
After obtaining the handle, compare it to the previously known handle from the variable last_handle (the variable is static, that is, it retains its value after the OnCalculate() function finishes):
if(handle!=last_handle){
   if(handle==-1){                    // No handle
      // Setting the source name
      IndicatorSetString(INDICATOR_SHORTNAME,IndName);
      ChartRedraw(0);
      return(0);
   }
   // Checking if the calculation of the tested indicator is completed
   int bc=BarsCalculated(handle);
   if(bc<=0)return(0);                // If not, the function is interrupted
   // Copying data with testing parameters
   double sh[1];
   if(CopyBuffer(handle,0,rates_total-1,1,sh)==-1){
      // If copying fails, the function is interrupted until
      // the next tick
      return(0);
   }
   // Extracting separate parameters
   shift=((int)sh[0])/10;              // Completed or emerging bar
   use_target=((int)sh[0])%10;         // Can the target point be used?
   last_handle=handle;                 // Saving the handle value
   // Setting the indicator name
   IndicatorSetString(INDICATOR_SHORTNAME,name);
   ChartRedraw(0);
}
else if(prev_calculated!=0){
   // If there is no new handle, only new bars are calculated,
   // as well as the currently forming bar
   start=prev_calculated-1;
}
If the value of the 'handle' variable is not equal to the value of last_handle, then the tested indicator has changed. Perhaps it has just been attached to the chart or its parameters have been edited. Also it may have been removed from the chart. If the indicator is removed from the chart, the 'handle' variable is equal to -1, while the tester indicator is set to the default name and the OnCalculate() function is finished. If the handle variable has a valid handle value, testing parameters are obtained: emerging/completed bar and the permission to use the target point. During further execution of OnCalculate(), 'handle' and 'last_handle' are equal, and a usual calculation of the 'start' variable, i.e. the initial bar from which calculation starts, is performed.
The default value of the 'start' variable is 2. If a full re-calculation of the indicator is needed (it is required when the handle is changed or when prev_calculated is equal to 0), it is necessary to reset some additional variables:
if(start==2){
   PosCnt=0;
   BalanceBuffer[1]=0;
   EquityBuffer[1]=0;
   LastPosTime=0;
   Closed=0;
   CloseTime=0;
}
The following elements are zeroed during reset: the number of open positions PosCnt, the first elements of indicator buffers for the balance and equity BalanceBuffer[1] and EquityBuffer[1], the last position time LastPosTime, the profit of position closed on the same bar Closed and the close time ClosedTime.
Now, let us analyze the main indicator cycle. Below is its full code with comments, followed by a line-by-line analysis:
for(int i=start;i<rates_total;i++){

   // Passing the previously known balance and equity values
   BalanceBuffer[i]=BalanceBuffer[i-1];
   EquityBuffer[i]=EquityBuffer[i-1];

   if(CloseTime!=time[i]){
      // Start of new bar calculation
      Closed=0; // Zeroing the variable for profit
      CloseTime=time[i];
   }

   // Getting data of the tested indicator
   double buy[1],sell[1],buy_target[1],sell_target[1],enter[1];
   int ind=rates_total-i-1+shift;
   if(CopyBuffer(last_handle,0,ind,1,buy)==-1 ||
      CopyBuffer(last_handle,1,ind,1,sell)==-1 ||
      CopyBuffer(last_handle,2,ind,1,buy_target)==-1 ||
      CopyBuffer(last_handle,3,ind,1,sell_target)==-1
   ){
      return(0);
   }

   if(shift==0){
      // If testing is performed on the emerging bar, get the open price
      // from the additional buffer of the tested indicator
      if(CopyBuffer(last_handle,4,ind,1,enter)==-1){
         return(0);
      }
   }
   else{
      // If testing is performed on the completely formed bar, we use
      // the bar open price
      enter[0]=open[i];
   }

   // An arrow for buying
   if(buy[0]!=EMPTY_VALUE){
      AddPos(1,enter[0],buy_target[0],spread[i],time[i],use_target);
   }
   // An arrow for selling
   if(sell[0]!=EMPTY_VALUE){
      AddPos(-1,enter[0],sell_target[0],spread[i],time[i],use_target);
   }

   // Checking, if there is a need to close positions
   CheckClose(i,high,low,close,spread);

   // Balance line
   BalanceBuffer[i]+=Closed;

   // Equity line
   EquityBuffer[i]=BalanceBuffer[i]+SolveEquity(i,close,spread);

}
The balance value is formed from the previously known balance and the profit of closed positions. For this purpose, the previously known balance value is passed from the previous element of the buffer:
// Passing the previously known balance and equity values
BalanceBuffer[i]=BalanceBuffer[i-1];
During the first calculation of each bar, the variable for the profit of positions closed on this bar is reset:
if(CloseTime!=time[i]){
   Closed=0;
   CloseTime=time[i];
}
Data of the tested indicator are copied:
// Getting data of the tested indicator
double buy[1],sell[1],buy_target[1],sell_target[1],enter[1];
int ind=rates_total-i-1+shift;
if(CopyBuffer(last_handle,0,ind,1,buy)==-1 ||
   CopyBuffer(last_handle,1,ind,1,sell)==-1 ||
   CopyBuffer(last_handle,2,ind,1,buy_target)==-1 ||
   CopyBuffer(last_handle,3,ind,1,sell_target)==-1
){
   return(0);
}
Data of buffers with arrows are copied to the 'buy' and 'sell' arrays. Data of target points are copied to 'buy_target' and 'sell_target'. Before copying, the bar index 'ind' is calculated taking into account the shift variable.
Depending on the value of 'shift', the additional buffer is copied or the opening price of the bar is used:
if(shift==0){
   // If testing is performed on the emerging bar, get the open price
   // from the additional buffer of the tested indicator
   if(CopyBuffer(last_handle,4,ind,1,enter)==-1){
      return(0);
   }
}
else{
   // If testing is performed on the completely formed bar, we use
   // the bar open price
   enter[0]=open[i];
}
If arrows are found on the calculated bar, a position is opened by calling the AddPos() function:
// An arrow for buying
if(buy[0]!=EMPTY_VALUE){
   AddPos(1,enter[0],buy_target[0],spread[i],time[i],use_target);
}
// An arrow for selling
if(sell[0]!=EMPTY_VALUE){
   AddPos(-1,enter[0],sell_target[0],spread[i],time[i],use_target);
}
A check whether the position needs to be closed is performed in the CheckClose() function. If a position is closed, the resulting profit is remembered in the Closed variable:
// Checking, if there is a need to close positions
CheckClose(i,high,low,close,spread);
The profit from the Closed variable is added to the balance:
// Balance line
BalanceBuffer[i]+=Closed;
Equity is formed of the balance and the floating profit calculated by the SolveEquity() function:
EquityBuffer[i]=BalanceBuffer[i]+SolveEquity(i,close,spread);
Let us consider the following functions: AddPos(), CheckClose(), SolveEquity(). Below is the code of each function with detailed comments.
AddPos():
void AddPos(int dir, double price,double target,int spread,datetime time,bool use_target){

   if(time<=LastPosTime){
      // A position with the 'time' time has already been added
      return;
   }

   // There is no free space in the array
   if(PosCnt>=ArraySize(Pos)){
      // The array size is increased by a block of 32 elements
      ArrayResize(Pos,ArraySize(Pos)+32);
   }

   // Position direction is saved
   Pos[PosCnt].dir=dir;
   // Position open time
   Pos[PosCnt].time=time;
   // Position open price
   if(dir==1){
      // The ask price for buying
      Pos[PosCnt].price=price+Point()*spread;
   }
   else{
      // The bid price for selling
      Pos[PosCnt].price=price;
   }

   // Stop Loss and Take Profit are calculated
   if(use_target && !FixedSLTP){
      // The target point is used and Stop Loss is calculated
      if(dir==1){
         Pos[PosCnt].tp=target;
         Pos[PosCnt].sl=NormalizeDouble(Pos[PosCnt].price-StopLoss_K*(Pos[PosCnt].tp-Pos[PosCnt].price),Digits());
      }
      else{
         Pos[PosCnt].tp=target+Point()*spread;
         Pos[PosCnt].sl=NormalizeDouble(Pos[PosCnt].price+StopLoss_K*(Pos[PosCnt].price-Pos[PosCnt].tp),Digits());
      }
   }
   else{
      // The StopLoss and TakeProfit variables are used
      if(dir==1){
         Pos[PosCnt].tp=Pos[PosCnt].price+Point()*TakeProfit;
         Pos[PosCnt].sl=Pos[PosCnt].price-Point()*StopLoss;
      }
      else{
         Pos[PosCnt].tp=Pos[PosCnt].price-Point()*TakeProfit;
         Pos[PosCnt].sl=Pos[PosCnt].price+Point()*StopLoss;
      }
   }

   PosCnt++;

}
The CheckClose() function:
void CheckClose(int i,const double & high[],const double & low[],const double & close[],const int & spread[]){
   for(int j=PosCnt-1;j>=0;j--){                                       // All positions
      bool closed=false;                                               // The 'false' value means that the position is still open
      if(Pos[j].dir==1){                                               // Buying
         if(low[i]<=Pos[j].sl){                                        // The price is below or equal to the stop loss
            // Profit in points
            Closed+=(int)((Pos[j].sl-Pos[j].price)/Point());
            closed=true;                                               // The position with the j index has been closed
         }
         else if(high[i]>=Pos[j].tp){                                  // Take profit has been reached
            // Profit in points
            Closed+=(int)((Pos[j].tp-Pos[j].price)/Point());
            closed=true;                                               // The position with the j index has been closed
         }
      }
      else{ // Selling
         if(high[i]+Point()*spread[i]>=Pos[j].sl){                     // Stop loss has been reached
            // Profit in points
            Closed+=(int)((Pos[j].price-Pos[j].sl)/Point());
            closed=true;                                               // The position with the j index has been closed
         }
         else if(low[i]+Point()*spread[i]<=Pos[j].tp){                 // The price is below or equal to the Take Profit
            // Profit in points
            Closed+=(int)((Pos[j].price-Pos[j].tp)/Point());
            closed=true;                                               // The position with the j index has been closed
         }
      }
      // The position has been closed, it should be deleted from the array
      if(closed){
         int ccnt=PosCnt-j-1;
         if(ccnt>0){
            ArrayCopy(Pos,Pos,j,j+1,ccnt);
         }
         PosCnt--;
      }
   }
}
In the CheckClose() function, all positions saved in the Pos array are checked and their Stop Loss and Take Profit values are compared to the current high or low prices. If the position is closed, its profit in points is added to the Closed variable. After that the position is deleted from the array.
SolveEquity():
int SolveEquity(int i,const double & close[],const int & spread[]){
   int rv=0;                                // A variable for the result
   for(int j=PosCnt-1;j>=0;j--){            // All positions
      if(Pos[j].dir==1){                    // Buying
                                            // Profit
         rv+=(int)((close[i]-Pos[j].price)/Point());
      }
      else{                                // Selling
         // Profit
         rv+=(int)((Pos[j].price+Point()*spread[i]-close[i])/Point());
      }
   }
   return(rv);
}
The SolveEquity() function calculates the profit of all open positions from the Pos array taking into account the current Close price.
We have finished analyzing the iTester indicator. The ready-to-use iTester indicator can be found in the attachments. Fig. 17 shows a chart with iHorizontalFormation (arrows) and iTester in a subwindow. The green line shows the equity value, and the red line shows balance.
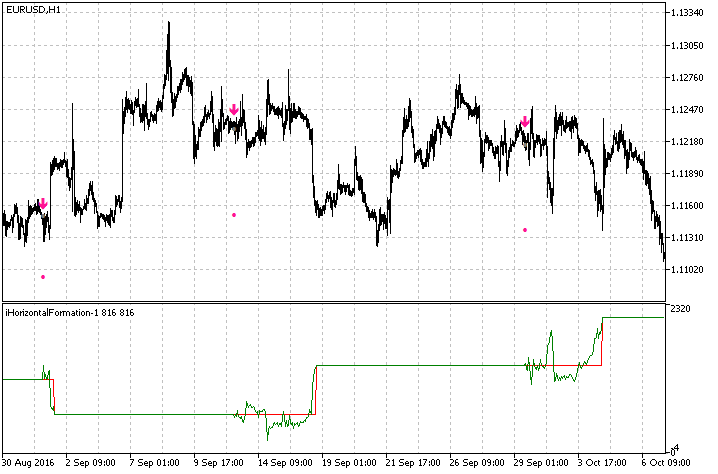
Fig. 17. The iTester indicator (in a subwindow), based on iHorizontalFormation (arrows on the chart)
Conclusion
The pattern detection methods described in the article do solve the initial task, so various shapes, such as flags, pennants, triangles and wedges can be clearly seen on the chart. The methods considered are not the only possible and absolutely correct methods. There can exist other ways to identify the same patterns. For example, you can use linear regression, perform separate calculations using high and low prices, then check the slope and convergence/divergence of these lines. Even more ideas are possible if we deal with individual subtasks, which constitute the common problem of detecting patterns. Nevertheless, the price analysis methods considered while creating indicators in this article, may be useful for other technical analysis related purposes.
Attachments
All the indicators that we have created in the article are attached below, including:
- iHorizontalFormation
- iFlag
- iTester
Translated from Russian by MetaQuotes Ltd.
Original article: https://www.mql5.com/ru/articles/3229
Warning: All rights to these materials are reserved by MetaQuotes Ltd. Copying or reprinting of these materials in whole or in part is prohibited.
This article was written by a user of the site and reflects their personal views. MetaQuotes Ltd is not responsible for the accuracy of the information presented, nor for any consequences resulting from the use of the solutions, strategies or recommendations described.

 Deep Neural Networks (Part II). Working out and selecting predictors
 Creating and testing custom symbols in MetaTrader 5
 Deep Neural Networks (Part I). Preparing Data
- Free trading apps
- Over 8,000 signals for copying
- Economic news for exploring financial markets
You agree to website policy and terms of use
Very good article.
I have always wondered why there is very little interest in automating graphical analysis in the community. Perhaps because of its technical complexity for the majority of algotraders. After all, it is easier to make some formulas and "knock off" pips.
Thank you for your serious work.
I completely agree. Very useful article.
There are patterns here too, and a flag, and a wedge, and a lot more.
And the chicken has wings.
A chicken has wings.
So you're misleading people.
You're getting sawdust in your head.