VolumeDeltaScanner
- Indikatoren
-
Stanislav Korotky
 Trading is just my hobby. I'm working in IT industry. So developement of experts, indicators, and script is not a problem at all to me. Wide range of technologies are used: MQL4, MQL5, system and applied programming, web-services, neural networks and more.
New: - Version: 1.2
- Aktualisiert: 20 Februar 2021
- Aktivierungen: 5
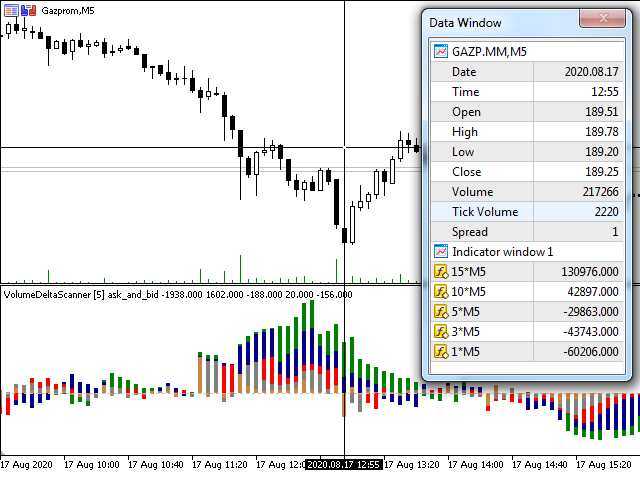
VolumeDeltaScanner ist ein Volumen-Delta-Monitor für mehrere (bis zu 10) Zeitspannen. Es funktioniert durch Online-Ticks oder Geschichte Ticks.
Der Indikator überwacht die Tick-Volumina für Käufe und Verkäufe getrennt, und findet ihr Delta auf jedem Balken und größeren Bereichen, dann zeigt die Volumen-Deltas für alle Bereiche. Jeder Bereich wird durch einen eigenen Puffer/Linie dargestellt.
Der kleinste Bereich ist der aktuelle Zeitrahmen. Er ist obligatorisch. Alle anderen Bereiche sollten ein Vielfaches davon sein. Wenn es zum Beispiel auf einem M5-Chart platziert wird, kann es Volumen-Deltas für 1*M5, 3*M5, 5*M5, 10*M5 usw. berechnen.
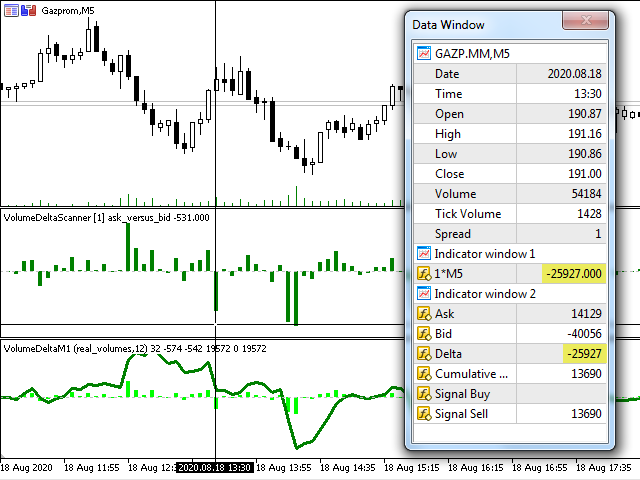
Es arbeitet mit realen Volumina, wenn diese verfügbar sind, ansonsten mit Tick-Volumina.
Um es im Tester zu verwenden, stellen Sie bitte sicher, dass der Modus "Real Ticks " aktiviert ist.
Eingabeparameter
- Scope 1 - Scope 10 - Koeffizienten, die die Scope-Dauer als ein Vielfaches des aktuellen Zeitrahmens definieren;
- TickHistoryPreload - Anzahl der historischen Balken, die beim Start mit Ticks gefüllt werden sollen; die Ticks werden immer in Stapeln pro Tag verarbeitet, so dass mehr Balken aufgrund der Ausrichtung auf den Tagesbeginn berechnet werden können; Standardwert 0 bedeutet, dass ein einzelner letzter Tag vorgeladen wird;
- Methode - eine von 2 Methoden der Tick-Kategorisierung für Kauf und Verkauf: ask_versus_bid oder ask_and_bid; bei ask_versus_bid werden die Volumina als Kauf betrachtet, wenn der Ask-Kurs steigt, und als Verkauf, wenn der Bid-Kurs sinkt; ask_and_bid analysiert die Änderungen der Summe von Ask und Bid;
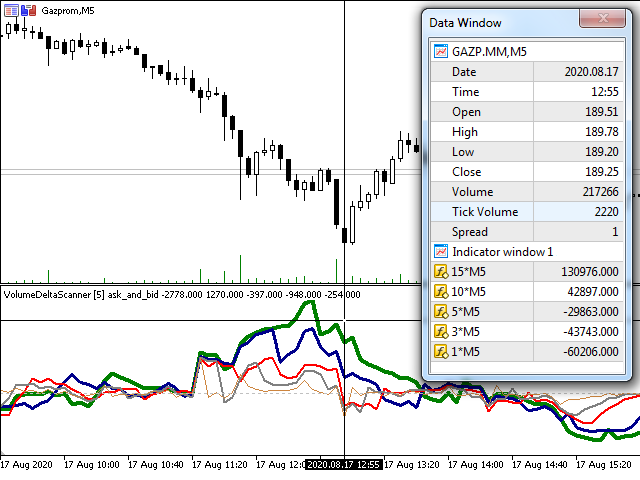
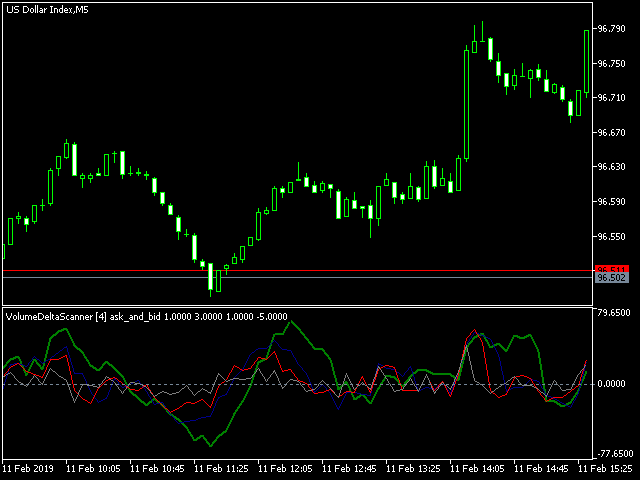
- Visualisierung - Anzeige von Puffern als Linien, Histogramm oder Punkte;
Wie man handelt
- Finden Sie Divergenzen in Preis und Volumen;
- Während der Preis konsolidiert ist, erkennen Sie, welche Seite (positiv oder negativ) des Volumen-Deltas vorherrschend wird;
- Verwenden Sie sich kreuzende Linien mit kleinerem und größerem Umfang in ähnlicher Weise wie "schnelle" und "langsame" MA-Kreuzungen;