VolumeDeltaScanner

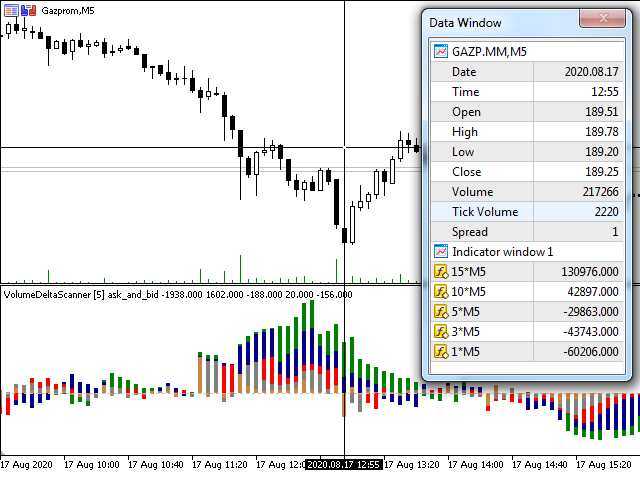
VolumeDeltaScanner is a volume delta monitor for multiple (up to 10) time scopes. It works by online ticks or history ticks.

Indicator monitors tick volumes for buys and sells separately, and find their delta on every bar and larger scopes, then displays the volume deltas for all the scopes. Every scope is presented by its own buffer/line.

The smallest scope is the current timeframe. It's required. All other scopes should be multiples of it. For example, if placed on a M5 chart, it can calculate volume deltas for 1*M5, 3*M5, 5*M5, 10*M5, etc.

It works with real volumes if they are available, otherwise with tick volumes.

To use in the tester, please, make sure the real ticks mode is enabled.

Input parameters

  • Scope 1 - Scope 10 coefficients defining scope duration as a multiple of current timeframe;
  • TickHistoryPreload number of historical bars to populate with ticks on startup; the ticks are always processed in batches by day, so more bars can be calculated due to alignment to the start of the day; default 0 means a single last day is preloaded;
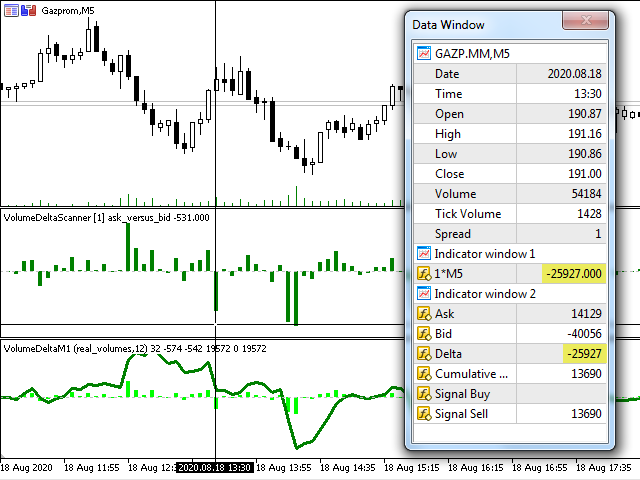
  • Method one of 2 methods of tick categorization for buy and sell: ask_versus_bid, or ask_and_bid; when set to ask_versus_bid, the volumes are considered for buy if Ask price increases, and considered for sell if Bid decreases; ask_and_bid analyses the changes in the sum of Ask and Bid;
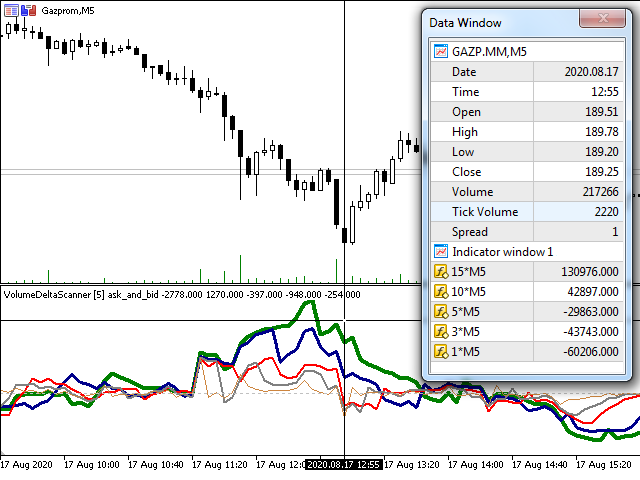
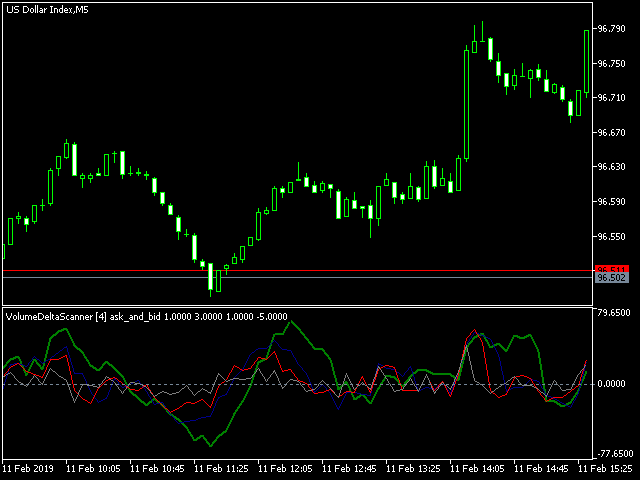
  • Visualization display buffers as Lines, Histogram of Dots;

How to trade

  • Find divergences in price and volume;
  • While price is consolidated, spot which side (positive or negative) of volume deltas becomes prevailing;
  • Use crossing lines of smaller and higher scopes in a similar way as "fast" and "slow" MA crossing;


Recommended timeframes: intraday.


Prodotti consigliati
Was: $249  Now: $99   Market Profile defines a number of day types that can help the trader to determine market behaviour. A key feature is the Value Area, representing the range of price action where 70% of trading took place. Understanding the Value Area can give traders valuable insight into market direction and establish the higher odds trade. It is an excellent addition to any system you may be using. Inspired by Jim Dalton’s book “Mind Over Markets”, this indicator is designed to suit the
TRI Visualizer
Yoshimi Mon 三 Ura
TRI Visualizer MT5 – Thermodynamic Market Analysis Overview The TRI (Thermal Range Indicator) Visualizer Enhanced is a rare market analysis indicator that goes beyond conventional technical analysis, applying principles of thermodynamics from physics. It interprets market price fluctuations as “thermodynamic energy,” enabling the highly accurate detection of subtle market changes that are often overlooked. Innovative Mechanisms 1. Dual Calculation Engines Classic TRI Mode Formula: |Close
BoxChart MT5
Evgeny Shevtsov
5 (7)
The market is unfair if only because 10% of participants manage 90% of funds. An ordinary trader has slim changes to stand against these "vultures". This problem can be solved. You just need to be among these 10%, learn to predict their intentions and move with them. Volume is the only preemptive factor that faultlessly works on any timeframe and symbol. First, the volume appears and is accumulated, and only then the price moves. The price moves from one volume to another. Areas of volume accumu
Max Min Delta Indicator - Market Volume Imbalance Analysis Gain Deeper Insights into Market Volume Imbalance with Delta Analysis What is the Max Min Delta Indicator? The Max Min Delta Indicator is a powerful market volume analysis tool that visually represents maximum and minimum delta values using a histogram. It helps traders identify market strength, weakness, absorption, and aggressive buying/selling activity with precision. Key Features Histogram Visualization: Displays Max Delta (Green) an
This Volume Delta Profile is an advanced MetaTrader 5 indicator that visualizes   volume delta (order flow imbalance)   using a volume profile-style histogram. It shows the difference between buying and selling pressure at specific price levels, helping traders identify supply and demand zones. This indicator provides a unique perspective on market dynamics by visualizing the imbalance between buying and selling pressure, offering insights beyond traditional volume analysis. Core Concept Positiv
The Super Arrow Indicator provides non-repainting buy and sell signals with exceptional accuracy. Key Features No repainting – confirmed signals remain fixed Clear visual arrows: green for buy, red for sell Real-time alerts via pop-up, sound, and optional email Clean chart view with no unnecessary clutter Works on all markets: Forex, gold, oil, indices, crypto Adjustable Parameters TimeFrame Default:   "current time frame" Function:   Sets the time frame for indicator calculation Options:   Can
Il livello Premium è un indicatore unico con una precisione superiore all'80% delle previsioni corrette! Questo indicatore è stato testato dai migliori Specialisti di Trading per più di due mesi! L'indicatore dell'autore che non troverai da nessun'altra parte! Dagli screenshot puoi vedere di persona la precisione di questo strumento! 1 è ottimo per il trading di opzioni binarie con un tempo di scadenza di 1 candela. 2 funziona su tutte le coppie di valute, azioni, materie prime, criptovalu
This indicator allows you to enjoy the two most popular products for analyzing request volumes and market deals at a favorable price: Actual Depth of Market Chart Actual Tick Footprint Volume Chart This product combines the power of both indicators and is provided as a single file. The functionality of Actual COMBO Depth of Market AND Tick Volume Chart is fully identical to the original indicators. You will enjoy the power of these two products combined into the single super-indicator! Below is
Crash 1000 Scalping Indicator for the Crash 1000 Deriv Synthetic Index. Introduction The Crash 1000 Scalping Indicator is a specialized tool designed for the Crash 1000 index on the Deriv Synthetic market. This indicator is particularly useful for scalping on the M1 timeframe, helping traders to identify precise entry and exit points for buy positions. It is designed to be non-repainting, providing clear signals with audible alerts and push notifications, and is compatible with mobile devices th
L'indicatore costruisce le quotazioni attuali, che possono essere confrontate con quelle storiche e su questa base fanno una previsione del movimento dei prezzi. L'indicatore ha un campo di testo per una rapida navigazione fino alla data desiderata. Opzioni: Simbolo - selezione del simbolo che visualizzerà l'indicatore; SymbolPeriod - selezione del periodo da cui l'indicatore prenderà i dati; IndicatorColor - colore dell'indicatore; HorisontalShift - spostamento delle virgolette disegnate d
MR Volume Profile 5
Sergey Khramchenkov
The "MR Volume Profile 5" indicator is a charting tool that displays trading volume at different price levels rather than time intervals. A key concept in volume profile is the point of control (POC)—the price level with the highest volume traded during the session or time range. While tools like VWAP or OBV provide volume trends, the "MR Volume Profile 5" indicator offers granular detail about where the most market activity occurs at specific price levels. This makes it a more precise tool for
Trend Master V2
Oratile Pitsoane
What Is Trend Master Pro? Trend Master Pro   is a professional-grade trend trading indicator built for MetaTrader 5. It was designed with one goal in mind — to keep you on the right side of the market at all times by combining three powerful technical tools into a single, clean, easy-to-read display directly on your price chart. Instead of cluttering your screen with multiple separate indicators, Trend Master Pro fuses an   EMA Ribbon trend filter , a   ZigZag swing point engine , and a   breako
PivotWave
Jeffrey Quiatchon
Introducing PivotWave – your ultimate trading companion that redefines precision and market analysis. Designed with traders in mind, PivotWave is more than just an indicator; it’s a powerful tool that captures the pulse of the market, identifying key turning points and trends with pinpoint accuracy. PivotWave leverages advanced algorithms to provide clear visual signals for optimal entry and exit points, making it easier for traders to navigate volatile market conditions. Whether you are a begin
Noize Absorption Index - is the manual trading system that measures the difference of pressure between bears forces and bulls forces. Green line - is a noize free index that showing curent situation. Zero value of index shows totally choppy/flat market.Values above zero level shows how powerfull bullish wave is and values below zero measures bearish forces.Up arrow appears on bearish market when it's ready to reverse, dn arrow appears on weak bullish market, as a result of reverse expectation.
Harmonic Pattern Structure Harmonic Pattern Structure is a professional MetaTrader 5 indicator that automatically detects classic harmonic patterns using strict Fibonacci ratio validation and XABCD price structure. Designed for traders who value precision, clean visuals, and structured analysis, the indicator highlights potential reversal zones based on price geometry, supporting consistent and objective decision-making. SUPPORTED HARMONIC PATTERNS Gartley (222) Butterfly Bat Crab Shark Cy
L'indicateur SMC Venom Model BPR est un outil professionnel pour les traders travaillant dans le concept Smart Money (SMC). Il identifie automatiquement deux modèles clés sur le graphique des prix: FVG   (Fair Value Gap) est une combinaison de trois bougies, dans laquelle il y a un écart entre la première et la troisième bougie. Forme une zone entre les niveaux où il n'y a pas de support de volume, ce qui conduit souvent à une correction des prix. BPR   (Balanced Price Range) est une combinaiso
Strumento Avanzato di Analisi del Profilo dei Volumi per MetaTrader 5 Il Kecia Volume Profile Order Finder offre ai trader funzionalità di analisi del profilo dei volumi. Questo indicatore per MT5 combina la visualizzazione del profilo dei volumi con calcoli statistici per aiutare a identificare potenziali opportunità di trading e suggerisce livelli di entrata, stop loss e take profit basati sulla struttura del mercato. Visualizzazione del Profilo di Mercato Trasforma il tuo grafico con visualiz
Trade smarter, not harder: Empower your trading with Harmonacci Patterns This is arguably the most complete harmonic price formation auto-recognition indicator you can find for the MetaTrader Platform. It detects 19 different patterns, takes fibonacci projections as seriously as you do, displays the Potential Reversal Zone (PRZ) and finds suitable stop-loss and take-profit levels. [ Installation Guide | Update Guide | Troubleshooting | FAQ | All Products  ] It detects 19 different harmonic pric
Cumulative Volume Delta (CVD) MA-X: Strumento Intelligente di Sentiment per l'Order Flow Sblocca i meccanismi nascosti del mercato con il Cumulative Volume Delta (CVD) MA-X . Mentre gli indicatori di volume standard ti dicono solo quanto è stato scambiato, il CVD MA-X ti dice CHI sta vincendo la battaglia tra compratori e venditori e QUANDO . Aggregando l'azione del prezzo a livello di tick e la distribuzione del volume, questo indicatore fornisce una mappa cristallina della convinzione e dell'
Volume Profile V6
Andrey Kolesnik
4.8 (5)
Market Volume Profile indicator + Smart Oscillator. Funziona su quasi tutti gli strumenti — coppie di valute, azioni, futures, criptovalute — utilizzando sia volumi reali che volumi tick. È possibile impostare l’intervallo del profilo automaticamente (ad esempio una settimana, un mese, ecc.) oppure manualmente spostando i limiti (due linee verticali: rossa e blu). Viene visualizzato sotto forma di istogramma. La larghezza dell’istogramma a un determinato livello rappresenta, in modo approssimati
Hi Traders, MTF FVGs (Extend) – Smart Supply & Demand Zones. This indicator automatically identifies bullish (demand) and bearish (supply) FVG zones on your chart using multi-timeframe analysis. Zones are displayed as rectangles with optional midlines, helping you visualize key support and resistance levels more clearly. Key Features: Multi-timeframe support: detect zones on the current or higher timeframe Adjustable lookback period and minimum zone size Limit the number of visible bullish and
ALIEN Dashboard
Youssef Esseghaiar
ALIEN DASHBOARD FULL EDITION – Professional ICT & Precision Trading Dashboard for MT5 ( HYBRID ENGINE ) Overview The   Alien Dashboard Full Edition   is a comprehensive, all‑in‑one technical indicator for MetaTrader 5 that merges the most powerful concepts from Inner Circle Trader (ICT) methodology with advanced precision‑entry logic, multi‑timeframe analysis, and an intuitive on‑chart dashboard. Designed for serious traders who want to visualise institutional order flow, identify high‑probabili
L'indicatore DYJ BoS identifica e contrassegna automaticamente gli elementi essenziali dei cambiamenti nella struttura del mercato, tra cui: Breakout of Structure (BoS): rilevato quando il prezzo effettua una mossa significativa, rompendo un precedente punto di struttura. Segna possibili linee di tendenza al rialzo e al ribasso (UP e DN, ovvero nuovi massimi e nuovi minimi continui) e una volta che il prezzo sfonda queste linee, segna frecce rosse (ORSO) e verdi (TORO) Il BoS si verifica sol
Volume Delta Candle
Muhammad Muzaffar Hussan
Volume Delta Candles: A Comprehensive Tool for In-Depth Trading Analysis Unlock a seamless way to interpret trading experience within each candle. With Volume Delta Candles, there's no need for additional volume indicators—everything you need is built in. This advanced tool utilizes lower timeframes or live market data to present the percentage of buying versus selling volume within each candle as an intuitive color-coded bar. Before diving in, ensure you’re familiar with Volume and Volume Delta
Infinity Liquidity AI - Premium MT5 Liquidity & Smart Money Indicator Limited Launch Price - Early Buyers Get the Best Deal Infinity Liquidity AI is now available with a limited early-buyer launch price. This is a premium high-quality MT5 indicator, and the price will increase step by step as more traders purchase it. First 2 buyers get it for only $39. Next 4 buyers get it for $49. Next 10 buyers get it for $50. After that, the price will increase by $10 after every 15 buyers until it reache
Visual Crocodile Pulse Indicator
AL MOOSAWI ABDULLAH JAFFER BAQER
Visual Crocodile Pulse Indicator Unlock the Market's True Momentum and Trade with Confidence Are you tired of lagging indicators and noisy charts that lead to false signals? The Visual Crocodile Pulse Indicator is a sophisticated, professional-grade trend analysis tool designed to give you a clear and decisive edge. By cutting through market noise, it identifies the powerful beginnings of new trends, helping you enter trades with higher precision and avoid choppy, unpredictable conditions. For
RBreaker
Zhong Long Wu
RBreaker Gold Indicators is a short-term intraday trading strategy for gold futures that combines trend following and intraday reversal approaches. It not only captures profits during trending markets but also enables timely profit-taking and counter-trend trading during market reversals. This strategy has been ranked among the top ten most profitable trading strategies by the American magazine   Futures Truth   for 15 consecutive years. It boasts a long lifecycle and remains widely used and st
# DRAWDOWN INDICATOR V4.0 - The Essential Tool to Master Your Trading ## Transform Your Trading with a Complete Real-Time Performance Overview In the demanding world of Forex and CFD trading, **knowing your real-time performance** isn't a luxury—it's an **absolute necessity**. The **Drawdown Indicator V4.0** is much more than a simple indicator: it's your **professional dashboard** that gives you a clear, precise, and instant view of your trading account status. --- ## Why This Indicator
##   ONLY GOLD ##   Тiльки Золото ## **Mercaria Professional Trading Zones - Complete Guide** ## **Mercaria Professional Trading Zones - Повний посібник** ### **How Mercaria Zones Work / Як працюють зони Mercaria** **English:** Mercaria Zones is an advanced trading indicator that identifies high-probability support and resistance areas using ZigZag extremes combined with mathematical zone calculations. The indicator works on multiple timeframes simultaneously, providing a comprehensive view
Pro Gold System Indicator
PEDRO JOAQUIM GONCALVES GOMES
ADVANCED FUNCTIONALITIES: Trend Score (0-100) with visual bar Intelligent signals with adjustable strength (1-10) Risk management with automatic TP/SL Audible and visual alerts Price zones with smooth filling Multi-indicator analysis (RSI, ATR, BB, EMAs) DESIGN FEATURES Modern Visual: Smooth and well-spaced lines (EMA with 2-3px width) Vibrant and professional colors (Sky Blue, Orange, Gold) Modern arrows (code 233/234) for buy/sell signals Configurable dark/light theme Adjustable transparency f
Gli utenti di questo prodotto hanno anche acquistato
SuperScalp Pro
Van Minh Nguyen
4.63 (24)
SuperScalp Pro – Sistema avanzato di indicatore scalping multi-filtro SuperScalp Pro è un indicatore di scalping avanzato che combina il classico Supertrend con molteplici filtri intelligenti di conferma per aiutare a identificare opportunità di trading. Funziona in modo efficiente su diversi timeframe da M1 a H4, con prestazioni ottimizzate su XAUUSD, BTCUSD e principali coppie Forex. L’indicatore fornisce chiari segnali Buy e Sell, insieme a livelli di ingresso, stop loss e take profit calcola
Divergence Bomber
Ihor Otkydach
4.9 (89)
Ogni acquirente dell’indicatore riceverà inoltre gratuitamente: L’utilità esclusiva “Bomber Utility”, che gestisce automaticamente ogni operazione, imposta i livelli di Stop Loss e Take Profit e chiude le posizioni secondo le regole della strategia I file di configurazione (set file) per adattare l’indicatore a diversi asset I set file per configurare il Bomber Utility in tre modalità: “Rischio Minimo”, “Rischio Bilanciato” e “Strategia di Attesa” Una guida video passo-passo per installare, conf
Entry In The Zone and SMC Multi Timeframe is a real-time 2-in-1 market analysis tool that combines market structure analysis and a No Repaint BUY / SELL signal system into a single indicator, built on Smart Money Concepts (SMC) — a widely adopted framework used by professional traders to understand market structure. This indicator helps you see the market more clearly, make decisions based on structure rather than guesswork, and focus on high-probability zones where price is more likely to react
SignalTech MT5 is an unique fully rule based trading system for EURUSD, USDCHF, USDJPY, AUDUSD, NZDUSD, EURJPY, AUDJPY, NZDJPY, CADJPY.  All the winning trades with chart setups are published on the comments page. 2026-05 3458 Pips (Until 05-20 NY Closed) 2026-04 2243 Pips 2026-03 2165 Pips 2026-02 2937 Pips 2026-01 2624 Pips 2025-12 1174 Pips It can generate signals with Buy/Sell Arrows and Pop-Up/Sound Alerts. Each signal has clear Entry and Stop Loss levels, which should be automatically flag
Azimuth Pro
Ottaviano De Cicco
5 (7)
Azimuth Pro V2: Synthetic Fractal Structure and Confirmed Entries for MT5 Overview Azimuth Pro is a multi-level swing structure indicator by Merkava Labs . Four nested swing layers, swing-anchored VWAP, ABC pattern detection, three-timeframe structural filtering, and closed-bar confirmed entries — one chart, one workflow from micro-swings to macro-cycles. This is not a blind signal product. It is a structure-first workflow for traders who care about location, context, and timing. V2 Launch Offe
Power Candles MT5
Daniel Stein
5 (8)
Power Candles V3 - Indicatore di forza ad ottimizzazione automatica Power Candles V3 trasforma la forza delle valute e degli strumenti in un piano di trading attuabile su ogni grafico a cui è collegato. Invece di limitarsi a colorare le candele, esegue un'auto-ottimizzazione in tempo reale in background e ti fornisce i migliori valori di Stop Loss, Take Profit e soglia di segnale per il simbolo che hai davanti. Basta un clic per adottarlo nel trading live: i raggi di ingresso, Stop Loss e Take P
ARIPoint
Temirlan Kdyrkhan
1 (1)
ARIPoint is a powerful trading companion designed to generate high-probability entry signals with dynamic TP/SL/DP levels based on volatility. Built-in performance tracking shows win/loss stats, PP1/PP2 hits, and success rates all updated live. Key Features: Buy/Sell signals with adaptive volatility bands Real-time TP/SL/DP levels based on ATR Built-in MA Filter with optional ATR/StdDev volatility Performance stats panel (Success, Profit/Loss, PP1/PP2) Alerts via popup, sound, push, or email Cu
Gann Made Easy è un sistema di trading Forex professionale e facile da usare che si basa sui migliori principi del trading utilizzando la teoria di mr. WD Gann. L'indicatore fornisce segnali ACQUISTA e VENDI accurati, inclusi i livelli di Stop Loss e Take Profit. Puoi fare trading anche in movimento utilizzando le notifiche PUSH. CONTATTAMI DOPO L'ACQUISTO PER RICEVERE GRATUITAMENTE LE ISTRUZIONI DI TRADING E OTTIMI INDICATORI EXTRA! Probabilmente hai già sentito parlare molte volte dei metodi d
FX Trend MT5 NG
Daniel Stein
5 (4)
FX Trend NG: La Nuova Generazione di Intelligenza di Trend Multi-Mercato Panoramica FX Trend NG è uno strumento professionale di analisi del trend multi-timeframe e monitoraggio dei mercati. Ti consente di comprendere la struttura completa del mercato in pochi secondi. Invece di passare tra numerosi grafici, puoi identificare immediatamente quali strumenti sono in trend, dove il momentum sta diminuendo e dove esiste un forte allineamento tra i timeframe. Offerta di Lancio – Ottieni FX Trend NG
Se acquisti questo indicatore, riceverai il mio Trade Manager Professionale + EA  GRATUITAMENTE. Innanzitutto è importante sottolineare che questo sistema di trading è un indicatore Non-Repainting, Non-Redrawing e Non-Lagging, il che lo rende ideale sia per il trading manuale che per quello automatico. Corso online, manuale e download di preset. Il "Sistema di Trading Smart Trend MT5" è una soluzione completa pensata sia per i trader principianti che per quelli esperti. Combina oltre 10 indicat
Trend Screener Pro MT5
STE S.S.COMPANY
4.85 (104)
Indicatore di tendenza, soluzione unica rivoluzionaria per il trading di tendenze e il filtraggio con tutte le importanti funzionalità di tendenza integrate in un unico strumento! È un indicatore multi-timeframe e multi-valuta al 100% non ridipingibile che può essere utilizzato su tutti i simboli/strumenti: forex, materie prime, criptovalute, indici e azioni. Trend Screener è un indicatore di tendenza che segue un indicatore efficiente che fornisce segnali di tendenza a freccia con punti nel gra
KT Alpha Hunter Arrows MT5
KEENBASE SOFTWARE SOLUTIONS
La maggior parte degli indicatori a frecce ti dà un segnale e poi ti lascia capire da solo tutto il resto. KT Alpha Hunter Arrows ti offre un piano di trading completo. Ogni freccia di segnale appare con un piano completo già disegnato: linea di ingresso, stop loss, quattro livelli di take profit e un verdetto live sull’edge, che ti indica se quel simbolo e quel timeframe meritano davvero di essere tradati in quel momento. Il Trade Manager EA incluso gestisce l’esecuzione dopo il tuo ingresso, c
FX Power MT5 NG
Daniel Stein
5 (31)
FX Power: Analizza la Forza delle Valute per Decisioni di Trading Più Intelligenti Panoramica FX Power è lo strumento essenziale per comprendere la reale forza delle principali valute e dell'oro in qualsiasi condizione di mercato. Identificando le valute forti da comprare e quelle deboli da vendere, FX Power semplifica le decisioni di trading e rivela opportunità ad alta probabilità. Che tu segua le tendenze o anticipi inversioni utilizzando valori estremi di Delta, questo strumento si adatta
Presentazione       Quantum Breakout PRO   , l'innovativo indicatore MQL5 che sta trasformando il modo in cui scambi le zone di breakout! Sviluppato da un team di trader esperti con un'esperienza di trading di oltre 13 anni,       Quantum Breakout PRO       è progettato per spingere il tuo viaggio di trading a nuovi livelli con la sua strategia innovativa e dinamica della zona di breakout. Quantum Breakout Indicator ti fornirà frecce di segnalazione sulle zone di breakout con 5 zone target di
Gem SIGNAL
Shengzu Zhong
5 (1)
GEM Signal Pro GEM Signal Pro è un indicatore trend-following per MetaTrader 5, progettato per i trader che desiderano segnali più chiari, configurazioni operative più strutturate e una gestione del rischio più pratica direttamente sul grafico. Invece di mostrare solo una semplice freccia, GEM Signal Pro aiuta a presentare l’intera idea di trading in modo più chiaro e leggibile. Quando le condizioni sono confermate, l’indicatore può mostrare sul grafico il prezzo di ingresso, lo stop loss e gli
Trend Forecaster
Alexey Minkov
5 (7)
Trend Forecaster – Since 2023. The Trend Forecaster indicator utilizes a unique proprietary algorithm to determine entry points for a breakout trading strategy. The indicator identifies price clusters, analyzes price movement near levels, and provides a signal when the price breaks through a level. The Trend Forecaster indicator is suitable for all financial assets, including currencies (Forex), metals, stocks, indices, and cryptocurrencies. You can also adjust the indicator to work on any time
Btmm state engine pro
Garry James Goodchild
5 (4)
BTMM State Engine Pro is a MetaTrader 5 indicator for traders who use the Beat The Market Maker approach: Asian session context, kill zone timing, level progression, peak formation detection, and a multi-pair scanner from a single chart. It combines cycle state logic with a built-in scanner dashboard so you do not need the same tool on many charts at once. What it does Draws the Asian session range; session times can follow broker server offset or be set in inputs. Tracks level progression (L
Atomic Analyst MT5
Issam Kassas
3.94 (31)
Innanzitutto, vale la pena sottolineare che questo indicatore di trading non è repaint, non è ridisegno e non presenta ritardi, il che lo rende ideale sia per il trading manuale che per quello automatico. Manuale utente: impostazioni, input e strategia. L'Analista Atomico è un indicatore di azione del prezzo PA che utilizza la forza e il momentum del prezzo per trovare un miglior vantaggio sul mercato. Dotato di filtri avanzati che aiutano a rimuovere rumori e segnali falsi, e aumentare il pote
Questo cruscotto mostra gli ultimi   pattern armonici   disponibili per i simboli selezionati, in modo da risparmiare tempo ed essere più efficienti /   versione MT4 . Indicatore gratuito:   Basic Harmonic Pattern Colonne dell'indicatore Symbol :   vengono visualizzati i simboli selezionati Trend:   rialzista o ribassista Pattern:   tipo di pattern (gartley, butterfly, bat, crab, shark, cypher o ABCD) Entry:   prezzo di ingresso SL:   prezzo di stop loss TP1:   1 prezzo di take profit TP2:
OrderFlux | Footprint Orderflow per MetaTrader 5 Versione 2.0 – Visualizzazione Bid/Ask in tempo reale per Trader Attivi OrderFlux è un indicatore di footprint e orderflow per MT5. Non mostra solo dove si è mosso il prezzo, ma cosa succede all'interno del movimento: volume Bid/Ask per livello di prezzo, delta, imbalance e distribuzione del volume. Molti grafici ti mostrano solo il risultato finale di una candela. OrderFlux ti mostra il percorso per arrivarci. Questo è esattamente ciò che aiuta q
Quantum TrendPulse
Bogdan Ion Puscasu
5 (25)
Ecco   Quantum TrendPulse   , lo strumento di trading definitivo che combina la potenza di   SuperTrend   ,   RSI   e   Stocastico   in un unico indicatore completo per massimizzare il tuo potenziale di trading. Progettato per i trader che cercano precisione ed efficienza, questo indicatore ti aiuta a identificare con sicurezza le tendenze di mercato, i cambiamenti di momentum e i punti di entrata e uscita ottimali. Caratteristiche principali: Integrazione SuperTrend:   segui facilmente l'andame
RelicusRoad Pro MT5
Relicus LLC
4.96 (24)
RelicusRoad Pro: Sistema Operativo Quantitativo di Mercato 70% DI SCONTO ACCESSO A VITA (TEMPO LIMITATO) - UNISCITI A 2.000+ TRADER Perché la maggior parte dei trader fallisce anche con indicatori "perfetti"? Perché operano su Singoli Concetti isolati. Un segnale senza contesto è una scommessa. Per vincere serve CONFLUENZA . RelicusRoad Pro non è un semplice indicatore. È un Ecosistema Quantitativo completo . Mappa la "Fair Value Road", distinguendo tra rumore e rotture strutturali. Smetti di in
Grabber System MT5
Ihor Otkydach
4.83 (23)
Ti presento un eccellente indicatore tecnico: Grabber, che funziona come una strategia di trading "tutto incluso", pronta all’uso. In un solo codice sono integrati strumenti potenti per l’analisi tecnica del mercato, segnali di trading (frecce), funzioni di allerta e notifiche push. Ogni acquirente di questo indicatore riceve anche gratuitamente: L’utility Grabber: per la gestione automatica degli ordini aperti Video tutorial passo dopo passo: per imparare a installare, configurare e utilizzare
Innanzitutto, vale la pena sottolineare che questo Strumento di Trading è un Indicatore Non-Ridipingente, Non-Ridisegnante e Non-Laggante, il che lo rende ideale per il trading professionale. Corso online, manuale utente e demo. L'Indicatore Smart Price Action Concepts è uno strumento molto potente sia per i nuovi che per i trader esperti. Racchiude più di 20 utili indicatori in uno solo, combinando idee di trading avanzate come l'Analisi del Trader del Circolo Interno e le Strategie di Tradin
Trend Lines PRO MT5
Roman Podpora
5 (1)
LINEE DI TENDENZA PRO  Aiuta a capire dove il mercato sta realmente cambiando direzione. L'indicatore mostra reali inversioni di tendenza e punti in cui i principali operatori rientrano. Vedi   Linee BOS   Cambiamenti di tendenza e livelli chiave su timeframe più ampi, senza impostazioni complesse o rumore inutile. I segnali non vengono ridisegnati e rimangono sul grafico dopo la chiusura della barra. VERSIONE MT4   -   Svela il suo massimo potenziale se abbinato all'indicatore   RFI LEVELS PRO
RFI levels PRO MT5
Roman Podpora
3.67 (3)
L'indicatore mostra accuratamente i punti di inversione e le zone di ritorno dei prezzi in cui il       Principali attori   . Vedi dove si formano le nuove tendenze e prendi decisioni con la massima precisione, mantenendo il controllo su ogni operazione. VERSION MT4     -    Rivela il suo massimo potenziale se combinato con l'indicatore   TREND LINES PRO Cosa mostra l'indicatore: Strutture di inversione e livelli di inversione con attivazione all'inizio di un nuovo trend. Visualizzazione dei li
Meridian Pro
Ottaviano De Cicco
5 (2)
Meridian Pro 2.00: Professional Multi-Timeframe Trend Matrix for MT5 Meridian Pro 2.00 is a professional adaptive trend matrix for MetaTrader 5. It combines the original Meridian trend engine, a clean chart ribbon, closed-bar signal arrows, an 8-timeframe dashboard, Fuel momentum, weighted consensus, synthetic HTF processing and chart-native higher-timeframe context lines. The goal is simple: read current trend, multi-timeframe structure, strength, momentum and EA-ready state from one discipline
Reversal Master for MT5 Reversal Master for MT5 is a non‑repainting reversal indicator for MetaTrader 5. It helps you detect potential market reversal points and shows the maximum favourable price movement after each historical signal, so you can better understand how price behaved after similar situations in the past. The MT5 version keeps the familiar reversal‑signal logic of the original Reversal Master for MT4, but adds improved visualisation, historical statistics and a points summary panel
Blahtech Supply Demand MT5
Blahtech Limited
4.54 (13)
Was: $299  Now: $99  Supply Demand uses previous price action to identify potential imbalances between buyers and sellers. The key is to identify the better odds zones, not just the untouched ones. Blahtech Supply Demand indicator delivers functionality previously unavailable on any trading platform. This 4-in-1 indicator not only highlights the higher probability zones using a multi-criteria strength engine, but also combines it with multi-timeframe trend analysis, previously confirmed swings a
PZ Trend Trading MT5
PZ TRADING SLU
3.8 (5)
Capture every opportunity: your go-to indicator for profitable trend trading Trend Trading is an indicator designed to profit as much as possible from trends taking place in the market, by timing pullbacks and breakouts. It finds trading opportunities by analyzing what the price is doing during established trends. [ Installation Guide | Update Guide | Troubleshooting | FAQ | All Products ] Trade financial markets with confidence and efficiency Profit from established trends without getting whips
Altri dall’autore
WalkForwardOptimizer MT5
Stanislav Korotky
3.78 (9)
WalkForwardOptimizer library allows you to perform rolling and cluster walk-forward optimization of expert advisers (EA) in MetaTrader 5. To use the library include its header file WalkForwardOptimizer.mqh into your EA source code, add call provided functions as appropriate. Once the library is embedded into EA, you may start optimization according to the procedure described in the User guide . When it's finished, intermediate results are saved into a CSV file and some special global variables.
RenkoFromRealTicks
Stanislav Korotky
4.67 (3)
This non-trading expert utilizes so called custom symbols feature ( available in MQL API as well) to build renko charts based on history of real ticks of selected standard symbol. RenkoFromRealTicks generates custom symbol quotes, thus you may open many charts to apply different EAs and indicators to the renko. It also transmits real ticks to update renko charts in real time. The generated renko chart uses M1 timeframe. It makes no sense to switch the renko chart to a timeframe other than M1. T
SyntheticIndices
Stanislav Korotky
The indicator compares quotes of a given symbol and a synthetic quote calculated from two specified referential symbols. The indicator is useful for checking Forex symbol behavior via corresponding stock indices and detecting their convergence/divergence which can forecast future price movements. The main idea is that all stock indices are quoted in particular currencies and therefore demonstrate correlation with Forex pairs where these currencies are used. When market makers decide to "buy" one
ADXS
Stanislav Korotky
5 (3)
Ever wondered why standard ADX is made unsigned and what if it would be kept signed? This indicator gives the answer, which allows you to trade more efficient. This indicator calculates ADX values using standard formulae, but excludes operation of taking the module of ADX values, which is forcedly added into ADX for some reason. In other words, the indicator preserves natural signs of ADX values, which makes it more consistent, easy to use, and gives signals earlier than standard ADX. Strictly s
AutomaticZigZag
Stanislav Korotky
4.5 (2)
This is a non-parametric ZigZag providing 4 different methods of calculation. Upward edge continues on new bars while their `highs` are above highest `low` among previous bars, downward edge continues on next bars while their `lows` are below lowest `high` among previous; Gann swing: upward edge continues while `highs` and `lows` are higher than on the left adjacent bar, downward edge continues while `highs` and `lows` are lower than on the left adjacent bar. Inside bars (with lower `high` and
FREE
CustomVolumeDelta
Stanislav Korotky
5 (1)
This indicator displays volume delta (of either tick volume or real volume) encoded in a custom symbol, generated by special expert advisers, such as RenkoFromRealTicks . MetaTrader does not allow negative values in the volumes, this is why we need to encode deltas in a special way, and then use CustomVolumeDelta indicator to decode and display the deltas. This indicator is applicable only for custom instruments generated in appropriate way (with signed volumes encoded). It makes no sense to ap
FREE
This indicator provides the analysis of tick volume deltas. It monitors up and down ticks and sums them up as separate volumes for buys and sells, as well as their delta volumes. In addition, it displays volumes by price clusters (cells) within a specified period of bars. This indicator is similar to VolumeDeltaMT5 , which uses almost the same algorithms but does not process ticks and therefore cannot work on M1. This is the reason for VolumeDeltaM1 to exist. On the other hand, VolumeDeltaMT5 ca
RenkoChartsDemo
Stanislav Korotky
This is a demo version of a non-trading expert , which utilizes so called the custom symbols feature ( available in MQL as well ) to build renko charts based on historical quotes of selected standard symbol and to refresh renko in real-time according to new ticks. Also it translates real ticks to the renko charts, which allows other EAs and indicators to trade and analyze renko. Place the EA on a chart of a working instrument. The lesser timeframe of the source chart is, the more precise resulti
FREE
Order Book, known also as Market Book, market depth, Level 2, - is a dynamically updated table with current volumes of orders to buy and to sell specific financial instument at price levels near Bid and Ask. MetaTrader 5 provides the means for receiving market book from your broker, but in real time only, without access to its history. This expert adviser OrderBook History Playback allows you to playback the market book events on the history using files, created by OrderBook Recorder . The exper
FREE
This script allows performing a walk-forward analysis of trading experts based on the data collected by the WalkForwardLight MT5 library. The script builds a cluster walk forward report and rolling walk forward reports that refine it, in the form of a single HTML page. This script is optional, as the library automatically generates the report immediate after the optimization in the tester is complete. However, the script is convenient because it allows using the same collected data to rebuild th
FREE
WalkForwardDemo MT5
Stanislav Korotky
WalkForwardDemo is an expert adviser (EA) demonstrating how the built-in library WalkForwardOptimizer (WFO) for walk-forward optimization works. It allows you to easily optimize, view and analyze your EA performance and robustness in unknown trading conditions of future. You may find more details about walk-forward optimization in Wikipedia . Once you have performed optimization using WFO, the library generates special global variables (saved in an "archived" file with GVF-extension) and a CSV-f
FREE
HZZM
Stanislav Korotky
4 (1)
This is an adaptive ZigZag based on modification of  HZZ indicator (original source code is available in this article ). Most important changes in this version: two additional indicator buffers added for zigzag evolution monitoring - they show cross signs at points where zigzag direction first changes; zigzag range (H) autodetection on day by day basis; time-dependent adjustment of zigzag range. Parameters: H - zigzag range in points; this parameter is similar to original HZZ, but it can take 0
FREE
PointsVsBars
Stanislav Korotky
This indicator provides a statistical analysis of price changes (in points) versus time delta (in bars). It calculates a matrix of full statistics about price changes during different time periods, and displays either distribution of returns in points for requested bar delta, or distribution of time deltas in bars for requested return. Please, note, that the indicator values are always a number of times corresponding price change vs bar delta occurred in history. Parameters: HistoryDepth - numbe
FREE
OrderBook Recorder
Stanislav Korotky
Order Book, known also as Market Book, market depth, Level 2, - is a dynamically updated table with current volumes of orders to buy and to sell specific financial instument at price levels near Bid and Ask. MetaTrader 5 provides the means for receiving market book from your broker in real time. The expert OrderBook Recorder records market book changes and stores them in local files for further usage in indicators and expert adviser, including testing in the tester. The expert stores market book
FREE
Comparator
Stanislav Korotky
4.75 (4)
This indicator compares the price changes during the specified period for the current symbol and other reference symbol. It allows to analyze the similar movements of highly correlated symbols, such as XAUUSD and XAGUSD, and find their occasional convergences and divergences for trading opportunities. The indicator displays the following buffers: light-green thick line - price changes of the current symbol for TimeGap bars; light-blue thin line - price changes of the reference symbol ( LeadSymbo
FREE
OrderBook Utilities is a script, which performs several service operations on order book hob-files, created by OrderBook Recorder . The script processes a file for work symbol of the current chart. The file date is selected by means of the input parameter CustomDate (if it's filled in) or by the point where the script is dropped on the chart. Depending from the operation, useful information is written into the log, and optionally new file is created. The operation is selected by the input parame
FREE
SOMFX1Builder
Stanislav Korotky
5 (1)
If you like trading by candle patterns and want to reinforce this approach by modern technologies, this script is for you. In fact, it is a part of a toolbox, that includes a neural network engine implementing Self-Organizing Map (SOM) for candle patterns recognition, prediction, and provides you with an option to explore input and resulting data. The toolbox contains: SOMFX1Builder  - this script for training neural networks; it builds a file with generalized data about most characteristic pric
FREE
Year2Year
Stanislav Korotky
This indicator shows price changes for the same days in past years. D1 timeframe is required. This is a predictor indicator that finds D1 bars for the same days in past 8 years and shows their relative price changes on the current chart. Parameters: LookForward - number of days (bars) to show "future" price changes; default is 5; Offset - number of days (bars) to shift back in history; default is 0; ShowAverage - mode switch; true - show mean value for all 8 years and deviation bounds; false - s
FREE
ReturnAutoScale
Stanislav Korotky
5 (2)
The indicator calculates running total of linear weighted returns. It transforms rates into integrated and difference-stationary time series with distinctive buy and sell zones. Buy zones are shown in blue, sell zones in red. Parameters: period - number of bars to use for linear weighted calculation; default value - 96; smoothing - period for EMA; default value - 5; mode - an integer value for choosing calculation mode: 0 - long term trading; 1 - medium term trading; 2 - short term trading; defa
FREE
Mirror
Stanislav Korotky
This indicator predicts rate changes based on the chart display principle. It uses the idea that the price fluctuations consist of "action" and "reaction" phases, and the "reaction" is comparable and similar to the "action", so mirroring can be used to predict it. The indicator has three parameters: predict - the number of bars for prediction (24 by default); depth - the number of past bars that will be used as mirror points; for all depth mirroring points an MA is calculated and drawn on the ch
If you like trading crosses (such as AUDJPY, CADJPY, EURCHF, and similar), you should take into account what happens with major currencies (especially, USD and EUR) against the work pair: for example, while trading AUDJPY, important levels from AUDUSD and USDJPY may have an implicit effect. This indicator allows you to view hidden levels, calculated from the major rates. It finds nearest extremums in major quotes for specified history depth, which most likely form resistence or support levels, a
EvoLevels
Stanislav Korotky
The indicator displays most prominent price levels and their changes in history. It dynamically detects regions where price movements form attractors and shows up to 8 of them. The attractors can serve as resistance or support levels and outer bounds for rates. Parameters: WindowSize - number of bars in the sliding window which is used for detection of attractors; default is 100; MaxBar - number of bars to process (for performance optimization); default is 1000; when the indicator is called from
This is an intraday indicator that uses conventional formulae for daily and weekly levels of pivot, resistance and support, but updates them dynamically bar by bar. It answers the question how pivot levels would behave if every bar were considered as the last bar of a day. At every point in time, it takes N latest bars into consideration, where N is either the number of bars in a day (round the clock, i.e. in 24h) or the number of bars in a week - for daily and weekly levels correspondingly. So,
Most of traders use resistance and support levels for trading, and many people draw these levels as lines that go through extremums on a chart. When someone does this manually, he normally does this his own way, and every trader finds different lines as important. How can one be sure that his vision is correct? This indicator helps to solve this problem. It builds a complete set of virtual lines of resistance and support around current price and calculates density function for spatial distributi
The indicator draws a histogram of important levels for several major currencies attached to the current cross rates. It is intended for using on charts of crosses. It displays a histogram calculated from levels of nearest extremums of related major currencies. For example, hidden levels for AUDJPY can be detected by analyzing extremums of AUD and JPY rates against USD, EUR, GBP, and CHF. All instruments built from these currencies must be available on the client. This is an extended version of
StatBars
Stanislav Korotky
The indicator provides a statistic histogram of estimated price movements for intraday bars. It builds a histogram of average price movements for every intraday bar in history, separately for each day of week. Bars with movements above standard deviation or with higher percentage of buys than sells, or vice versa, can be used as direct trading signals. The indicator looks up current symbol history and sums up returns on every single intraday bar on a specific day of week. For example, if current
PriceProbability
Stanislav Korotky
This is an easy to use signal indicator which shows and alerts probability measures for buys and sells in near future. It is based on statistical data gathered on existing history and takes into account all observed price changes versus corresponding bar intervals in the past. The statistical calculations use the same matrix as another related indicator - PointsVsBars. Once the indicator is placed on a chart, it shows 2 labels with current estimation of signal probability and alerts when signal
CCFpExtra
Stanislav Korotky
CCFpExtra is an extended version of the classic cluster indicator - CCFp. This is the MT4 version of indicator  CCFpExt available for MT5. Despite the fact that MT5 version was published first, it is MT4 version which was initially developed and tested, long before MT4 market was launched. Main Features Arbitrary groups of tickers or currencies are supported: can be Forex, CFDs, futures, spot, indices; Time alignment of bars for different symbols with proper handling of possibly missing bars, in
This is a signal indicator for automatic trading which shows probability measures for buys and sells for each bar. It is based on statistical data gathered on existing history and takes into account all observed price changes versus corresponding bar intervals in the past. The core of the indicator is the same as in PriceProbablility indicator intended for manual trading. Unlike PriceProbability this indicator should be called from MQL4 Expert Advisors or used for history visual analysis. The in
The main idea of this indicator is rates analysis and prediction by Fourier transform. Indicator decomposes exchange rates into main harmonics and calculates their product in future. You may use the indicator as a standalone product, but for better prediction accuracy there is another related indicator - FreqoMaster - which uses FreqoMeterForecast as a backend engine and combines several instances of FreqoMeterForecast for different frequency bands. Parameters: iPeriod - number of bars in the ma
Filtro:
Nessuna recensione
Rispondi alla recensione