Ace Supply Demand Zone MT4
- Indikatoren
-
Young Ho Seo
 Harmonic Pattern Indicator - Repainting + Japanese Candlestick Pattern Scanner + Automatic Channel + Many more
https://www.mql5.com/en/market/product/4488 - Version: 5.2
- Aktualisiert: 10 Februar 2022
- Aktivierungen: 6
Ace Angebot-Nachfrage-Zonen-Indikator
Das Konzept der Angebots-Nachfrage-Zone beruht auf dem quantitativen Missverhältnis zwischen Kauf- und Verkaufsvolumen auf dem Finanzmarkt. Die Angebots- und Nachfragezone kann einen guten Ein- und Ausstieg bieten. Eine Zone ist leichter zu handeln als eine Linie. Die Angebots-Nachfrage-Zone kann einen detaillierten Handelsplan und ein Risikomanagement ermöglichen. Ihre Fähigkeit, die Marktrichtung vorherzusagen, ist hoch. Der Ace Supply Demand Zone Indicator zeichnet sich durch zwei Punkte aus. Der Ace Supply Demand Zone-Indikator basiert auf dem Prinzip, dass er nicht nachzeichnet und nicht nachhängt. Wenn Sie die Wahl haben, entscheiden Sie sich immer für ein System, das nicht nachzeichnet und nicht verzögert.
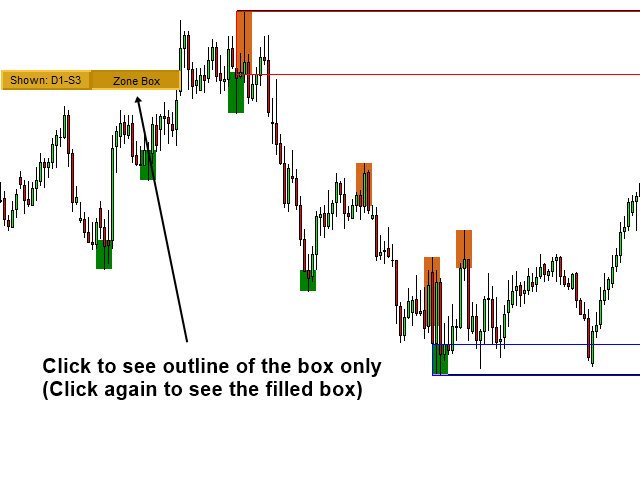
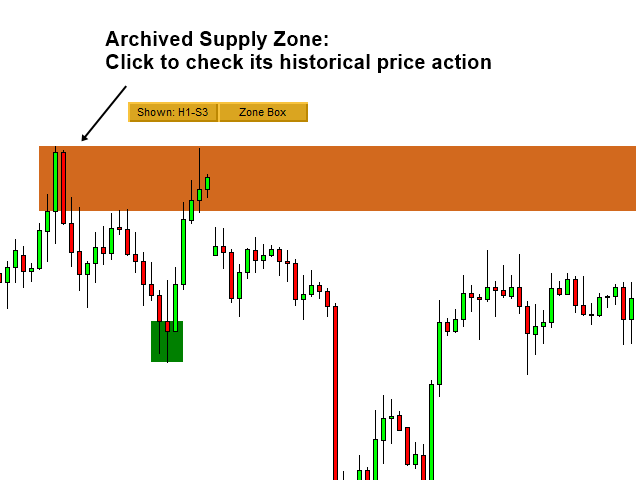
Da es sich um einen nicht nachlaufenden Angebots-Nachfrage-Zonen-Indikator handelt, können Sie die historische Angebots- und Nachfragezone als horizontale Unterstützung und Widerstand verwenden. So wird zum Beispiel irgendwann jede Angebots- und Nachfragezone durchbrochen. Sobald sie durchdrungen werden, erreicht der Indikator automatisch diese Angebots- und Nachfragezonen. Die historische Zone wird mit einer kurzen Box anstelle der erweiterten Box in Ihrem Chart angezeigt. Sie können die Boxen jederzeit wieder verlängern, indem Sie sie anklicken. Auch nach Ablauf ihrer Lebensdauer können sie Ihnen dazu dienen, die große Ausbruchs- oder Umkehrzone in Ihrem Chart zu zeichnen. Mit der historischen Angebots- und Nachfragezone können Sie die Handelsleistung zusätzlich zur ursprünglichen Angebots- und Nachfragezonenstrategie verbessern. Sie können sie als automatischen horizontalen Unterstützungs- und Widerstandsindikator in diesem Sinne betrachten. Daher ist der Ace Supply and Demand Indikator im Vergleich zu anderen Angebots- und Nachfrageindikatoren im Internet sehr wertvoll.
Wichtigste Merkmale
-
Scannen mehrerer Zeitrahmen für die wichtige Angebots-Nachfrage-Zone
-
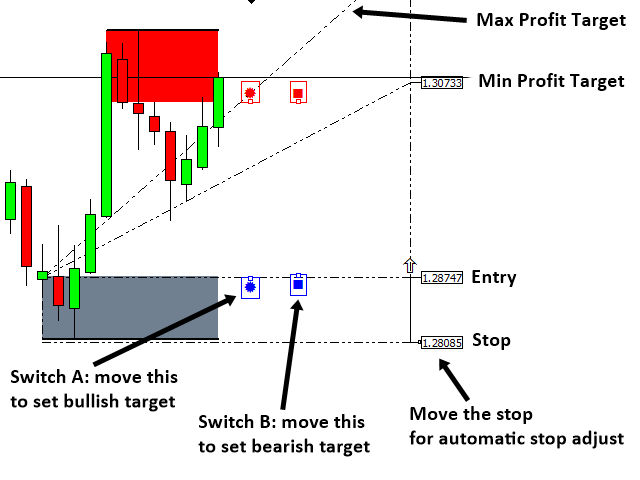
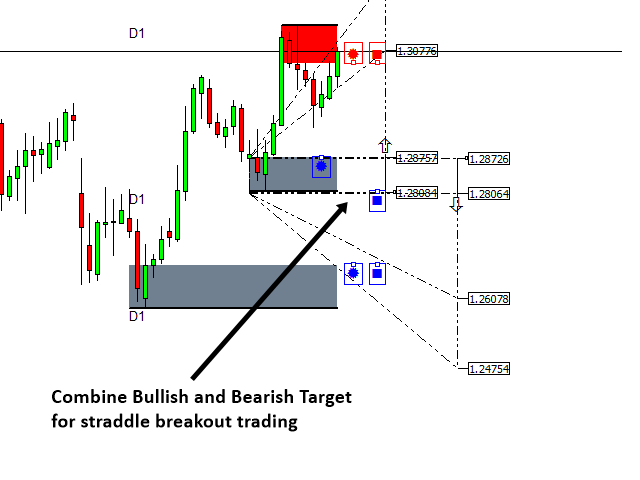
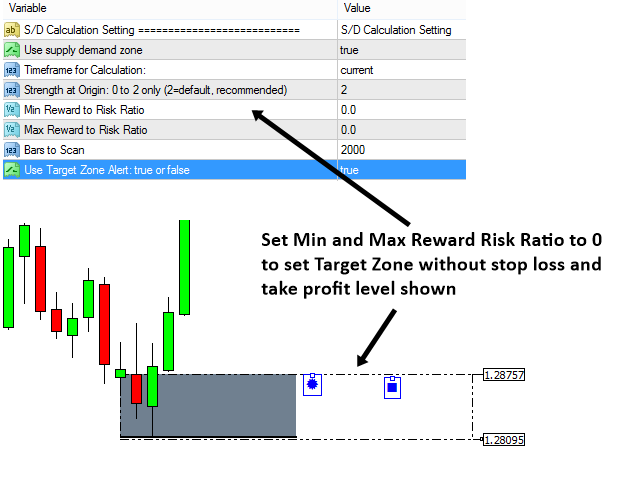
Automatische Gewinnziel- und Stop-Loss-Erkennung für jede Angebots-Nachfrage-Zone
-
Tägliche, wöchentliche und monatliche Marktprofilanalyse, um die Mean-Reversion-Charakteristika des Marktes besser einschätzen zu können (Wertbereich und Kontrollpunktberechnung inbegriffen).
-
Tägliche, wöchentliche und monatliche Pivot-Analyse zur Verbesserung Ihrer Mean-Reversion-Analyse
-
Fähigkeit, mehrere Zeitrahmenanalysen auf demselben Diagramm durchzuführen (es wird empfohlen, nicht mehr als zwei Zonen pro Diagramm zu verwenden)
-
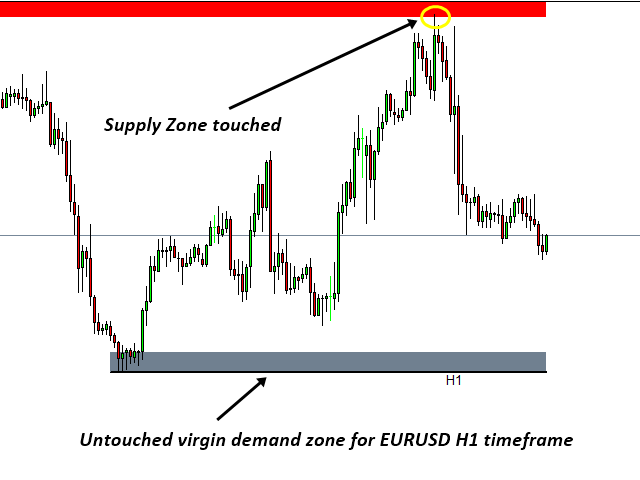
Automatische Retouch-Erkennung jeder Angebots-Nachfrage-Zone. (Einfach zu erkennen, welche Zone jungfräulich ist und welche nicht.)
-
Ton, E-Mail, Push-Benachrichtigung ist möglich, wenn eine Angebots-Nachfrage-Zone berührt oder erkannt wird
Handelsrichtung
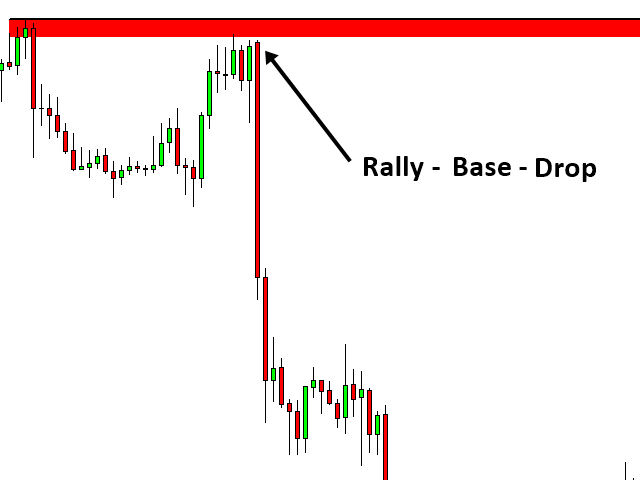
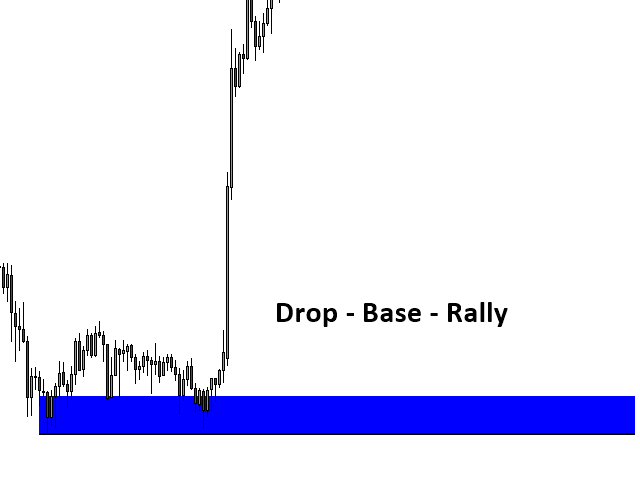
Sie können den typischen Handel mit Angebots- und Nachfragezonen durchführen. Zum Beispiel können Sie die Angebots- und Nachfragezone verwenden, um die Marktrichtung vorherzusagen (Drop Base Rally-Muster, Rally Base Drop-Muster, Rally Base Rally-Muster, Drop Base Drop-Muster). Zweitens können Sie die Angebots-Nachfrage-Zone auch als horizontale Unterstützung und Widerstand verwenden. Darüber hinaus können Sie das Marktprofil als zusätzliches Instrument zur Entscheidungsfindung nutzen.
Über das Marktprofil
Dieser Indikator bietet ein tägliches, wöchentliches und monatliches Marktprofil, um die Chancen der Mittelwertumkehr für den Markt abzuschätzen. Um das Marktprofil zu erstellen, muss der Zeitrahmen für den Chart sorgfältig ausgewählt werden, damit das Marktprofil richtig berechnet werden kann. Normalerweise ist es wichtig, die Preisbewegung außerhalb des Wertbereichs zu erkennen.
-
Tägliches Marktprofil: Es können die Zeitrahmen M5 bis H1 verwendet werden. M30 wird empfohlen.
-
Wöchentliches Marktprofil: Es kann der Zeitrahmen M30 bis H4 verwendet werden. H1 wird empfohlen.
-
Monatliches Marktprofil: Es kann der Zeitrahmen H1 bis D1 verwendet werden. H4 wird empfohlen.
Leitfaden für die Handelsstrategie
Ein guter Leitfaden für die Handelsstrategie für den Handel mit Angebot und Nachfrage kann aus der Technischen Analyse im Forex- und Aktienmarkt (Supply Demand Analysis and Support Resistance, 2021) entnommen werden. Darüber hinaus können Sie auch das Buch verwenden : Science Of Support, Resistance, Fibonacci Analysis, Harmonic Pattern, Elliott Wave and X3 Chart Pattern (In Forex and Stock Market Trading, 2021), um die Erklärung für Unterstützung und Widerstand sowie andere fortgeschrittene technische Analysen zu finden. Bitte besuchen Sie den untenstehenden Link für weitere Details über den Handelsstrategie-Leitfaden mit Supply Demand Zone Trading.
Leitfaden zum Handel mit der Angebots-Nachfrage-Zone: https: //www.mql5.com/en/blogs/post/750386
Wichtiger Hinweis
Dies ist ein Produkt von der Stange. Daher akzeptieren wir keine Änderungen oder Anpassungswünsche für dieses Produkt. Darüber hinaus bieten wir keine Code-Bibliothek oder Unterstützung für Ihre Codierung für dieses Produkt.


The cleanliness and clarity that this indicator provides is greatly appreciated, unlike others that fill your screen without offering any solutions.... The best supply and demand indicator... 5 stars