MACD Scanner MT4
- Indicadores
- Versión: 1.1
- Activaciones: 20

El indicador monitoriza la tendencia MACD en múltiples marcos temporales para un mercado específico. Ya no tendrá que cambiar de gráfico para comprobar la dirección de la tendencia mientras opera.
Características principales
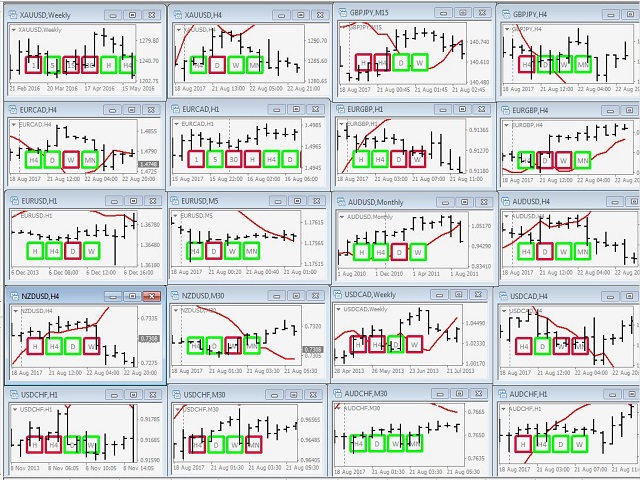
- El indicador se puede utilizar en todos los mercados
- Monitoriza todos los marcos temporales, desde M1 a MN
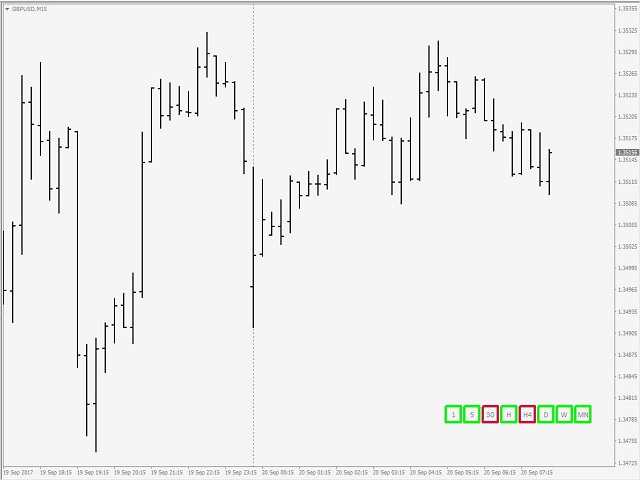
- Capaz de mover la etiqueta de visualización en el gráfico con un solo clic
Uso del indicador
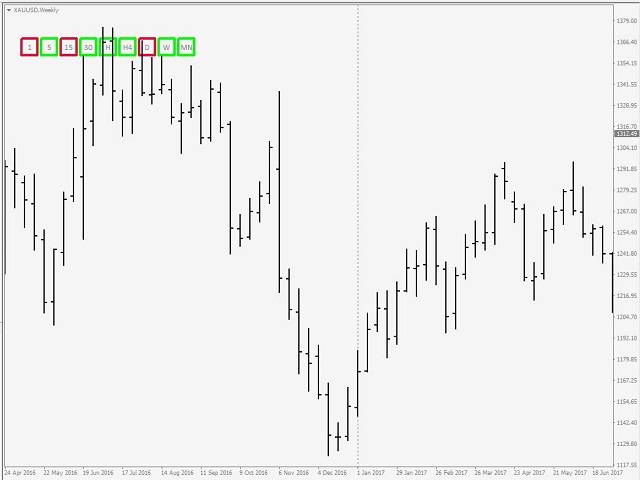
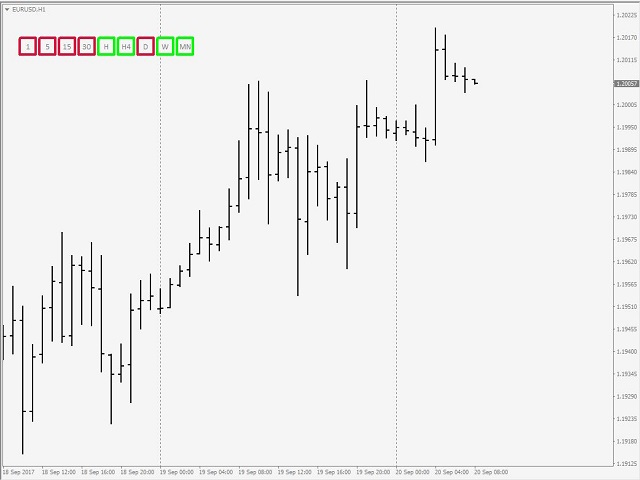
El tablero aparece a la izquierda y en la parte superior del gráfico cuando está conectado. La carcasa que encierra un marco temporal se vuelve roja en una tendencia bajista y verde en una tendencia alcista. Si la ubicación por defecto del cuadro de mandos le resulta incómoda, puede moverlo a un lugar conveniente del gráfico. Para ello, seleccione (haciendo doble clic o un solo clic, dependiendo de cómo se seleccionen los objetos en el terminal del usuario) el primer cuadro de mando y arrástrelo hasta la ubicación preferida. Suéltela y las demás seguirán su ejemplo.
Parámetros
- FastEMA // EMA rápido
- SlowEMA // EMA lento
- SignalEMA // Señal EMA
- PeriodM1 // 1 minuto
- PeriodM5 // 5 minutos
- PeriodM15// 15 minutos
- PeriodM30// 30 minutos
- PeriodH1 // 1 hora
- PeríodoH4 // 4 horas
- PeríodoD1 // Diario
- PeriodW1 // Semanal
- PeriodMN // Mensual
- AlertOn // Alerta de tendencia
- PopAlrt // Alerta emergente
- MailAlrt // Alerta por correo electrónico
- PushAlrt // Alerta push
*********************************************************************************
Para Dinapoli MACD Dashboard Scanner;
Por favor visite ► https://www.mql5.com/es/mercado/producto/52812
*********************************************************************************
Si desea conocer el cambio de tendencia MACD una cabeza de tiempo con el indicador de predicción MACD más popular de Dinapoli;
Por favor visite ► https://www.mql5.com/en/market/product/52621
¡¡¡Usted ya no necesita monitorear standart indicador MACD !!!
*********************************************************************************
Para mis otros productos;
Por favor visite ► https://www.mql5.com/en/users/samil34

El usuario no ha dejado ningún comentario para su valoración