MACD Scanner MT4
- Индикаторы
- Версия: 1.1
- Активации: 20

The indicator monitors the MACD trend in multiple timeframes for a specific market. No more shifting in between charts to check the trend direction while trading.
Key Features
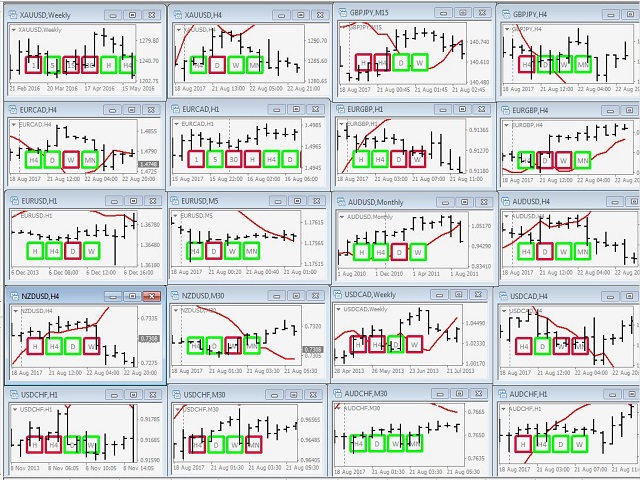
- Indicator can be used for all markets
- Monitors every timeframe, from M1 to MN
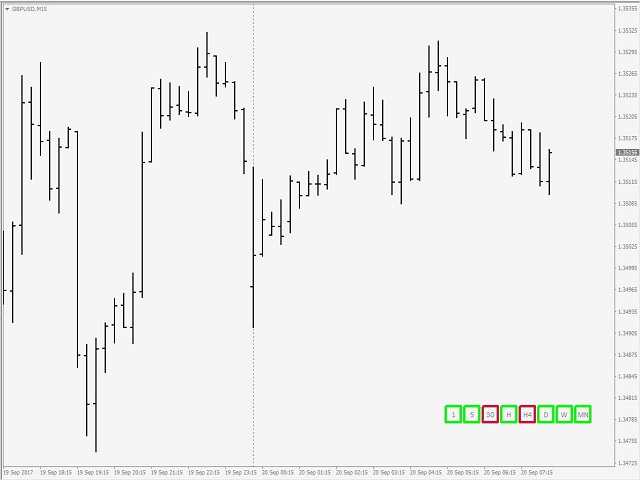
- Able to move display label on chart by single click
Indicator Usage
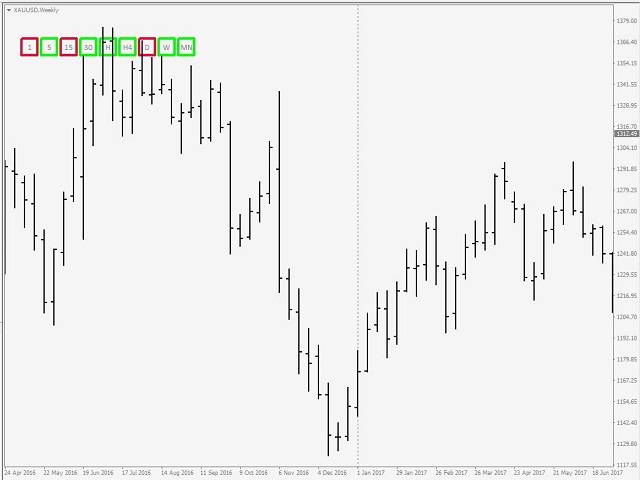
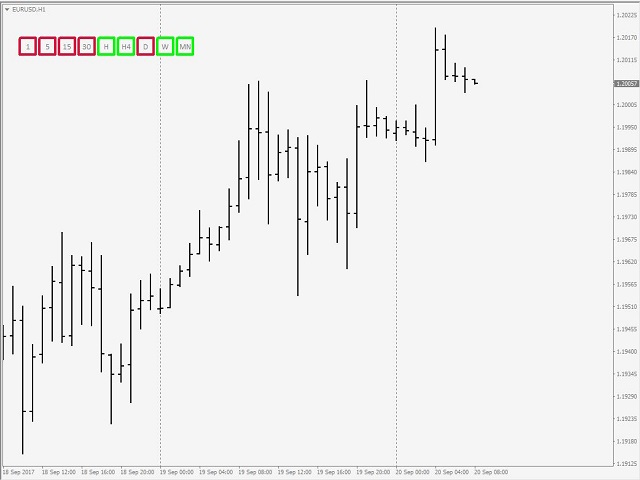
The dashboard appears to the left and upper part of the chart when attached. The shell encapsulating a timeframe goes red on a down trend, green on an up trend. If the default location of the dashboard is inconvenient, it can be moved to a convenient location on the chart. This can be done by selecting (double click or single click depending on how objects are selected on the user’s terminal) the first shell and dragging it to the preferred location. Drop it and the others will follow suit.
Parameters
- FastEMA // Fast EMA
- SlowEMA // Slow EMA
- SignalEMA// Signal EMA
- PeriodM1 // 1 minute
- PeriodM5 // 5 minutes
- PeriodM15// 15 minutes
- PeriodM30// 30 minutes
- PeriodH1 // 1 hour
- PeriodH4 // 4 hours
- PeriodD1 // Daily
- PeriodW1 // Weekly
- PeriodMN // Monthly
- AlertOn // Alert on trend
- PopAlrt // Popup alert
- MailAlrt // Email alert
- PushAlrt // Push alert
*********************************************************************************
For Dinapoli MACD Dashboard Scanner;
Please visit ► https://www.mql5.com/en/market/product/52812
*********************************************************************************
If you want to know MACD trend change a head of time with Dinapoli's most popular MACD predictor indicator;
Please visit ► https://www.mql5.com/en/market/product/52621
You no longer need to monitor standart MACD indicator anymore !!!
*********************************************************************************
For My Other Products;
Please visit ► https://www.mql5.com/en/users/samil34

Пользователь не оставил комментарий к оценке