PRO Macd Predictor MT5
- Göstergeler
- Sürüm: 1.1
- Güncellendi: 13 Mayıs 2023
- Etkinleştirmeler: 15

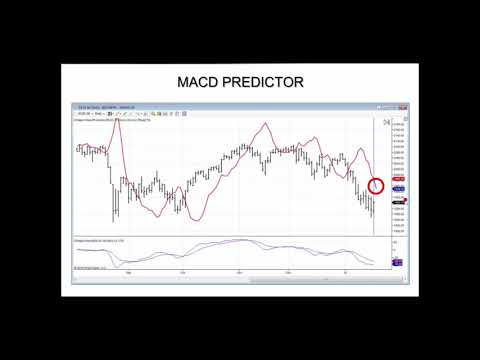
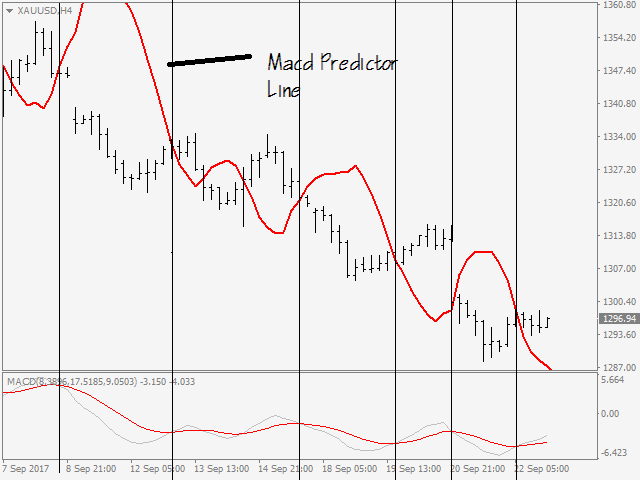
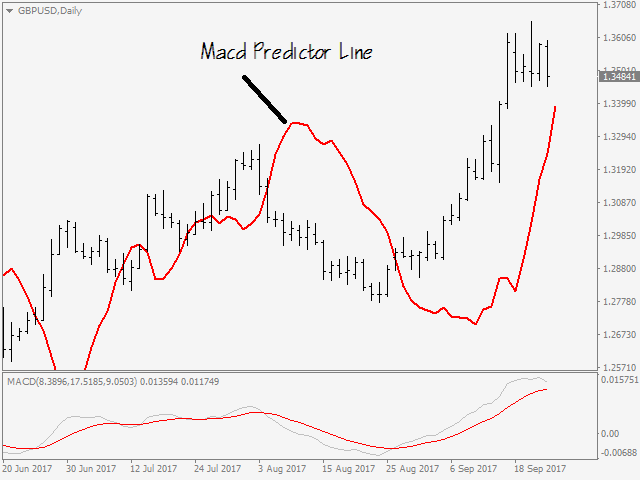
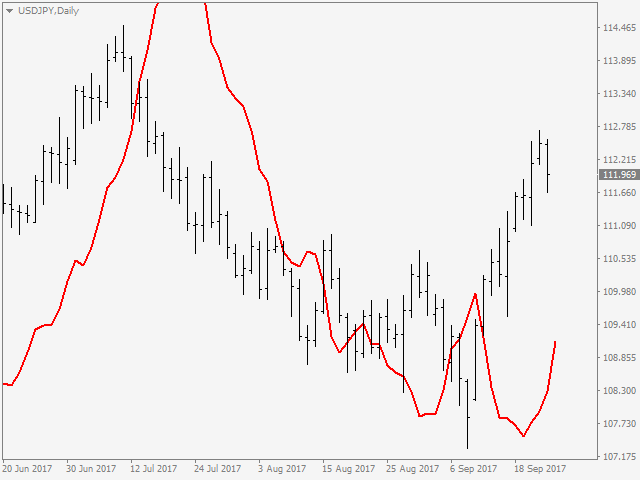
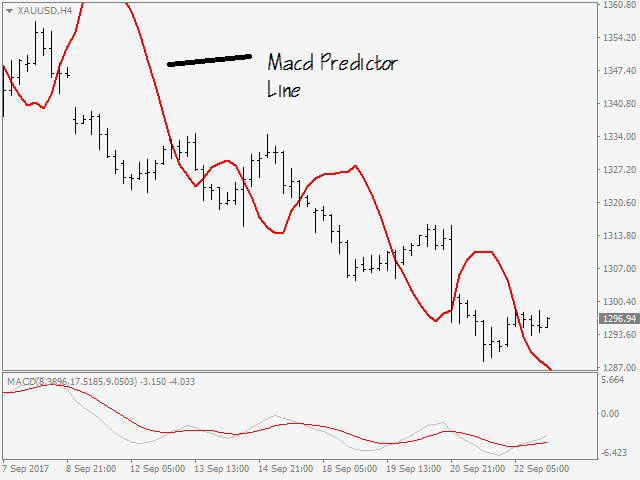
Very special indicator of Joe Dinapoli which is a derivative from traditional MACD indicator. It shows the precise price, at which MACD will show line crossing and trend shifting. Also, this level is known one period ahead of time.You can constantly reassess your current position by looking at this studying a variety of timeframes. When you are in a trade, you have a feel for how much time you have for the trade to go your way by looking at the distance between the MACD Predictor line and the last price.
You can determine by the pressures that are currently bearing on the markets as well as those that will come to bear, where you want to put on a given trade.
***As you know many traders are using MACD as trend indicator. With having access to this game changing indicator you will have significant edge over who are looking at standart MACD indicator.
Inputs
- Fast EMA - period of the fast Moving Average.
- Slow EMA - period of the slow Moving Average.
- Signal EMA - period of the Signal line.
***Please do not hesitate to ask me any questions regarding this indicator... I will be here to show you how to use this indicator until you are fully satisfied !
For MT4 Version; please visit ► https://www.mql5.com/en/market/product/52621
For My Other Products; please visit ►https://www.mql5.com/en/users/samil34

Kullanıcı değerlendirmeye herhangi bir yorum bırakmadı