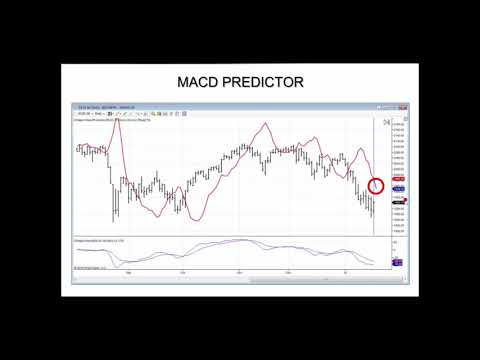
PRO Macd Predictor MT5
- Indicadores
- Samil Bozuyuk
- Versión: 1.1
- Actualizado: 13 mayo 2023
- Activaciones: 15
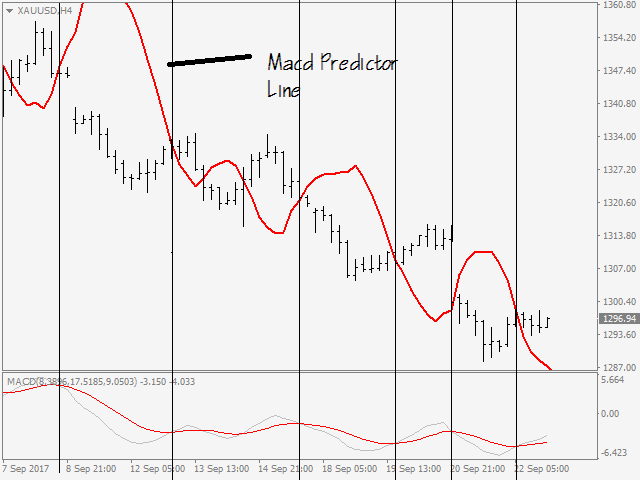
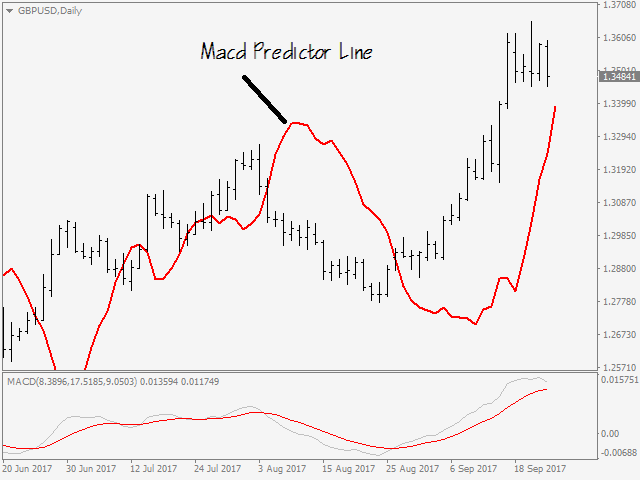
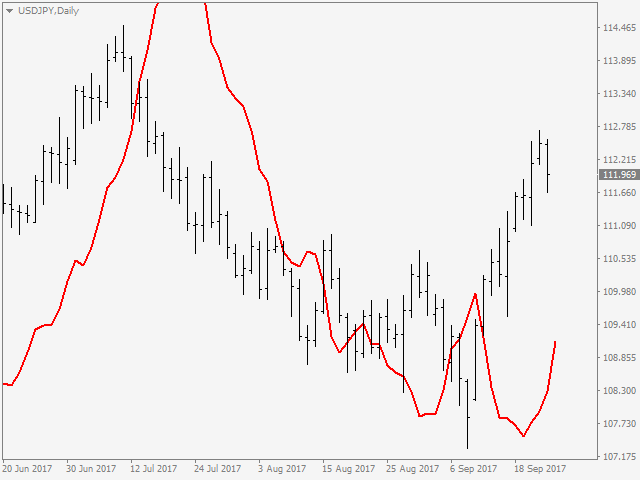
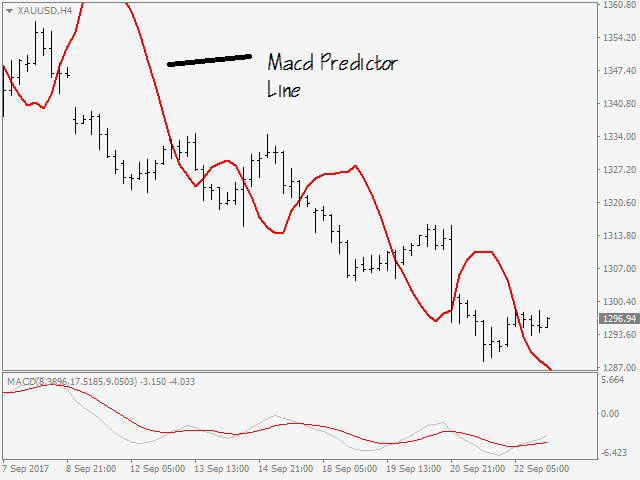
Indicador muy especial de Joe Dinapoli que es un derivado del indicador MACD tradicional. Muestra el precio exacto, en el que MACD mostrará el cruce de líneas y el cambio de tendencia. Además, este nivel se conoce con un período de antelación.puede reevaluar constantemente su posición actual mirando esto estudiando una variedad de marcos de tiempo. Cuando usted está en un comercio, usted tiene una idea de cuánto tiempo tiene para que el comercio vaya a su manera mirando a la distancia entre la línea MACD Predictor y el último precio.
Usted puede determinar por las presiones que actualmente están soportando los mercados, así como las que vendrán a soportar, donde usted quiere poner en un comercio dado.
***Como sabe, muchos operadores utilizan el MACD como indicador de tendencia. Con el acceso a este indicador de cambio de juego tendrá una ventaja significativa sobre los que están buscando en el indicador MACD standart.
Entradas
- Fast EMA - periodo de la media móvil rápida.
- Slow EMA - periodo de la media móvil lenta.
- Señal EMA - período de la línea de señal.
***Por favor, no dude en hacerme cualquier pregunta sobre este indicador... ¡Estaré aquí para mostrarle cómo utilizar este indicador hasta que esté completamente satisfecho!
Para MT4 Versión; por favor visite ► https://www.mql5.com/en/market/product/52621
Para Mis Otros Productos; por favor visite►https://www.mql5.com/en/users/samil34

El usuario no ha dejado ningún comentario para su valoración