Volume Spread Pattern Indicator MT4
- Indikatoren
-
Young Ho Seo
 Harmonic Pattern Indicator - Repainting + Japanese Candlestick Pattern Scanner + Automatic Channel + Many more
https://www.mql5.com/en/market/product/4488 - Version: 2.2
- Aktualisiert: 3 März 2022
- Aktivierungen: 5
Einführung
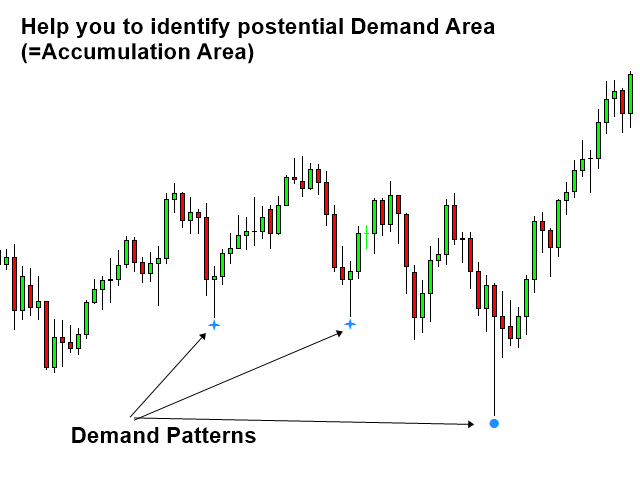
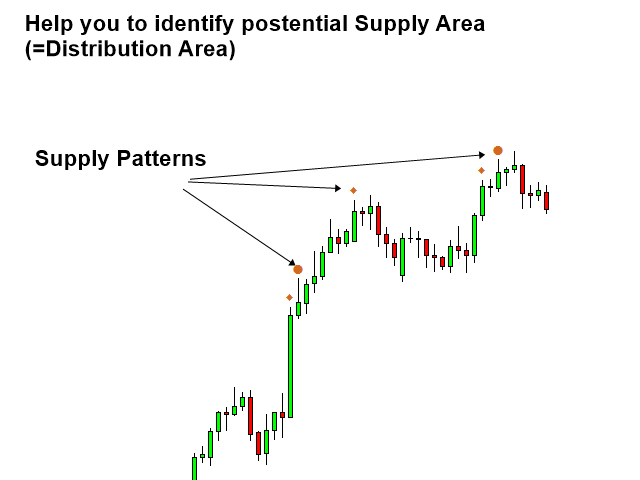
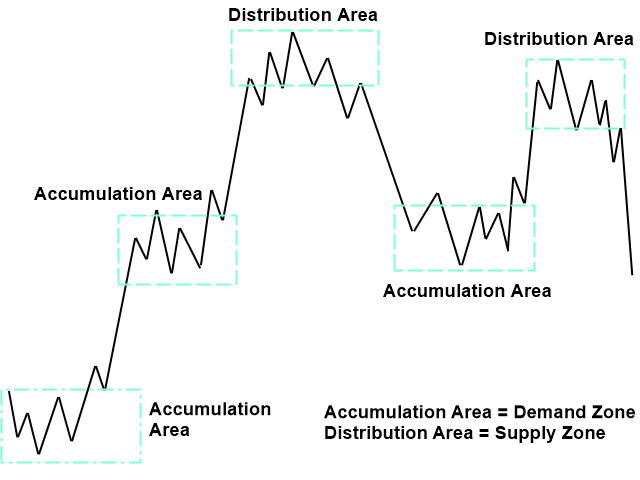
Dieser Indikator erkennt Volumen-Spread-Muster für Kauf- und Verkaufsgelegenheiten. Die Muster umfassen Nachfrage- und Angebotsmuster, die Sie für den Handel verwenden können. Diese Muster sind jedoch am besten geeignet, um die Nachfragezone (=Kumulierungsbereich) und die Angebotszone (=Verteilungsbereich) zu erkennen. Das Nachfragemuster zeigt im Allgemeinen eine potenzielle Kaufgelegenheit an. Das Angebotsmuster deutet im Allgemeinen auf eine potenzielle Verkaufsgelegenheit hin. Es handelt sich dabei um die zugrunde liegenden Muster und nicht um direkte Kursbewegungen. Die Wirkung des Kauf- und Verkaufsmarktes kann manchmal erst nach der Beobachtung mehrerer dieser Muster eintreten. Daher sind diese Muster nützlich, um eine mögliche Nachfragezone (=Kumulierungsbereich) oder Angebotszone (=Verteilungsbereich) zu erkennen. Insgesamt handelt es sich um einen leichten und einfachen Indikator zur Unterstützung Ihrer Handelsoperationen. Das Handelsprinzip basiert auf der modifizierten Volumen-Spread-Analyse. Wir verwenden die Unterphasen A, B, C, D und E der Wyckoff-Phasen nicht, da deren Erkennung sehr subjektiv ist. Stattdessen konzentrieren wir uns auf die Identifizierung von Akkumulations- und Distributionsbereichen anhand von Nachfrage- und Angebotsmustern. Dies ist ein einfacher und effektiverer Ansatz.
Eingabeempfehlung
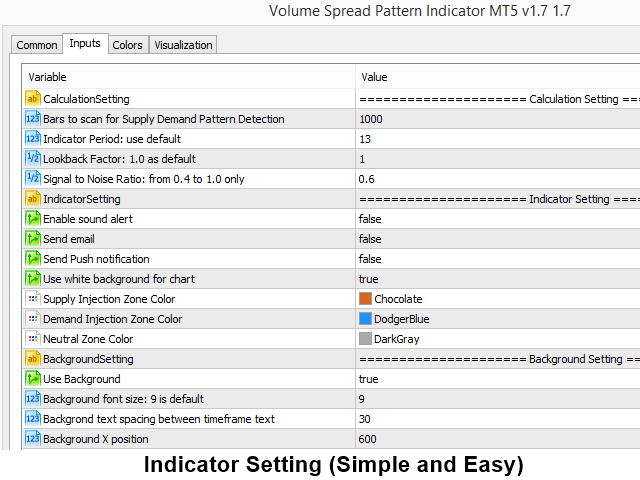
In den meisten Fällen können Sie die Standardeinstellung für diesen Volumen-Spread-Indikator verwenden. Vielleicht möchten Sie jedoch einige Eingaben für Ihre speziellen Bedürfnisse ändern. Hier ist die vollständige Beschreibung der Eingabeeinstellungen.
Berechnungseinstellungen
- Zu scannende Bars: Anzahl der Bars zur Berechnung der Angebots- und Nachfragemuster.
- Indikator-Periode: Berechnungszeitraum für die Erstellung der einzelnen Angebots- und Nachfragemuster.
- Lookback-Faktor: 1.0 als Standard
- Signal-Rausch-Verhältnis: nur von 0,4 bis 1,0. (Eingabe zur Filterung von Zufallsschwankungen in den Daten).
Einstellung des Indikators
- Tonalarm aktivieren: Tonalarm bei Mustererkennung. (nur true oder false)
- E-Mail senden: E-Mail-Benachrichtigung bei Mustererkennung. (nur true oder false)
- Push-Benachrichtigung senden: Push-Benachrichtigung für die Mustererkennung (nur true oder false)
- Weißen Hintergrund für Diagramm verwenden: Setzen Sie diese Option auf false, wenn Sie nur die standardmäßige schwarze Hintergrundfarbe verwenden möchten.
- Farbe des Angebotsmusters: Farbe der Angebotsmuster.
- Farbe der Nachfragemuster: Farbe der Nachfragemuster
- Neutrale Musterfarbe: Farbe der neuronalen Muster oder keine Muster.
Hintergrund-Einstellungen
Hintergrund bezieht sich auf die Erkennung von Angebots- und Nachfragemustern in mehreren Zeitrahmen. Mit dieser Einstellung können Sie festlegen, welche Zeitrahmenmuster Sie in Ihrem Diagramm für Ihre Entscheidungsfindung verwenden möchten. Diese Eingaben sind hauptsächlich für das Grafikpanel gedacht. Je nachdem, welche Bildschirmgröße Sie verwenden, müssen Sie diese Eingaben möglicherweise ändern.
- Hintergrund verwenden: true oder false, um die Erkennung mehrerer Zeitrahmenmuster ein- oder auszuschalten.
- Hintergrundschriftgröße: 9 ist die Standardeinstellung
- Hintergrundtextabstand zwischen den Zeitrahmentexten
- Hintergrund-X-Position: Blickposition X des Hintergrundpanels
- Hintergrund-Y-Position: Blickposition Y des Hintergrundpanels
- Größe des Hintergrundrechtecks (immer quadratisch): Größe des Rechtecks
- Abstand des Hintergrundrechtecks zum Zeitrahmentext: Abstand zwischen Text und Rechteck
Handelsstrategie-Leitfaden
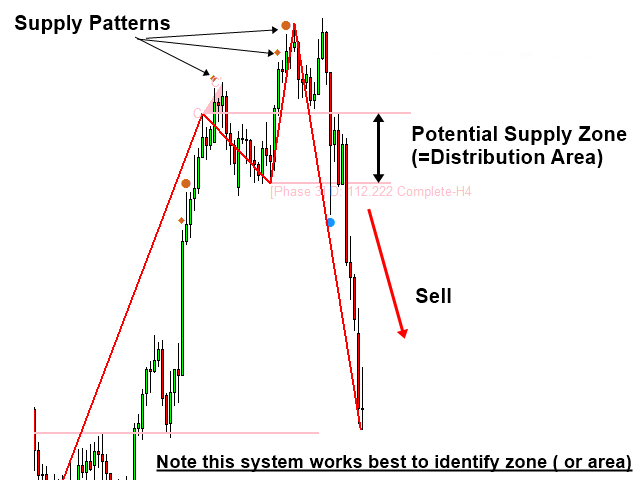
Der Volume Spread Pattern Indicator kann am besten zur Identifizierung der Nachfragezone (=Kumulierungsbereich) und der Angebotszone (=Verteilungsbereich) eingesetzt werden. Wenn Sie mit dem Indikator für übermäßiges Momentum arbeiten, wird der C-Punkt des übermäßigen Momentums zum Verkaufs-Höhepunkt (SC) oder zum Kauf-Höhepunkt (BC). Dann werden Sie Nachfrage- und Angebotsmuster verwenden, um den Akkumulationsbereich und den Distributionsbereich für Ihren Handel zu bestätigen. Sowohl kurzfristiger als auch langfristiger Handel ist möglich. Bitte beachten Sie den untenstehenden Leitfaden für Handelsstrategien:
Strategie-Leitfaden: https: //www.mql5.com/en/blogs/post/750390
Wichtiger Hinweis
Dies ist ein Produkt von der Stange. Daher akzeptieren wir keine Änderungswünsche oder Anpassungsanfragen zu diesem Produkt. Darüber hinaus bieten wir keine Code-Bibliothek oder Unterstützung für Ihre Codierung für dieses Produkt.


A great addition to the Excessive Momentum indicator. It helps a lot in terms of seeing everything quickly in one glance. If you believe the effectiveness of Excessive Momentum indicator, this is another indicator that needs to be used together to get the most optimal outcome.