Ichimoku Map
- Indikatoren
-
Pavel Verveyko
 Writing scripts, indicators, EAs on MQL5 and MQL4.
Fast, Reliable, And High-Quality.
For all questions, please contact personal messages. - Version: 1.6
- Aktualisiert: 23 Januar 2023
- Aktivierungen: 5
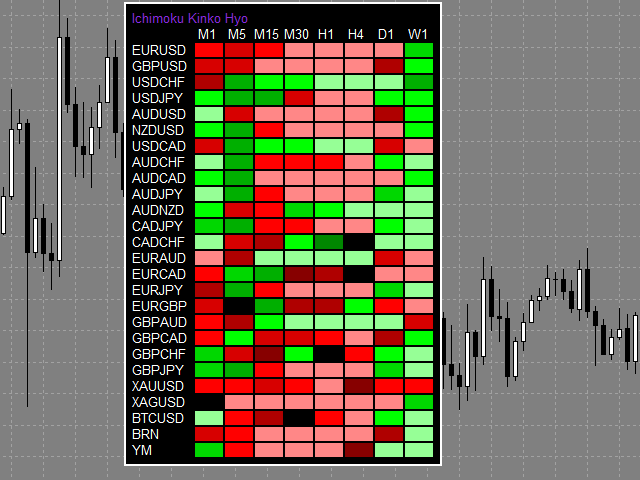
Ichimoku Map (sofortiger Blick auf die Märkte) - aufgebaut auf der Grundlage des legendären Ichimoku Kinko Hyo Indikators.
Die Aufgabe der Ichimoku Map ist es, Informationen über die Marktstärke in den ausgewählten Zeiträumen und Instrumenten aus der Sicht des Ichimoku Indikators zu liefern.
Der Indikator zeigt 7 Stufen der Kaufsignalstärke und 7 Stufen der Verkaufssignalstärke an.
Je stärker der Trend, desto heller ist das Signalrechteck in der Tabelle.
Die Tabelle kann mit der Maus verschoben werden.
Die Größe der Tabelle hängt von der in den Einstellungen gewählten Schriftgröße ab.
Wenn Sie den Mauszeiger über ein Rechteck bewegen, zeigt der Tooltip die Signalstärke und die Beschreibung der Situation an, sowie das Werkzeug und den Zeitraum, dem dieses Rechteck entspricht.
Wenn Sie auf das ausgewählte Rechteck der Tabelle klicken, ändert sich das Werkzeug und/oder der Zeitraum oder es öffnet sich ein neues Chartfenster.
Wenn in der Einstellung Neues_Schaubild_oder_Aktuelles_Schaubild die Option Aktuelles_Schaubild ausgewählt ist, werden der Zeitraum und das Werkzeug auf die Werte geändert, die dem ausgewählten Rechteck entsprechen.
Wird in der Einstellung Neues_Schaubild_oder_Aktuelles_Schaubild Neues_Schaubild gewählt, wird ein neues Fenster mit einem Diagramm geöffnet, dessen Zeitraum und Werkzeug dem gewählten Rechteck entspricht.
In der Einstellung Schablonenname_für_neues_Schaubild können Sie eine Schablone für das Diagramm angeben, mit der ein neues Fenster geöffnet wird.
Signalstärke und Interpretation der Begriffe
- Jedes Signal ändert den Grad der Signalstärke:
- cK - Kumo-Farbe (Wolken) +1 Punkt.
- TK - Goldenes und Totes Kreuz +1 Punkt.
- C - Chinkou-Bestätigung +1 Punkt.
- K - Kumo-Ausbruch (Wolken) +2 Punkte.
- pK - KijunAusbruch +1 Punkt.
- pT - TenkanAusbruch +1 Punkt.
- !K - Der Kurs befindet sich in der Wolke (Kumo) -1 Punkt.
Einstellunge n
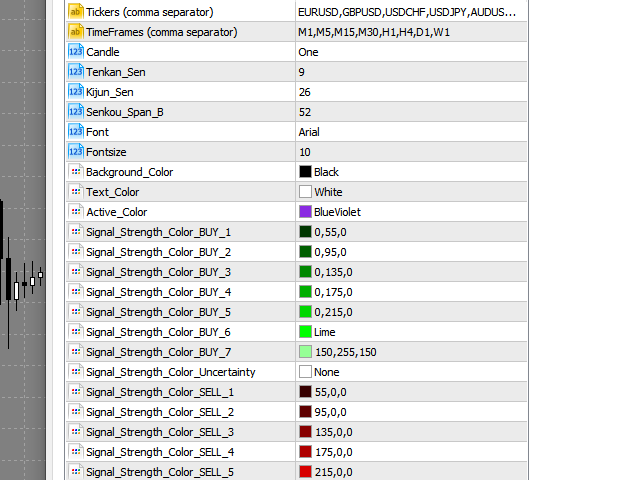
- Tickers - Tools, die in der Tabelle angezeigt werden sollen (durch Kommas getrennt).
- TimeFrames - Zeiträume , die in der Tabelle angezeigt werden sollen (durch Kommas getrennt).
- Table_Refresh_Rate (in Sekunden) - die Aktualisierungsrate der Tabelle wird in Sekunden gemessen.
- Candle - wenn Candle=One, arbeitet der Indikator mit der letzten geschlossenen Kerze undwird nicht neu gezeichnet.
Wenn Candle=Zero, arbeitet der Indikator mit der letzten offenen Kerze. - In anderen Indikatoreinstellungen können Sie die Farbe der Signalrechtecke, die Schriftart, die Schriftgröße, die Hintergrundfarbe der Tabelle, die Schriftfarbe der Tabelle sowie die klassischen Parameter des Ichimoku-Indikators ändern.
- New_Chart_or_Current_Chart - der Modus zum Öffnen eines neuen Charts: in einem neuen Fenster oder zum Ändern des Instruments und der Zeitperiode in dem Fenster, in dem der Indikator läuft.
- Template_name_for_New_Chart - der Name des Templates, mit dem das neue Chart geöffnet wird.
Ichimoku ist ein Indikator, der in den 1930er Jahren von dem japanischen Analysten Goichi Hosoda entwickelt wurde, der unter dem Pseudonym Sanjin Ichimoku veröffentlichte, um die Entwicklung des japanischen Nikkei-Aktienindex vorherzusagen.
Der Ichimoku-Indikator kombiniert mehrere Ansätze zur Marktanalyse und wurde entwickelt, um Trends, Unterstützungs- und Widerstandslinien zu erkennen und Kauf-/Verkaufssignale zu generieren.
Goichi Hosoda verbrachte mehr als dreißig Jahre mit der Perfektionierung seines Indikators und veröffentlichte die Ergebnisse erst 1968.
Ichimoku - kann grob mit "sofortiger Blick auf die Bilanz" übersetzt werden.