Weis Waves
- Indikatoren
-
Flavio Javier Jarabeck
 We are a closed brotherhood of traders whose ultimate goal is to profit through well-studied, structured, and automated trades. As a result, we publish dozens of MT5 indicators (FREE and paid) to the global MQL5 community. 80% of our published products are high-quality free indicators so beginner
 - Version: 1.4
- Aktualisiert: 6 Juni 2020
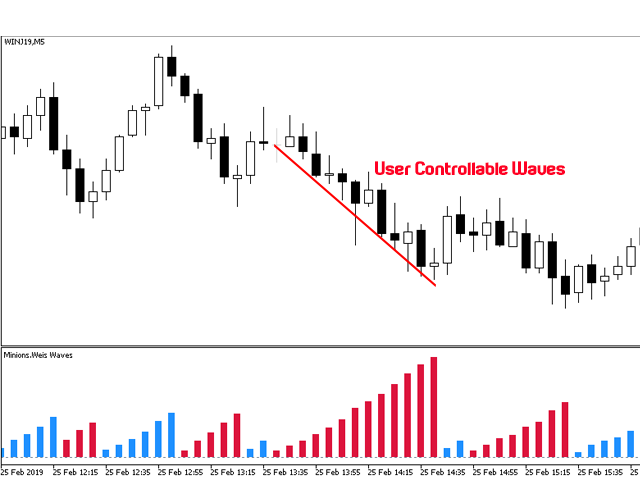
Der ursprüngliche Autor ist David Weis, ein Experte für die Wyckoff-Methode. Die Weis-Welle ist eine moderne Adaption der Wyckoff-Methode aus den 1930er Jahren, einem weiteren Experten für Bandlesetechniken und Chartanalyse. Weis Waves stützt sich auf das Marktvolumen und stapelt es in Wellen entsprechend den Preisbedingungen, was dem Händler wertvolle Einblicke in die Marktbedingungen gibt.
Wenn Sie mehr über dieses Thema erfahren möchten, finden Sie auf YouTube eine Vielzahl von Videos. Suchen Sie einfach nach "The Wickoff Method", "Weis Wave" und "Volume Spread Analysis".
Es gibt auch ein Buch, das David Weis selbst geschrieben hat: "Trades About to Happen" (Wiley Trading Series).
MERKMALE
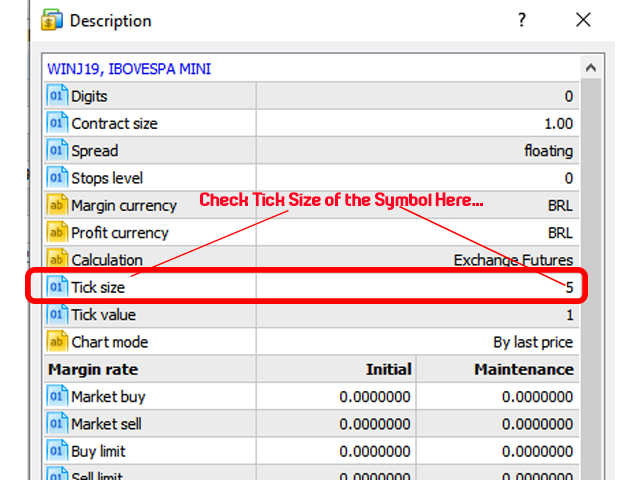
- Volumenwellen, die nach einem vom Benutzer für jedes Symbol eingestellten Schwellenwert (*in TICKS*) gestapelt werden, damit Sie die Marktschwankungen genau erfassen können.
- Sie können die Anzahl der Balken, die Sie in Ihre Studie laden müssen, einstellen, so dass Sie die Belastung und Nutzung der MT-Ressourcen begrenzen und die Verarbeitungsgeschwindigkeit erhöhen können.
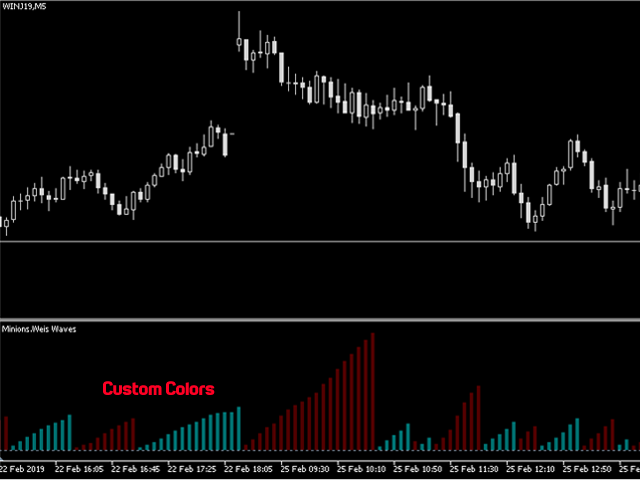
- Sie können die Farbe und den Stil der Wellen ändern.
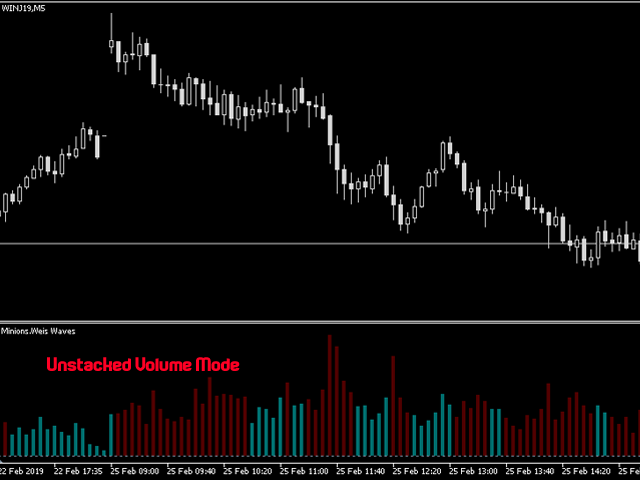
- Sie können das Volumen in ein einfaches Histogramm umwandeln, falls gewünscht.
- Sie können Real Volume oder Ticks Volume verwenden.
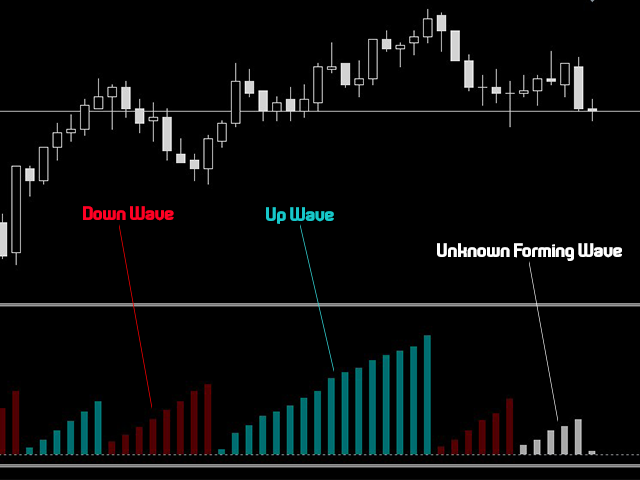
- Sie werden Aufwärts- und Abwärtswellen haben, und die neue, noch unbekannte Welle, die sich bildet, wird eine weiße (vom Benutzer veränderbare) Farbe haben.
- Manchmal wird der MT5-Datencache verzögert oder nicht erneuert, so dass einige Balken vorübergehend verschwinden können. Der Indikator erkennt und korrigiert die fehlenden Balken in einem bestimmten Zeitintervall, falls erforderlich.
- Wenn das Terminal aus irgendeinem Grund während einer Sitzung geschlossen wird, kann es sein, dass beim Neustart einige Balken in der aktuellen Welle vermischt werden. Dies ist normal, geben Sie dem Indikator eine gewisse Zeit, um sich auf die aktuelle Marktlage einzustellen...
- Dieser Indikator wurde für den Intraday-Handel (Day-Trading) entwickelt, so dass Sie ihn auf maximal einem H1-Chart verwenden können.
Ein guter Begleiter ist der Waves Sizer, der innerhalb des Charts angezeigt wird und die Distanz misst, die der Preis entlang der Swings zurückgelegt hat...
Holen Sie sich Ihren hier:
Wenn Ihnen dieser Indikator gefällt, bitte ich Sie nur um ein kleines Review (kein Kommentar, sondern ein REVIEW!)...
Das wird mir sehr viel bedeuten... Und auf diese Weise kann ich weiterhin coole Sachen kostenlos verschenken...
Ohne Bedingungen! Niemals!
Lebe lang und in Frieden!
;)


excelente indicado, quando o preço estar em ranges tem que ler com precisão! Obrigado