OrderBook Cumulative Indicator
- 지표
-
Stanislav Korotky
 Trading is just my hobby. I'm working in IT industry. So developement of experts, indicators, and script is not a problem at all to me. Wide range of technologies are used: MQL4, MQL5, system and applied programming, web-services, neural networks and more.
New: - 버전: 1.4
- 업데이트됨: 27 5월 2020
- 활성화: 5
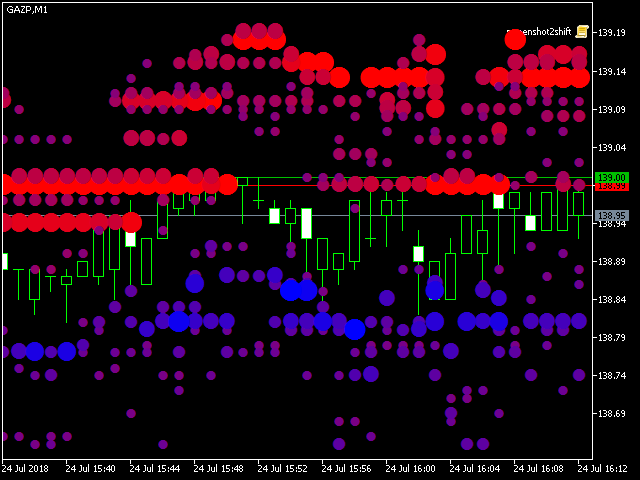
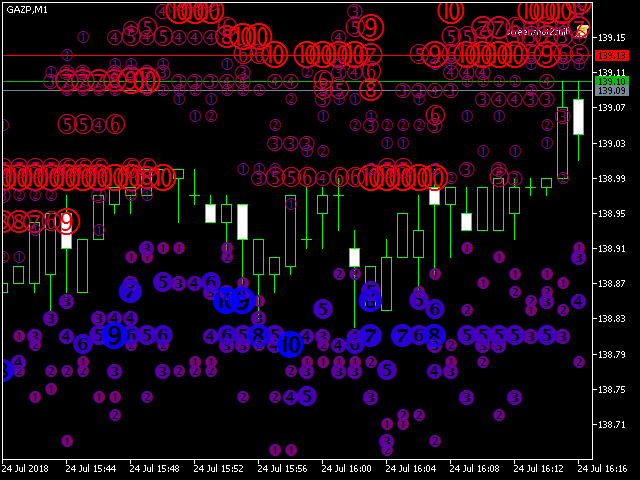
Order Book, known also as Market Book, market depth, Level 2, - is a dynamically updated table with current volumes of orders to buy and to sell specific financial instument at price levels near Bid and Ask.
MetaTrader 5 provides the means for receiving market book from your broker, but in real time only, without access to its history. The indicator OrderBook Cumulative Indicator accumulates market book data online and visualizes them on the chart. In addition, the indicator can show the market book on the history, by reading archive data, created by OrderBook Recorder. The indicator is based on the library OrderBook History Library, which can be embedded into your expert or indicator.
The archive files can be stored in the data folder of the terminal (usually, it looks like C:\Program Files\MetaTrader 5 MetaQuotes\MQL5\Files), or in the common data folder for all terminals (for example, 'C:\Users\<UserName>\AppData\Roaming\MetaQuotes\Terminal\Common\Files'). In either case, inside the folder another subfolder is used as a root for all market books, and the name of the subfolder is specified in the input parameter OrderBook_FileFolder, by default - "Books". Inside the root subfolder another level of subfolders is created - each subfolder corresponds to a specific work symbol, and every single day data is saved in a file YYYYMMDD.hob, where YYYY, MM, DD are year, month, day correspondingly. The extension "hob" stands for History of Order Book. For example, the ticker GAZP will produce the files MQL5/Files/Books/GAZP/*.hob.
Parameters
- ShowHistory - an option to enable market book view on the history, based on the archive; by default, false - disabled, that is the indicator collects and displays online data;
- ShowHistoryFrom - a date to start searching the archives from while showing market books on the history (when ShowHistory is enabled);
- CharCode - a character code to display indicator's marks; it can be any symbol from the Wingdings font or -1; by default -1, which means that numeric bullets with values from 1 to 10 are displayed, denoting relative volume size;
- AveragingPeriod - a period for averaging values from the market book using exponential moving average, continuously; by default - 0, which means that accumulation and averaging of the data is performed separately for every bar; when a bar is completed, previous statistics are discarded, and volumes are averaged from scratch;
- OrderBook_FileFolder - a name of the root folder, where subfolders and files of the market books are stored; by default - "Books"; every subfolder is named according to specific work symbol;
- OrderBook_UseCommonFiles - an option for reading files from the data folder of the current terminal (false, by default) or from the common data folder for all terminals (true); use the common folder for tests in the local tester;
- OrderBook_TimeZoneCorrection - a correction of date and time, which is required in case, that archives are read in a terminal with a timezone, which differs from a timezone of the terminal where the archives were created; specified in seconds; for example, if the market book was saved with the server time in GMT+3, and then it's applied on quotes from a server, where time is in GMT+2, the correction should be 1 hour (-3600 seconds), because times in GMT+2 go 1 hour late in comparison to (i.e. they are 1 hour smaller than) GMT+3; 15:00 in GMT+3 is 14:00 in GMT+2;


Excellent tool.