Acceleration Fractals
- Indikatoren
-
Vladimir Tkach
 YouTube channel with video manuals https://www.youtube.com/user/tka400/videos
 - Version: 1.0
- Aktivierungen: 20
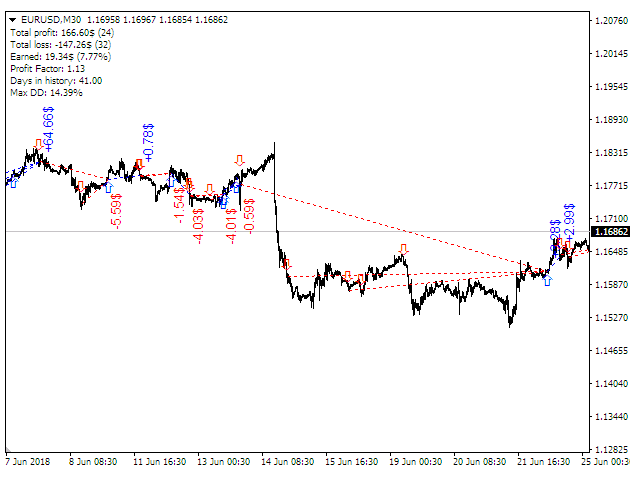
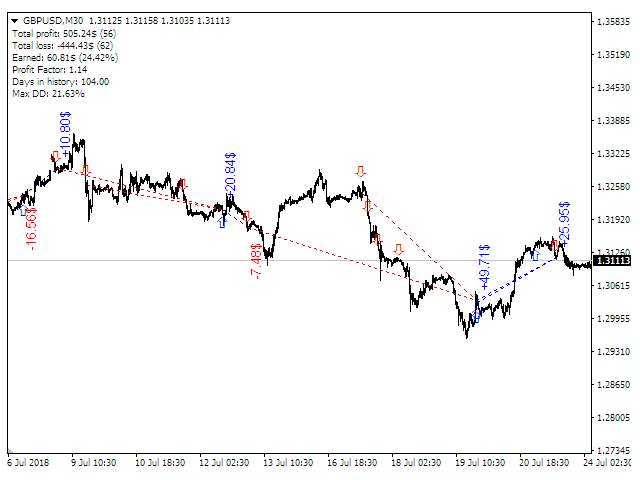
Der Indikator analysiert die Veränderung der Minimal- und Maximalpreise der vorangegangenen Balken, um den Eintritt der großen Akteure festzustellen. Wenn die Veränderung (Delta) zunimmt, wird ein Signal auf dem Diagramm in Form eines Pfeils angezeigt. Gleichzeitig wird ein virtueller Handel mit der Geschichte durchgeführt. Im Falle einer Wiederholung des Signals werden die Positionen aufgestockt (Refilling). So kann die Menge der Positionen variieren. Die Ergebnisse des virtuellen Handels in Form von Verlusten/Verlusten, Rentabilität, Drawdown und Transaktionslinien werden auf dem Preisdiagramm und im Kommentarfeld angezeigt.
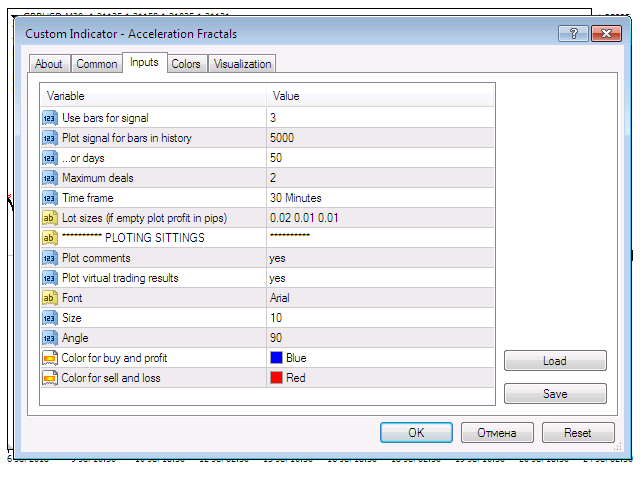
Parameter des Indikators
Balken für das Signal verwenden - die Anzahl der Signalbalken;
Plot signal for bars in history - zeigt Signale und Ergebnisse des virtuellen Handels auf dieser Geschichte;
... oder Tage - die Länge der Historie in Tagen;
Maximale Geschäfte - die maximale Anzahl von unidirektionalen Geschäften, wenn das Signal wiederholt wird (Refills);
Zeitrahmen - verwendete Zeitrahmenbalken;
Lot-Größen (wenn leer Plot Gewinn in Pips) - die Größe des Loses von Transaktionen im virtuellen Handel. Durch die Lücke, können Sie die Höhe der Topping-Positionen. Wenn leer, werden die Ergebnisse des virtuellen Handels in Punkten dargestellt;
Kommentare darstellen - zeigt die Ergebnisse des virtuellen Handels in den Kommentaren an;
Plot virtuelle Handelsergebnisse - zeigt die Ergebnisse des virtuellen Handels auf dem Diagramm in Form von Linien und Ergebnissen der Transaktionen;
Schriftart - die Schriftart der Ausgabeergebnisse ist ein Schnäppchen;
Größe - die Schriftgröße der angezeigten Transaktionsergebnisse;
Winkel - der Winkel der Ergebnisse von Transaktionen;
Farbe für Kauf und Gewinn - Farbe für Linien der Transaktionen für Kauf und positive Ergebnisse der Transaktionen;
Farbe für Verkauf und Verlust - Farbe für die Zeilen der Transaktionen für den Verkauf und negative Ergebnisse der Transaktionen.