Price Pressure
- Indikatoren
- Version: 3.0
- Aktualisiert: 26 April 2022
- Aktivierungen: 10

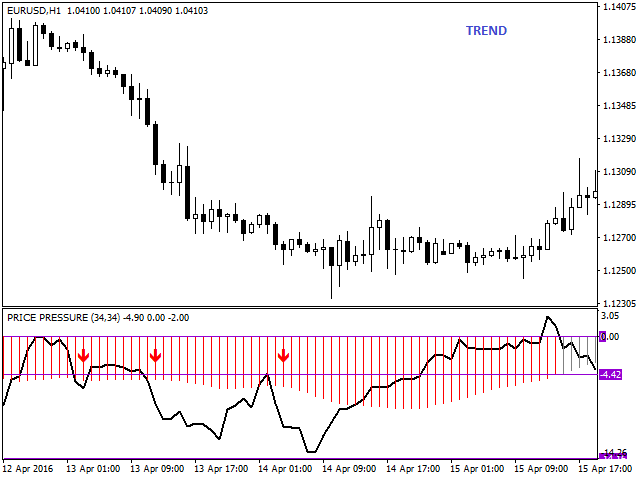
Der Preisdruck-Indikator ist in der Lage, das Gesamtergebnis des Kauf-/Verkaufsdrucks zu bestimmen. Das Ergebnis wird in Average True Range (ATR) Prozent angegeben. Der Preisdruck analysiert die Preisaktion und bestimmt, wie viel Druck bei jeder Kerze vorhanden ist. Kauf- oder Verkaufsdruck ist kumulativ, und je mehr Bären-/Bullenkörper und je größer die Körper sind, desto wahrscheinlicher ist es, dass der Druck einen kritischen Punkt erreicht und die Bullen/Bären überwältigt und den Markt nach unten/oben treibt. Starke Bullen erzeugen Kaufdruck und starke Bären erzeugen Verkaufsdruck. Starke Bullen und Bären sind institutionelle Händler, und die kumulative Wirkung dieser starken Händler bestimmt die Richtung des Marktes.
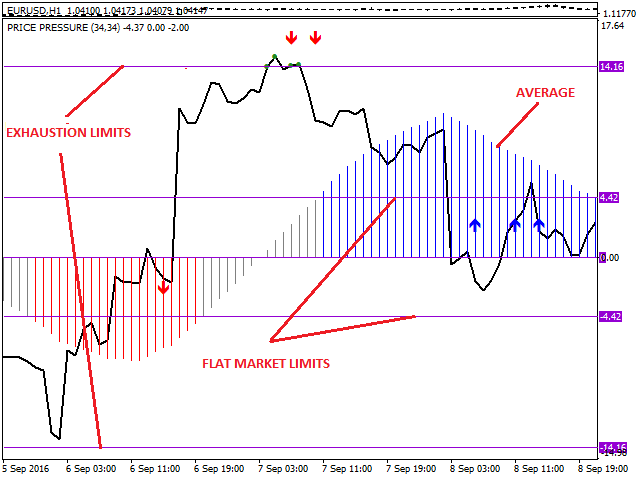
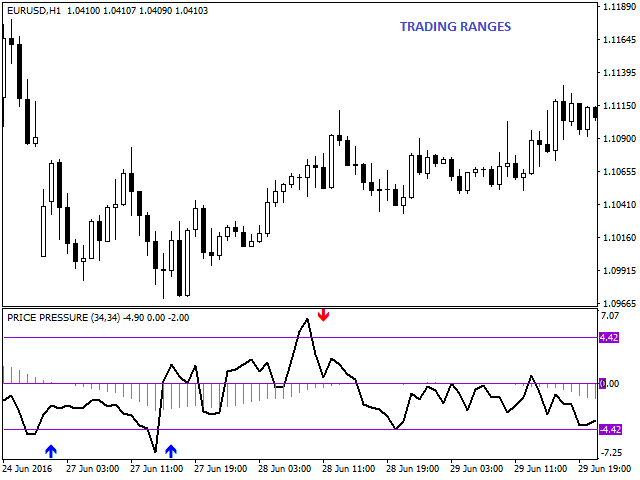
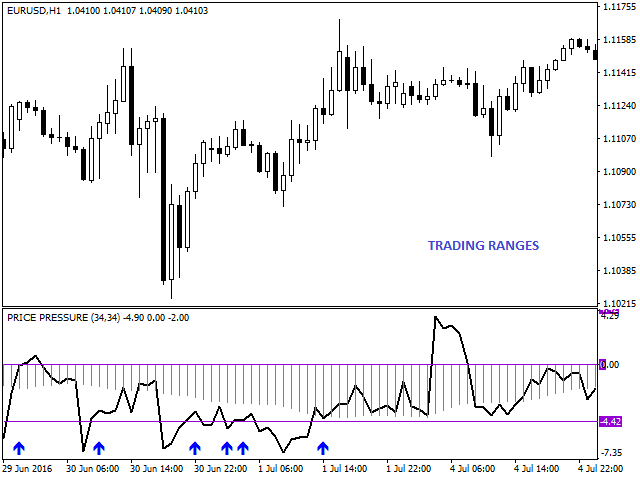
Flache Marktgrenzen
Wenn sowohl die Bullen als auch die Bären in der Lage sind, Positionen einzunehmen, entwickelt sich ein schwankender Markt. Wenn der durchschnittliche Preisdruck im Gleichgewicht bleibt, bedeutet dies, dass weder Bullen noch Bären den Markt kontrollieren. Der Preisdruck-Indikator hat Grenzen, um zu erkennen, wann der Markt flach ist. Wenn der durchschnittliche Preisdruck innerhalb dieser Grenzen liegt, empfiehlt es sich, Ausbrüche zu übergehen. Wenn der Druckdurchschnitt außerhalb dieser Grenzen liegt, befindet sich der Markt im Trend und es wird empfohlen, in Trendrichtung zu handeln.
Erschöpfungs-Grenzwerte
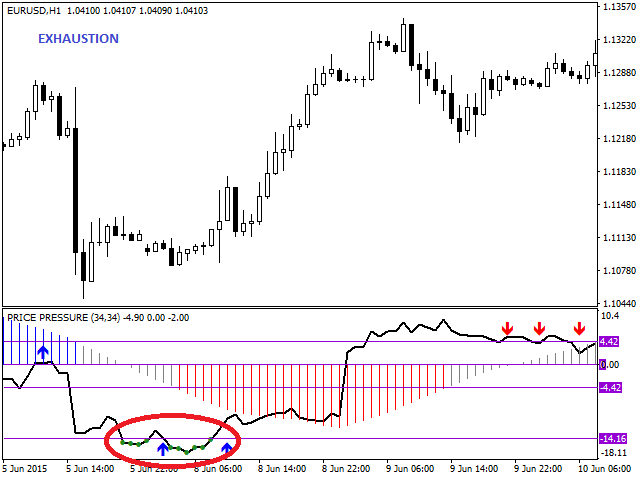
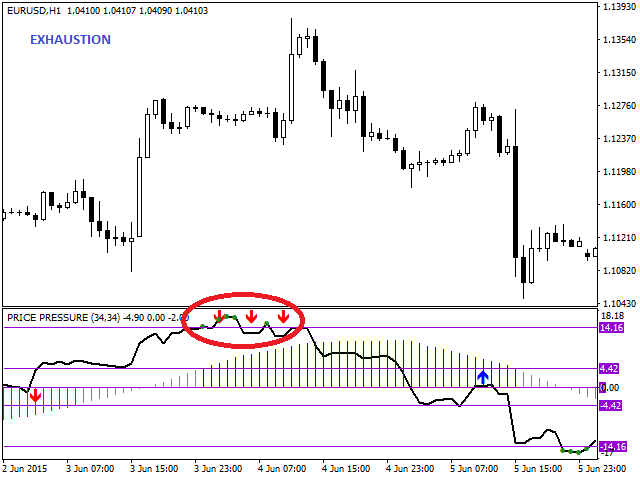
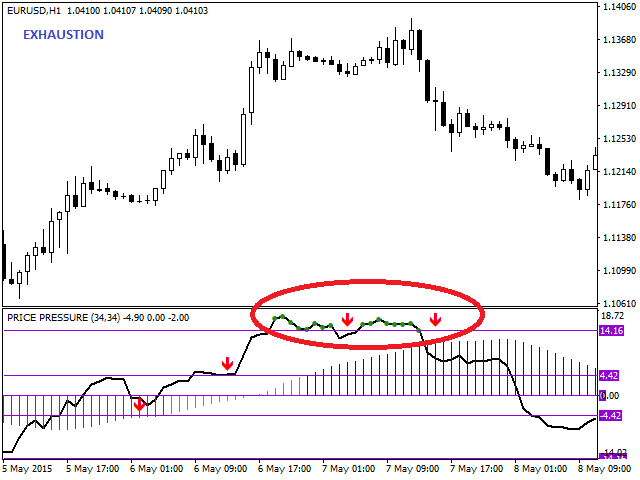
Market Exhaustion ist ein nicht nachhaltiges Verhalten, das als eine Art Höhepunkt betrachtet werden sollte, unabhängig davon, ob eine Umkehr folgt oder nicht. Der Markt tendiert stark und schnell nach oben oder unten, was einen Höhepunkt signalisiert, und der Markt könnte sich jederzeit umkehren.
Wenn der Preisdruck darauf hindeutet, dass sich der Markt im Erschöpfungsmodus befindet, kann der Händler einen Pullback oder sogar eine Umkehr erwarten.
Median-Absolute-Abweichung (MAD)
Price Pressure hat einen Algorithmus für die automatische Berechnung von Flat Market und Exhaustion Limits eingebaut. Der Algorithmus basiert auf der medianen absoluten Abweichung, einer der gängigsten Methoden, um Ausreißer in eindimensionalen Daten zu finden.
WARNUNG: Schalten Sie die automatische Berechnung der Limits aus, wenn Sie den Tester starten. Der Tester wird mit nur 1000 geladenen Balken initialisiert, was eine kleine Stichprobe ist. Ich empfehle mindestens 10000 Balken oder mehr. Die Verwendung von nur 1000 Bars zur Berechnung der Limits wird zu einer Berechnung führen, die das Marktumfeld nicht korrekt widerspiegelt.
Hauptmerkmale
- Anzeige von Flat- und Exhaustion-Limits.
- Anzeige von Einstiegssignalen.
- Adaptiver Oszillator, der in Trend- und Schwankungsmärkten funktioniert.
- Funktioniert auf jedem Symbol und Zeitrahmen.
- Verwendung eines statistischen Ansatzes zur Bestimmung von Flat- und Exhaustion-Limits.
Einstellungen
- Periode - Anzahl der zu analysierenden Balken.
- Durchschnittszeitraum - Anzahl der zu mittelnden Balken.
- Signale anzeigen - Ein-/Ausblenden von Einstiegssignalen.
- Automatische Berechnung von Flat- und Exhaustion-Limits - Schalten Sie die automatische Berechnung von Flat- und Exhaustion-Limits ein/aus.
- Flat Market Limit - Legen Sie manuelle Limits für den Flat-Markt fest. (Wird verwendet, wenn die automatische Berechnung der Limits ausgeschaltet ist)
- Exhaustion Market Limit - Legen Sie manuelle Limits für Exhaustion fest. (Wird verwendet, wenn die automatische Berechnung der Limits ausgeschaltet ist)
Für EA-Entwickler
Verfügbare Puffer:
- Puffer 0 - Preisdruckwert.
- Puffer 1 - Kauf-Einstiegssignal.
- Puffer 2 - Verkaufseinstiegssignal.
- Puffer 3 - Positiver durchschnittlicher Kursdruckwert.
- Puffer 4 - Neutraler durchschnittlicher Preisdruckwert.
- Puffer 5 - Negativer durchschnittlicher Preisdruckwert.
- Puffer 6 - Wert des Erschöpfungspreisdrucks.