Zig Zag 123
- Indikatoren
- Version: 1.3
- Aktualisiert: 30 April 2019

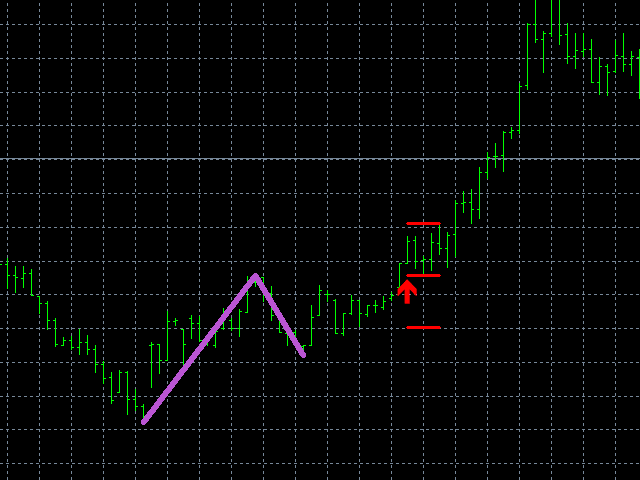
Zig Zag 123 sagt uns, wann eine Umkehr oder Fortsetzung wahrscheinlicher ist, indem wir die Verschiebung von Angebot und Nachfrage betrachten. Wenn dies geschieht, erscheint ein charakteristisches Muster, das als 123 (auch als ABC bekannt) bekannt ist, und bricht oft in Richtung eines höheren Tiefs oder eines niedrigeren Hochs aus.
Es wurden Stop-Loss- und Take-Profit-Levels hinzugefügt. Es gibt ein Panel, das die Gesamtperformance Ihrer Trades anzeigt, wenn Sie diese Stop-Loss- und Take-Profit-Levels verwenden würden.
Wir werden benachrichtigt, wenn ein Muster 123 auftaucht und auch, wenn der Preis unsere Stop-Loss- oder Take-Profit-Levels erreicht, wie sie durch Benutzereingaben festgelegt wurden.
Merkmale:
- Eine effektive Methode, um zu erkennen, wann eine Bewegung bevorsteht
- Wählen Sie Ihre bevorzugte Signalfarbe
- Senden Sie Warnungen entweder an Ihren PC, per E-Mail oder an ein mobiles Gerät
- Funktioniert auf jedem Zeitrahmen
- Kein Nachmalen oder andere übertriebene Behauptungen
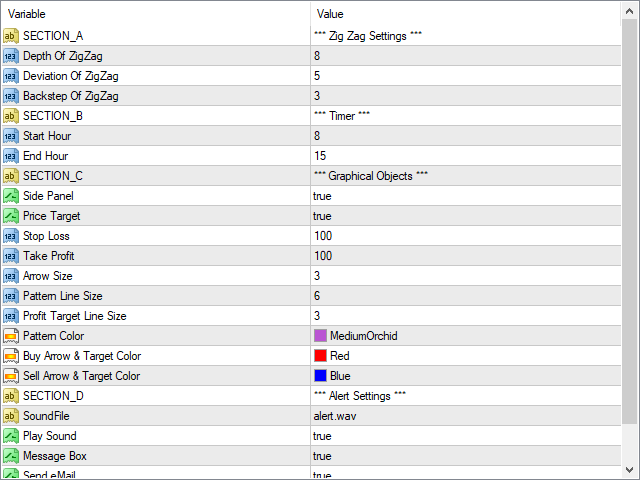
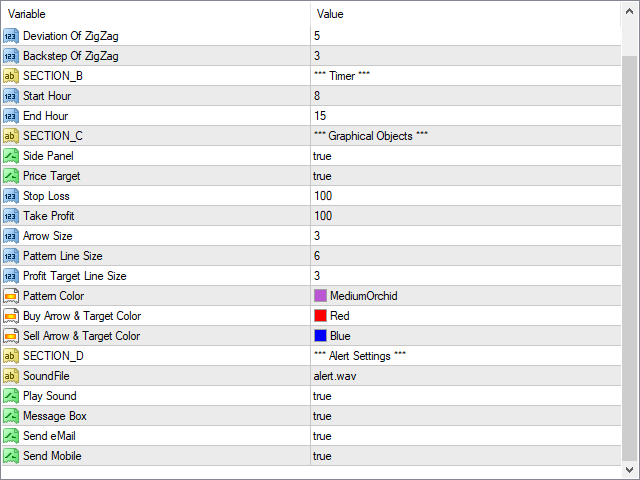
Einstellungen :
ZigZag Einstellungen
- Depth Of ZigZag - Tiefe des ZigZag
- Abweichung - Abweichung von ZigZag
- Rückschritt - Rückschritt von ZigZag
Start Stunde End Stunde
- Start Hour - Wir lassen nur Signale nach dieser Startstunde zu
- End Hour - Wir lassen nur Signale vor dieser Endstunde zu
Grafische Objekteinstellungen
- Seitenpanel - Wenn wir das Seitenpanel ein- oder ausschalten wollen
- Preisziel - Wenn wir möchten, dass Stop Loss und Take Profit Linien erscheinen oder nicht
- Stop Loss - Legt die Stop Loss-Linie in Punkten und nicht in Pips fest
- Take Profit - Legt die Take Profit-Linie in Punkten und nicht in Pips fest
- Arrow Size - Die Größe des Pfeils 1 ist am kleinsten
- Pattern Size - Größe der gezeichneten Linien, die das Muster umreißen
- Profit Size - Größe der gezeichneten Linien, die unsere Stop-Loss- oder Take-Profit-Levels bilden
- Farbe des Musters - Farbe der Linien
- Farbe des Kaufpfeils und des Ziels - Farbe der Kaufpfeile
- Farbe der Verkaufspfeile und des Ziels - Farbe der Verkaufspfeile