Protected highs lows and trend detected MT4
- Indikatoren
-
Minh Truong Pham
 Hello, my name is Pham and I am a programmer and trader! At here, I create amazing forex indicators and expert advisors for Metatrader.
I will try:
+ Provide best tools base on my 5 years experience as a trader and 10 years as a programmer. - Version: 1.10
- Aktualisiert: 31 Dezember 2024
- Aktivierungen: 5
Dieser Indikator stellt einen alternativen Ansatz zur Ermittlung der Marktstruktur dar. Die verwendete Logik ist von Lernmaterial abgeleitet, das von DaveTeaches (auf X)erstellt wurde
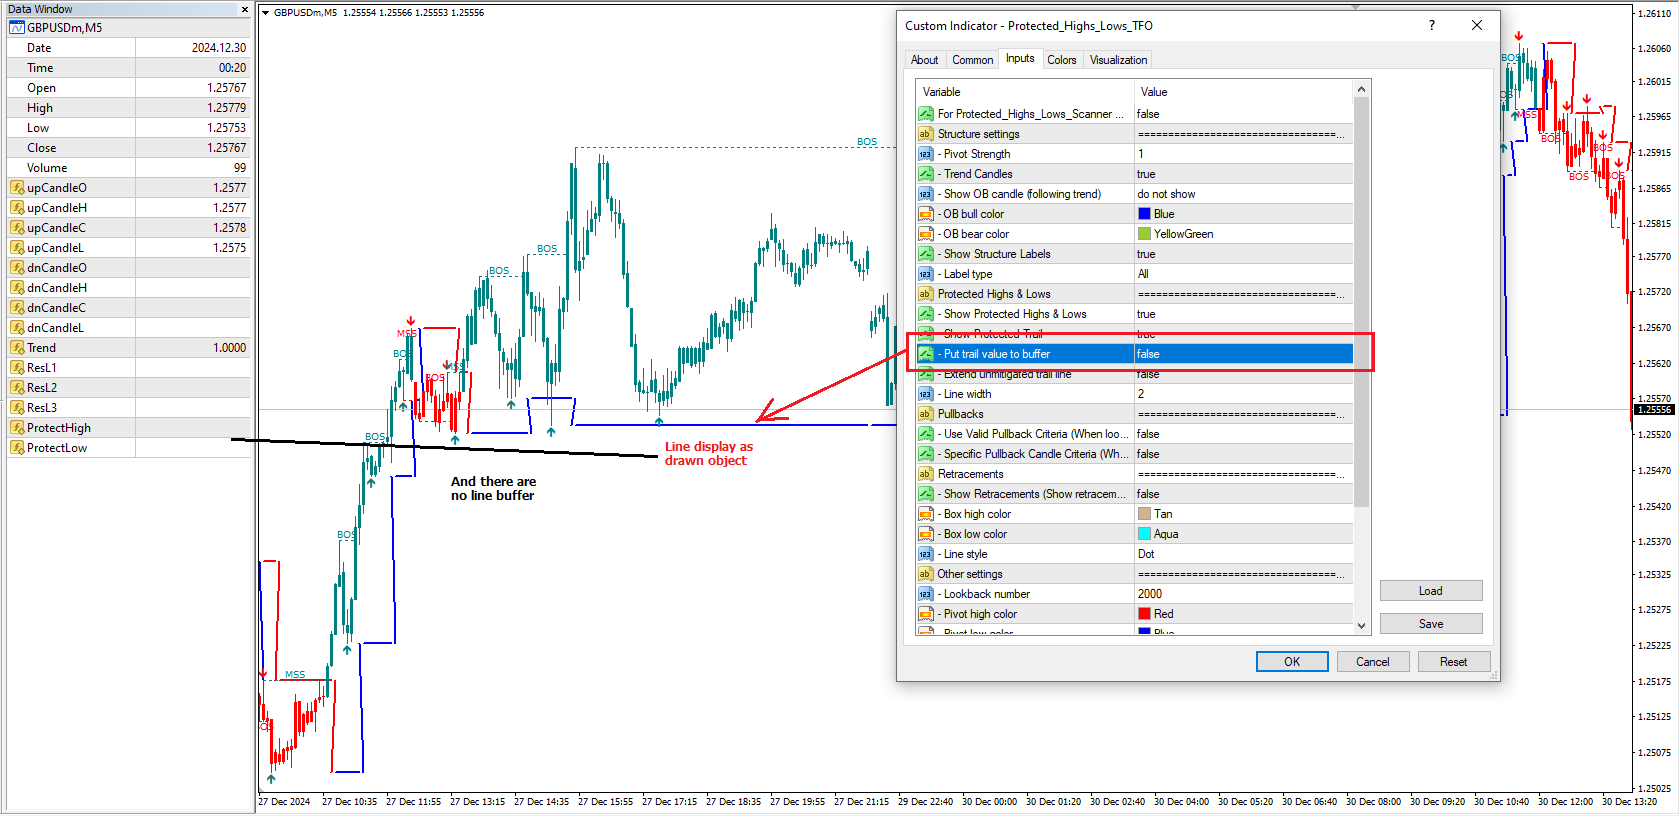
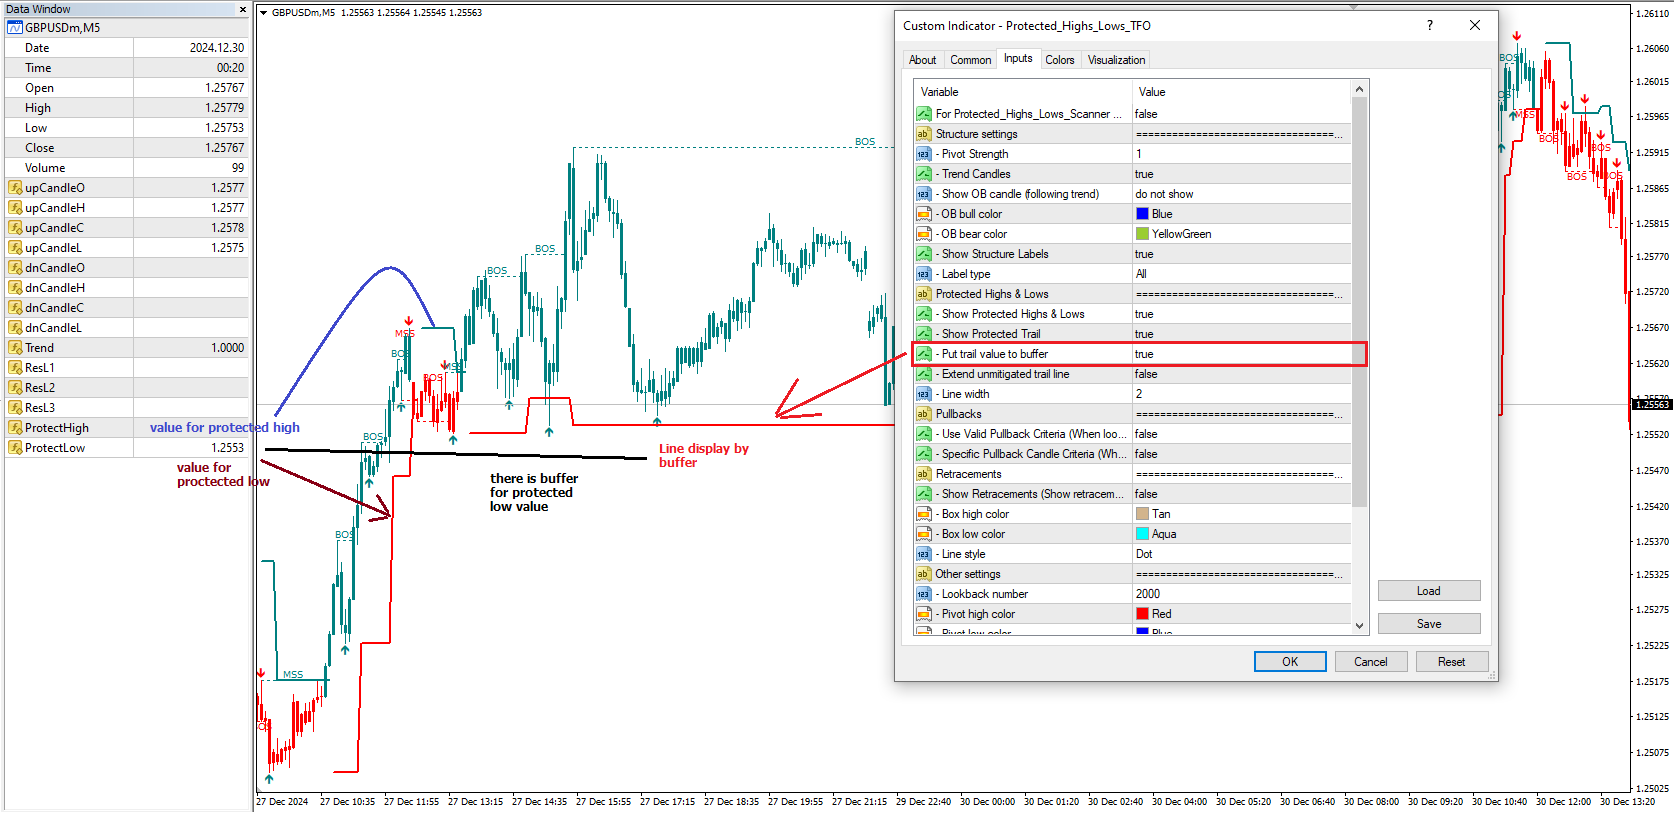
Upgrade v1.10: Option hinzufügen, um geschützte Hoch-/Tiefwerte in den Puffer zu legen (Abbildung 11, 12)
Bei der Quantifizierung der Marktstruktur ist es üblich, fraktale Hochs und Tiefs zu verwenden, um "signifikante" Swing-Pivots zu identifizieren. Wenn der Kurs durch diese Pivots schließt, können wir einen Market Structure Shift (MSS) für Umkehrungen oder einen Break of Structure (BOS) für Fortsetzungen identifizieren. Der Hauptunterschied zu dieser "geschützten" Logik besteht darin, wie wir die Pivots/Levels bestimmen, die zur Ermittlung eines gültigen MSS oder BOS herangezogen werden.
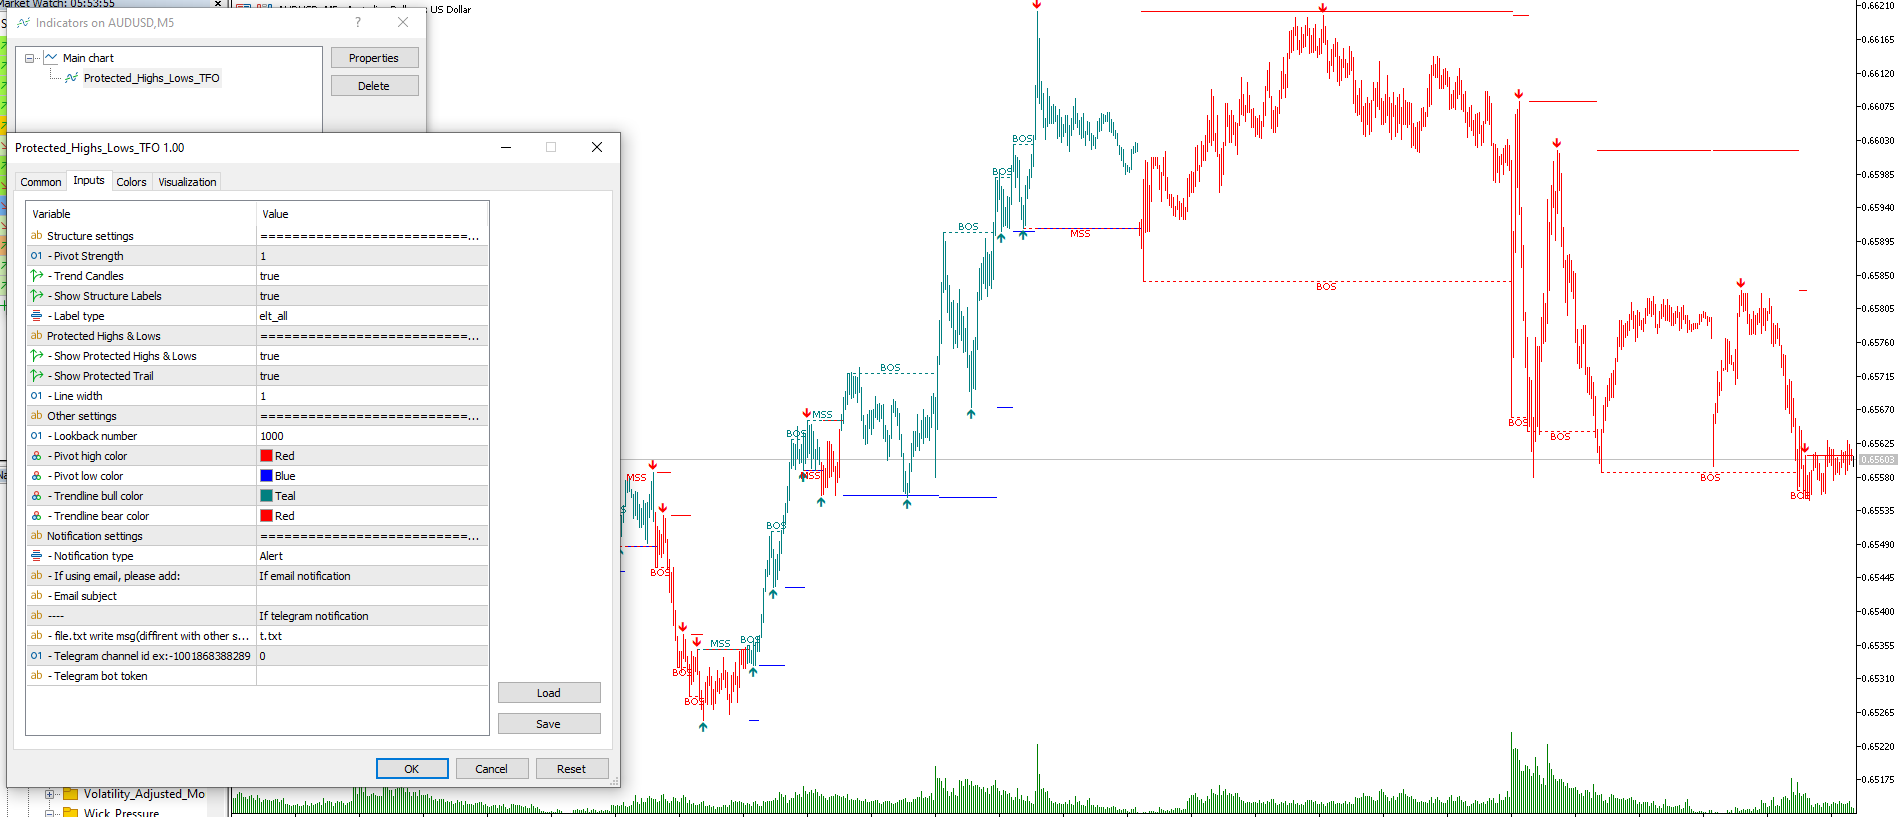
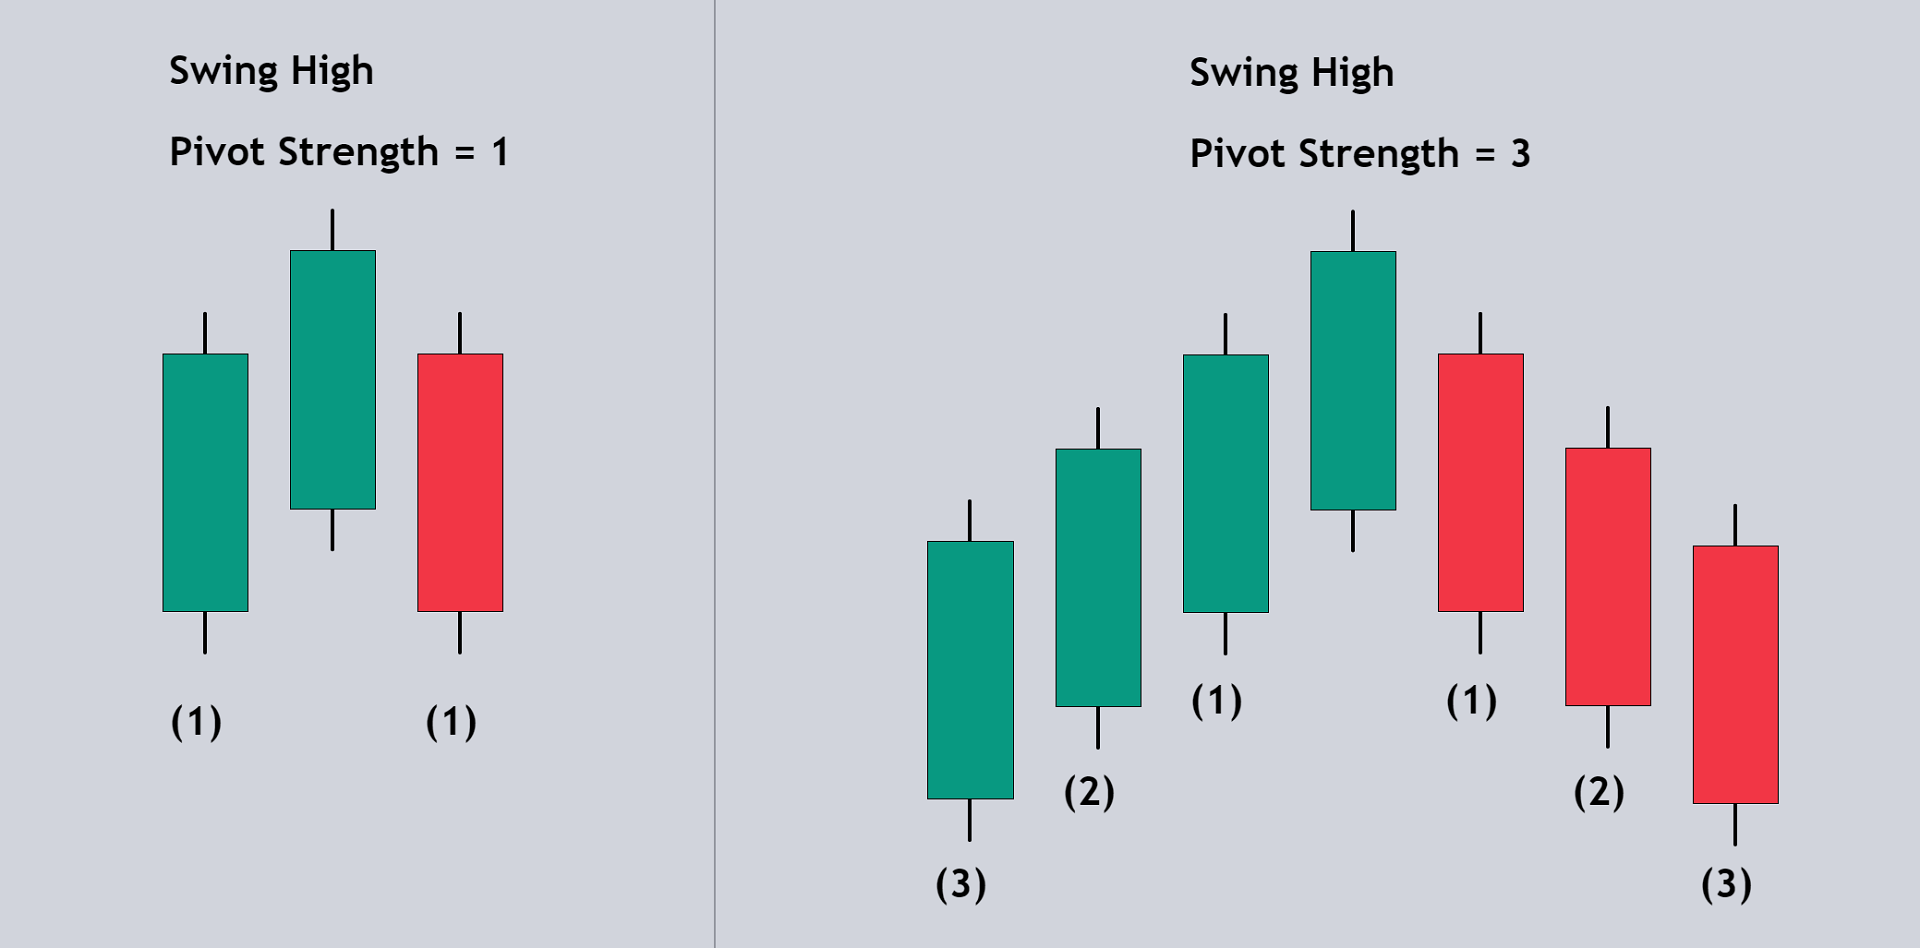
Dennoch wird die Bedeutung unserer Swing-Pivots immer noch durch den Eingabeparameter Pivot Strength bestimmt, der erfordert, dass gültige Swing-Pivots mit so vielen Bars links und rechts davon verglichen werden. Dies ist ein optionaler Parameter, da er standardmäßig auf 1 gesetzt ist. (Abbildung 2)
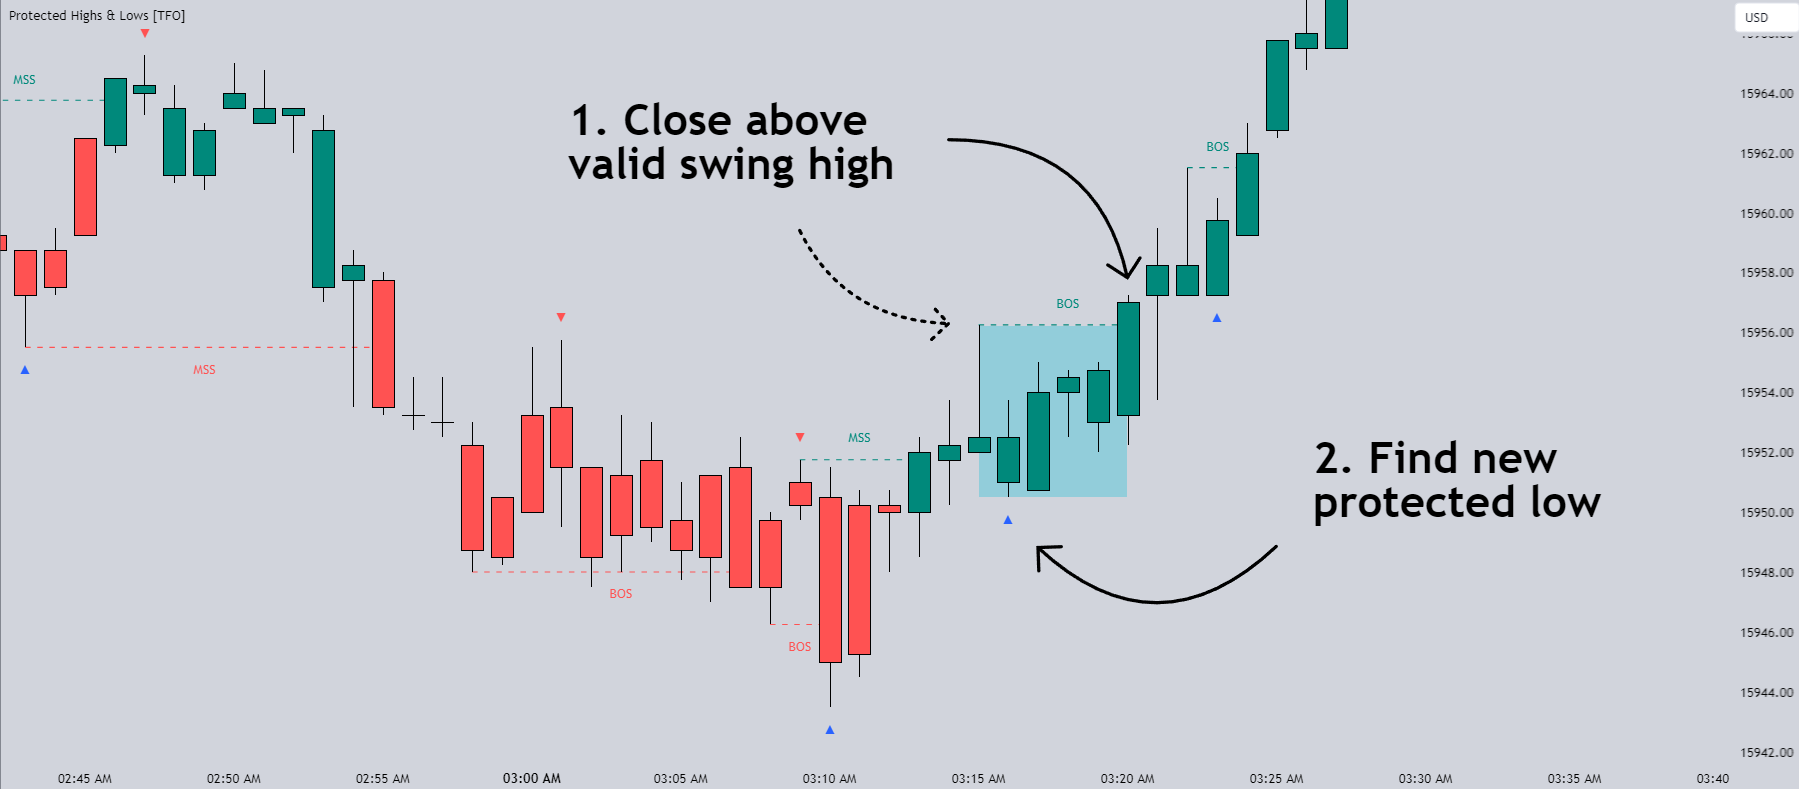
Bei der Identifizierung eines BOS: Wenn der Kurs unter einem gültigen Swing-Tief schließt, schauen wir vom aktuellen Balken zurück, um das höchste Hoch zu finden, das in diesem Bereich erreicht wurde. Wenn der Kurs oberhalb eines gültigen Swing-Hochs schließt, blicken wir vom aktuellen Balken zurück, um das niedrigste Tief in diesem Bereich zu finden, das dann zu unserem geschützten Tief wird.
Beachten Sie, dass diese gültigen Hochs und Tiefs die ersten Swing-Pivots sind, die nach einem MSS/BOS gebildet werden. Wenn der Kurs zum Beispiel ein zinsbullisches BOS/MSS bildet und sich dann ablöst, wird ein Swing-Hoch gebildet. Dieses erste Swing-Hoch muss durchlaufen werden, um ein gültiges BOS zu erhalten. (Abbildung 3)
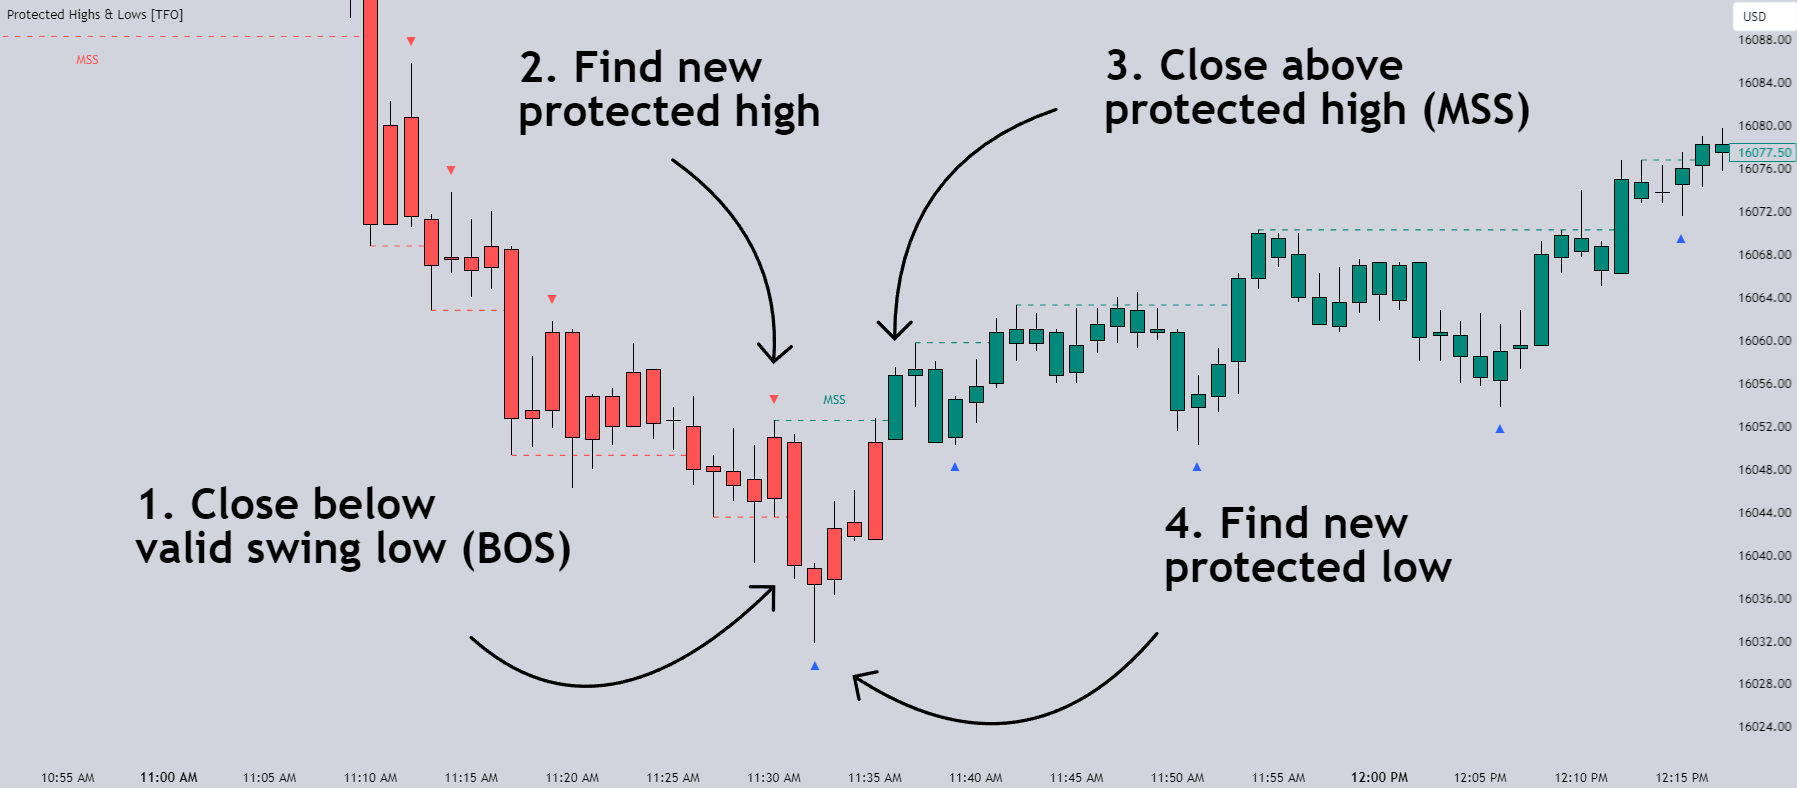
Bei der Identifizierung eines MSS: Wenn der aktuelle Trend bärisch ist und wir nach einer zinsbullischen Umkehr suchen, müsste der Kurs über dem letzten geschützten Hoch schließen. Wenn dies der Fall ist, suchen wir immer noch nach dem niedrigsten Tiefpunkt, der in diesem Bereich gebildet wurde, und machen diesen zu unserem neuen geschützten Tiefpunkt. Bei einer bärischen Umkehrung müsste der Kurs unter dem letzten geschützten Tiefpunkt schließen, was zu einem neuen geschützten Höchststand führen würde (dem höchsten Punkt in diesem Bereich). (Abbildung 4)
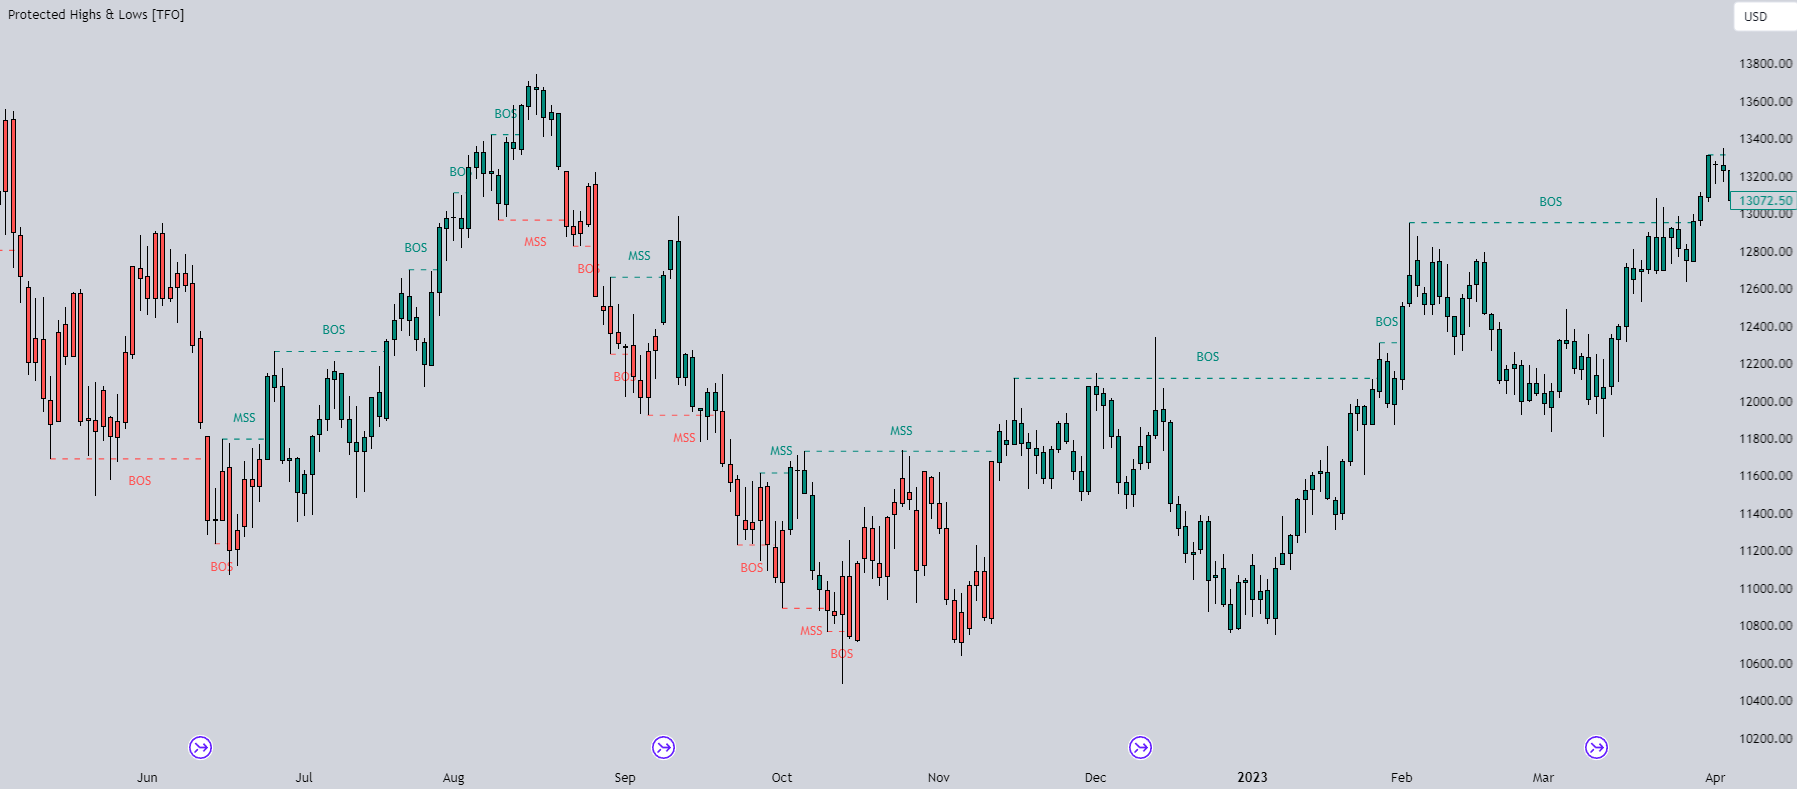
Mit der Option Trendkerzen kann der Benutzer den aktuellen Zustand der Marktstruktur mit bullischen und bearischen Farben leicht visualisieren. Auf Wunsch können auch BOS- und MSS-Labels angezeigt werden. (Abbildung 5)
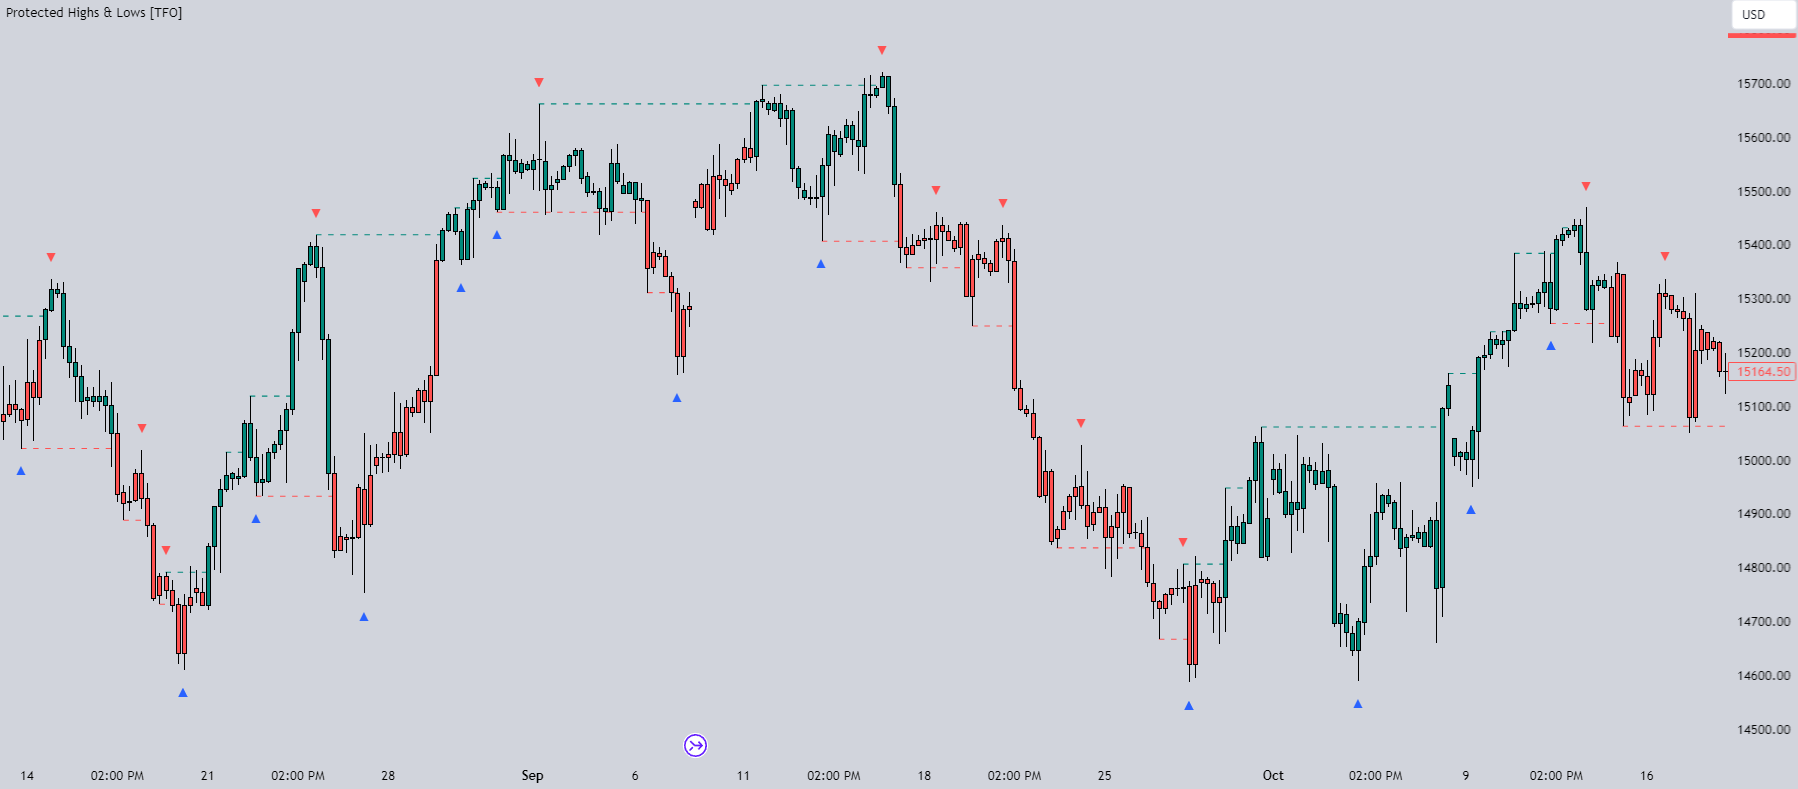
Mit der Option Geschützte Höchst- und Tiefstwerte anzeigen werden die geschützten Höchst- und Tiefstwerte angezeigt. Beachten Sie jedoch, dass die Kennzeichnungen selbst in der Vergangenheit gezeichnet werden, da die Rückblickfunktion erforderlich ist, um sie zu identifizieren. (Abbildung 6)
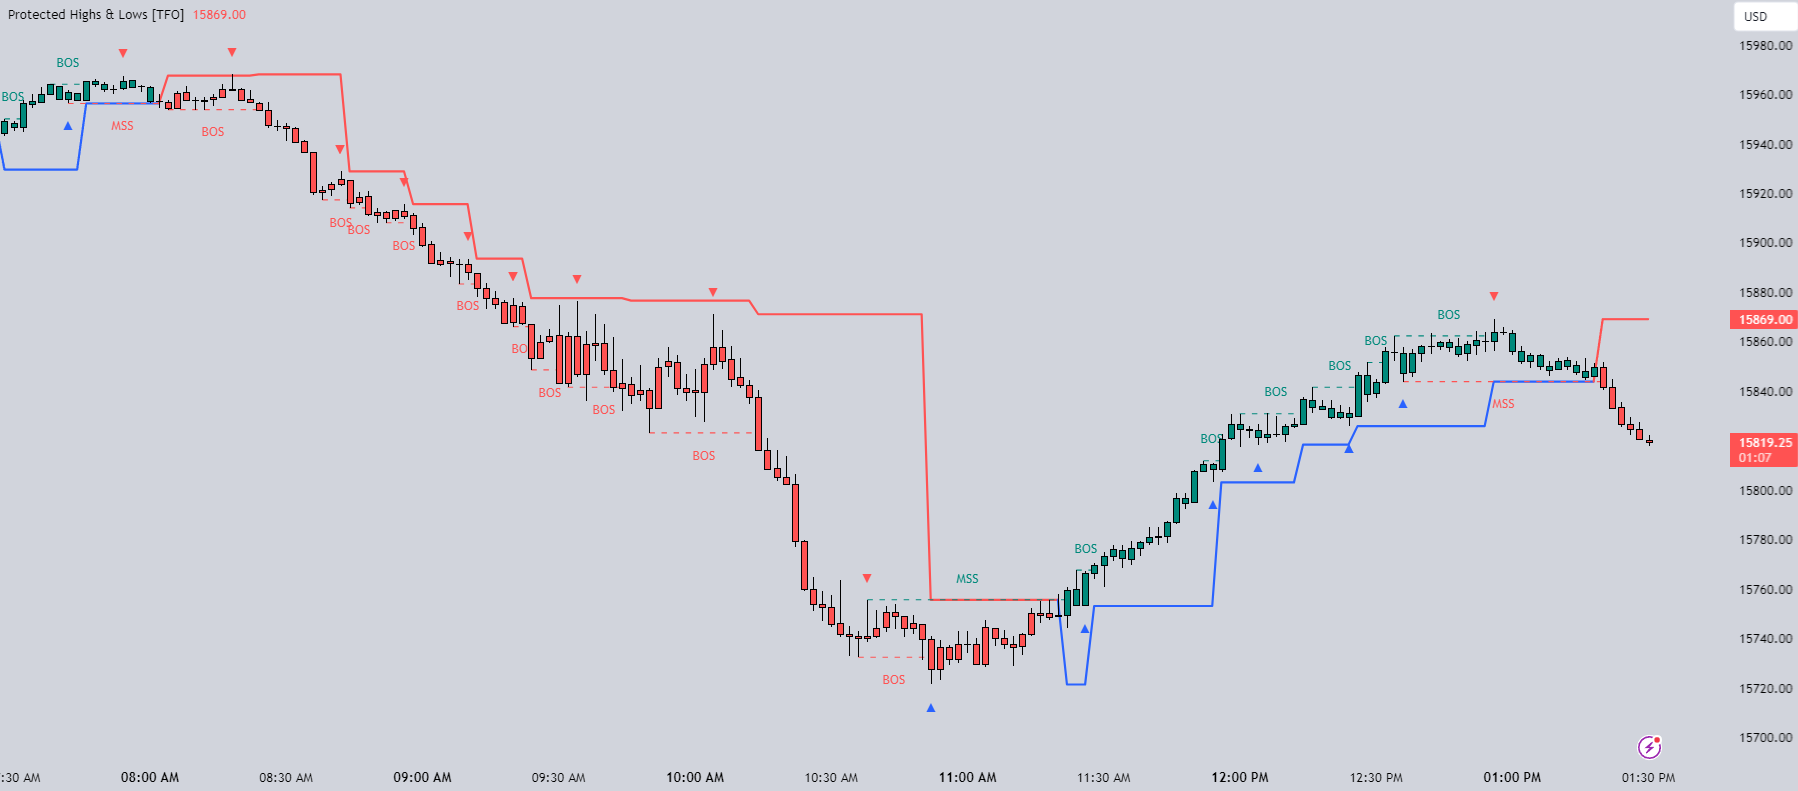
Mit der Option Geschützter Pfad anzeigen schließlich wird eine Linie gezeichnet, die im Wesentlichen eine Art Nachlaufstopp darstellt, um das letzte geschützte Tief (bei Hausse) oder das letzte geschützte Hoch (bei Baisse) zu kennzeichnen. (Abbildung 7)
Aktualisierung
Ab v1.3 kann der Kunde den Trend aus diesem Index über einen Puffer auslesen, um einen Scanner oder EA zu erstellen. Jeder kann den kostenlosen Scanner (mit Quellcode)hier herunterladen.
+ Die Einstellung "For Protected_Highs_Lows scanner" sollte im Visualisierungsmodus false sein.
Ab v1.8
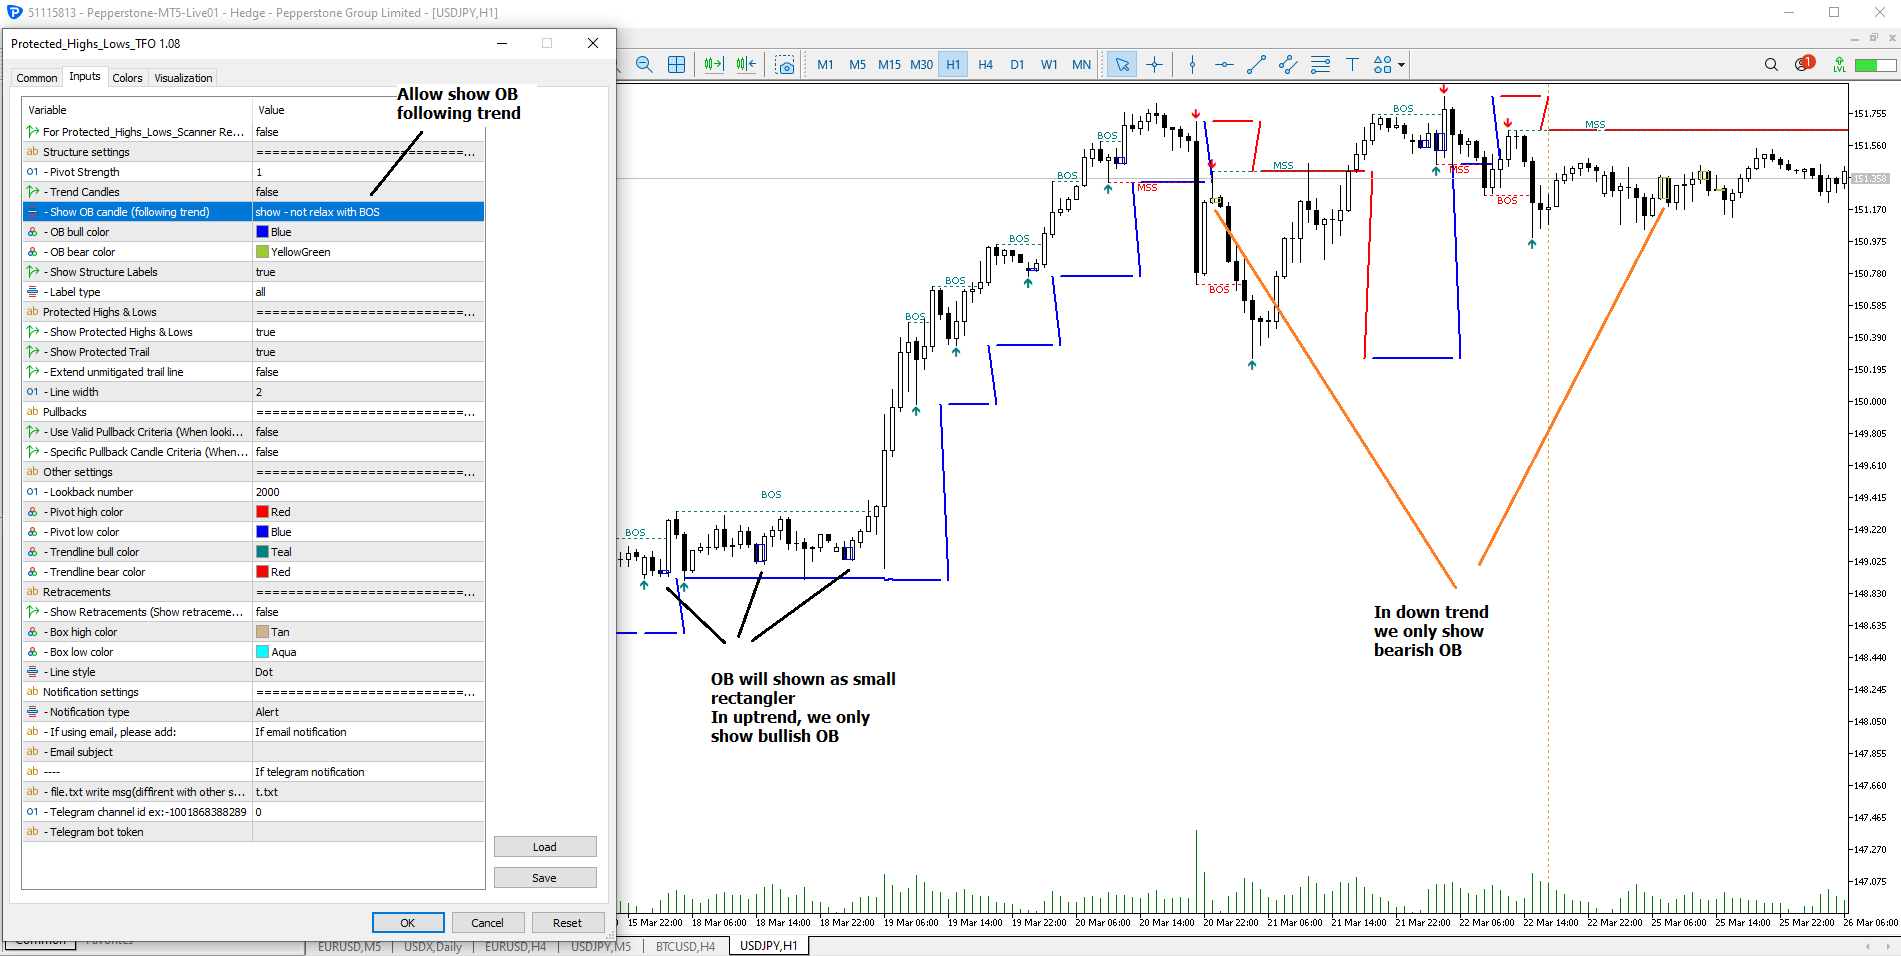
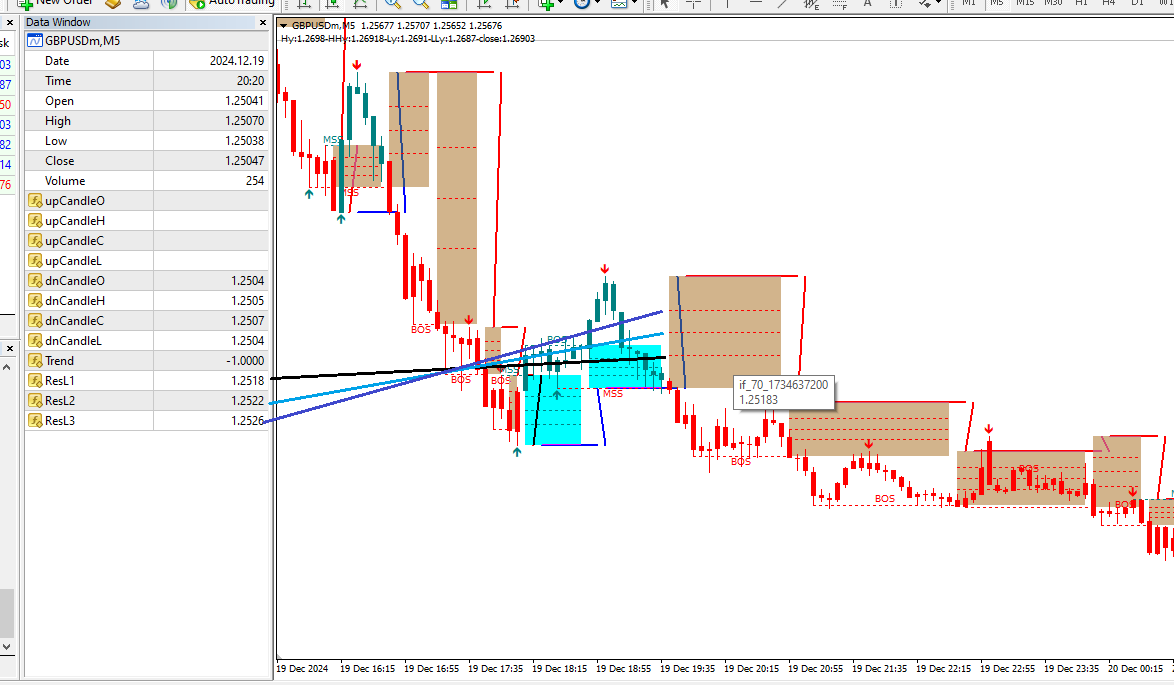
1. Neue Funktion zur Anzeige des Orderblocks je nach Trend hinzugefügt: (Bild 8)
+ Aufwärtstrend => nur bullische OB anzeigen
+ Abwärtstrend => nur bärische OB anzeigen
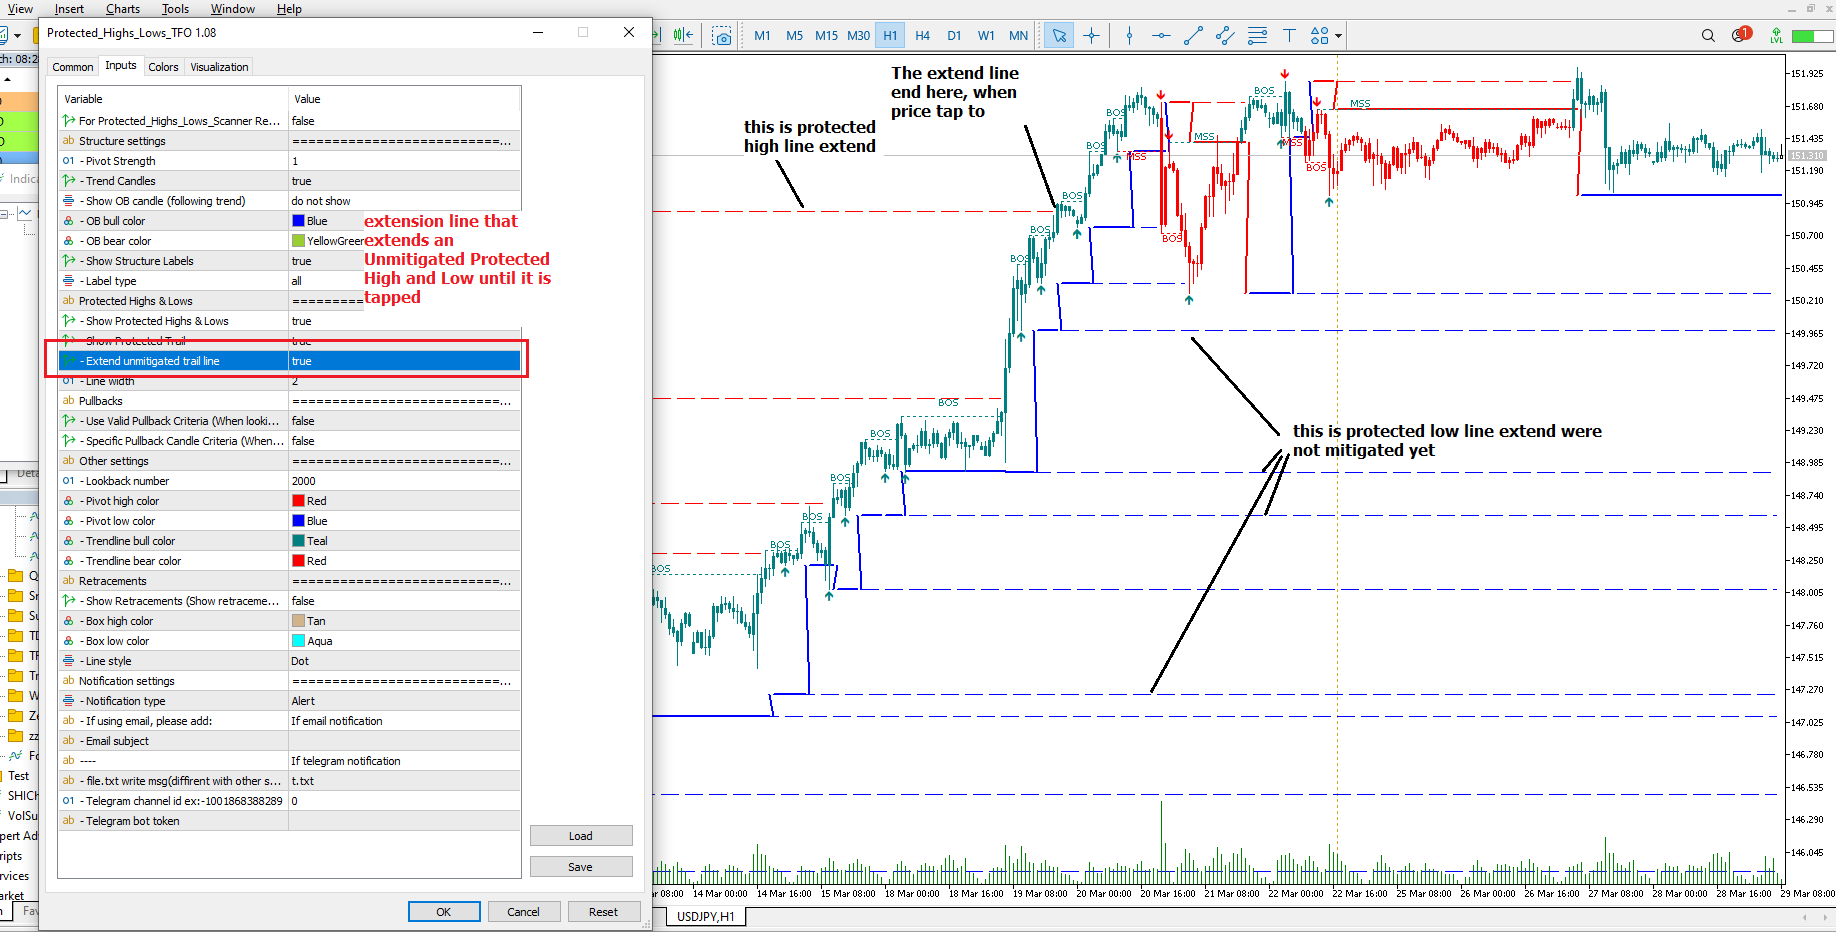
2. Hinzufügen einer Verlängerungslinie, die ein ungeschütztes Hoch und Tief so lange verlängert, bis sie angetippt wird (Abbildung 9)

It's a good indicator. I embed this into my EA and use it as a filter. I think this filtration increases the win rate of almost all other signal. In manual trading, using the show retracement option will help you to get good entry points. If there is an opportunity to update next, please provide the three lines of retracement as buffers.