Two Pairs Square Hedge Meter
- Indikatoren
- Version: 1.1
- Aktivierungen: 5

ZWEI PAARE QUADRAT HECKENMETER INDIKATOR
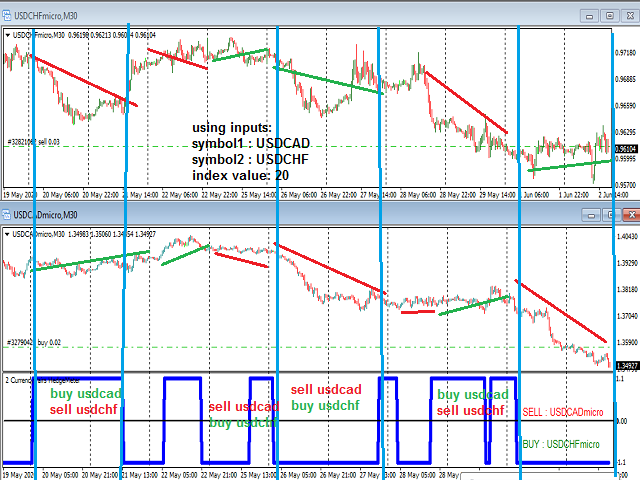
Probieren Sie diesen brillanten 2-Paar-Quadrat-Indikator aus
Er zeichnet eine quadratische Welle der Beziehung zwischen Ihren beiden Eingangssymbolen
wenn die Rechteckwelle -1 anzeigt, dann ist es eine sehr gute Gelegenheit, Paar1 zu VERKAUFEN und Paar2 zu KAUFEN
wenn die quadratische Welle +1 anzeigt, dann ist es eine sehr gute Gelegenheit, Paar1 zu KAUFEN und Paar2 zu VERKAUFEN
die Eingänge sind: 2 Paare von Symbolen
Indexwert: ich verwende 20 für M30 Charts (Sie können andere Werte ausprobieren: 40/50 für M15, 30 für M30, 10 für H1, 300 für M1 .....)
Startpunkte : Anzahl der Balken für die Indikatoren, die in der Vergangenheit gezeichnet wurden : 100001000
Alarme, wenn der Indikator von -1 auf 1 oder von 1 auf -1 wechselt (um alte Positionen zu beenden und neue, entgegengesetzte Positionen einzugeben)