OnBalanceVolumeSurrogate MT5
- Indikatoren
-
Stanislav Korotky
 Trading is just my hobby. I'm working in IT industry. So developement of experts, indicators, and script is not a problem at all to me. Wide range of technologies are used: MQL4, MQL5, system and applied programming, web-services, neural networks and more.
New: - Version: 1.3
- Aktualisiert: 21 November 2021
- Aktivierungen: 5
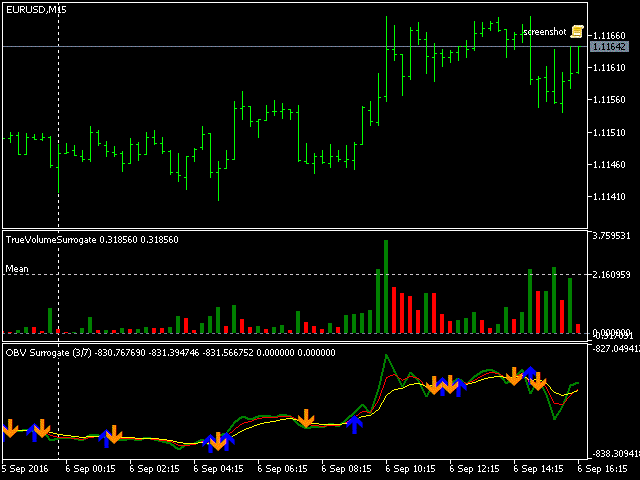
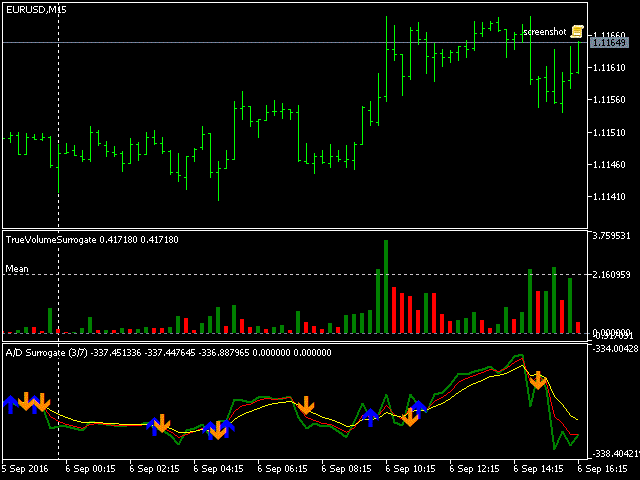
Dies ist eine Sonderausgabe des On-Balance-Volumen-Indikators, der auf pseudo-realen Volumina basiert, die aus Tick-Volumina emuliert werden. Er berechnet eine nahezu reale Schätzung der Verteilung der Handelsvolumina für Forex-Instrumente (bei denen nur Tick-Volumina verfügbar sind) und wendet dann die herkömmliche OBV-Formel auf diese an.
Die Volumina werden mit demselben Algorithmus berechnet, der auch im Indikator TrueVolumeSurrogate verwendet wird. Der Indikator selbst ist nicht erforderlich, kann aber als Referenz verwendet werden.
OnBalanceVolumeSurrogate ist auch für MetaTrader 4 verfügbar.
Parameter
- MAfast - Periode des schnellen gleitenden Durchschnitts (EMA), standardmäßig 3; wenn 0, wird der Durchschnitt nicht berechnet;
- Maslow - Periode des langsamen gleitenden Durchschnitts (EMA), standardmäßig 7; wenn 0, wird der Durchschnitt nicht berechnet;
- AlertOnMAcross - Alarmschalter für das Kreuzen von gleitenden Durchschnitten, standardmäßig - false (Alarm ist deaktiviert); der Alarm wird nur einmal pro Bar signalisiert; Format der Alarmmeldung: "OBVSurrogate [Symbol] [TimeFrame] UP/DOWN cross @ [Time]";
- CompletedBars - Option, die steuert, wie das Kreuzen von gleitenden Durchschnitten überprüft wird: am letzten Bar oder am vorherigen Bar(CompletedBars ist true); standardmäßig - true, so dass Alarme nur bei Bar-Eröffnung generiert werden können; wenn false, können Alarme zu einem beliebigen Zeitpunkt erscheinen; bitte beachten Sie, dass ein Signal über das Kreuzen nach unten nicht notwendigerweise von einem Signal über das Kreuzen nach oben gefolgt wird (oder umgekehrt) - in einigen Fällen, wenn gleitende Durchschnitte nahe beieinander schwanken, können Sie mehrere aufeinanderfolgende Signale (auf verschiedenen Bars) in dieselbe Richtung erhalten - Sie sollten dies als Signalbestätigung betrachten;
- AccumulationDistribution - Option: wenn true, wird der Indikator nach der Accumulation/Distribution-Formel berechnet; standardmäßig - false (OBV wird verwendet); der Indikatortitel im Unterfenster wird entsprechend der Option - OBV Surrogate oder A/D Surrogate - geändert.
Visualisierung
Der Indikator zeigt drei Linien an:
- grün dick - kumulierte Volumina nach der OBV-Formel;
- rot dünn - schneller gleitender Durchschnitt;
- gelb dünn - langsamer gleitender Durchschnitt;
Bei jeder Überschreitung des gleitenden Durchschnitts wird ein Pfeil angezeigt, der ein Signal in die entsprechende Richtung anzeigt. Beachten Sie, dass, wenn CompletedBars falsch ist, die Signale, die auf einem neuen Balken erkannt werden, während er sich bildet, im Widerspruch zur endgültigen Position der Linien stehen können, einschließlich ihrer möglicherweise eliminierten Kreuzung.
Der Screenshot zeigt OnBalanceVolumeSurrogate Seite an Seite mit TrueVolumeSurrogate.
Handel
Der Indikator sollte für den Handel in ähnlicher Weise verwendet werden, wie das herkömmliche OBV verwendet wird:
- durch Signale von sich kreuzenden gleitenden Durchschnitten;
- durch Divergenz/Konvergenz zwischen OBV und Preis; wenn ihre Richtungen widersprüchlich sind, wird eine Umkehr erwartet (der aktuelle Trend wird sich bald ändern);
- durch eine gleichmäßige Bewegung von OBV und Preis; dies ist eine Bestätigung des aktuellen Trends.