Quantum Volume Point of Control Indicator
- Indikatoren
- Version: 5.0
- Aktualisiert: 6 Januar 2025
- Aktivierungen: 5

Der Quantum VPOC-Indikator wurde entwickelt, um die zweidimensionale Studie von Volumen und Preis auf eine dreidimensionale Studie zu erweitern, die auch die Zeit mit einbezieht. Die Beziehung zwischen Volumen, Preis und Zeit bietet dann einen echten Einblick in das Innenleben des Marktes und den Herzschlag der Stimmung und des Risikos, der die Preisaktion entsprechend antreibt.
Der Quantum VPOC-Indikator zeigt mehrere wichtige Informationen auf dem Chart an:
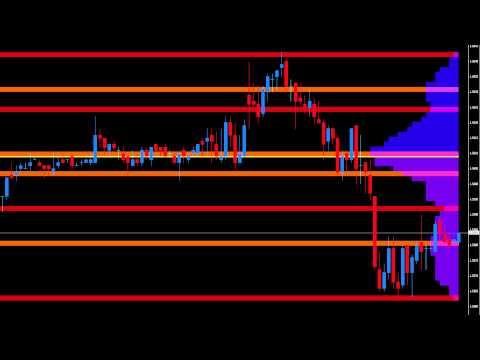
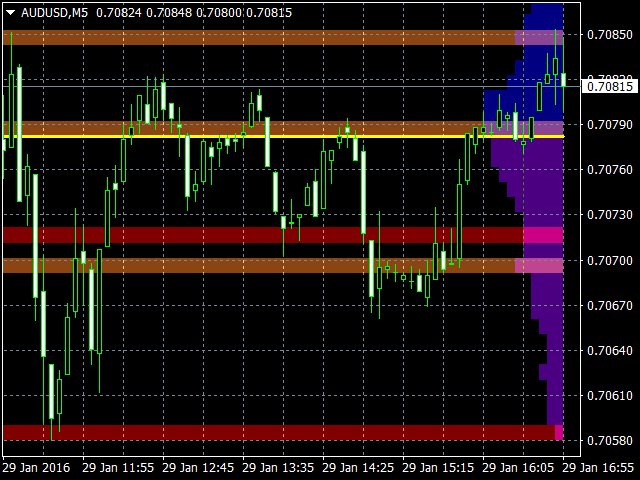
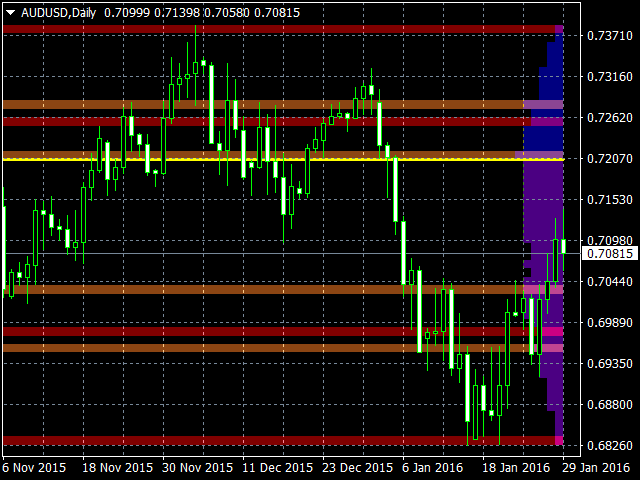
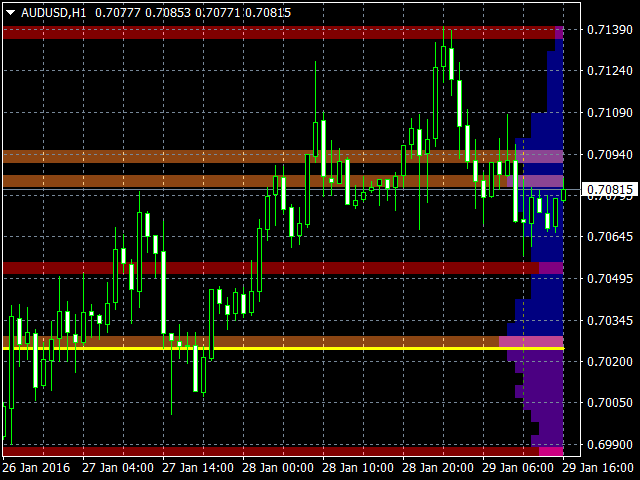
- Volumenprofil - dies erscheint als Histogramm des Volumens auf der vertikalen Preisachse auf der rechten Seite des Charts. Die Höchst- und Tiefstwerte werden deutlich angezeigt, wobei die Knotenpunkte mit hohem und niedrigem Volumen hervorgehoben werden.
- Knotenpunkt mit hohem Volumen (HVN) - Hier gibt es eine Ausbuchtung im Volumenprofil, die im Allgemeinen auf eine längere Phase der Preisstauung zurückzuführen ist. Wenn sich der Markt diesen Regionen auf dem Diagramm nähert, werden die Kurse wahrscheinlich in einen Stau geraten, wobei der Knoten als starker Unterstützungs- oder Widerstandsbereich fungieren kann. Da wir in der Vergangenheit eine starke Preisakzeptanz auf diesem Niveau gesehen haben, ist es wahrscheinlich, dass sich dies wiederholt und der Markt in einer Spanne schwankt. Letztendlich könnte der Markt von diesen Niveaus aus einen Rückwärtsgang einlegen, wobei jede Bewegung durch diese Niveaus die aktuelle Stimmung bestätigen würde.
- Knotenpunkt mit geringem Volumen (LVN) - Hier wird ein geringes Volumen im Volumenprofil angezeigt. In diesen Regionen hat der Markt nur eine vorübergehende Pause eingelegt, d. h. es handelt sich um eine Region, in der der Preis in der Vergangenheit abgelehnt wurde. Daher ist es wahrscheinlich, dass sich der Markt schnell durch diese Regionen bewegt, da es kaum Widerstand oder Unterstützung gibt, die einen weiteren Kursrückgang verhindern könnten. Die derzeitige Stimmung wird sich wahrscheinlich fortsetzen und sich schnell durch diese Niveaus aufbauen.
- Unterstützungs- und Widerstandszonen - diese werden an den Knotenpunkten mit hohem und niedrigem Volumen eingezeichnet, um die verschiedenen HVN- und LVN-Niveaus auf der Preisachse hervorzuheben.
- Volumen-Kontrollpunkt-Linie - diese wird als einzelne Linie auf dem höchsten Volumen des Hochvolumen-Knotens im Zeitrahmen eingezeichnet und definiert eindeutig den Kipppunkt der Stimmung. Diese Linie bewegt sich dynamisch und stellt den Dreh- und Angelpunkt der Marktstimmung dar. Liegt sie oberhalb der Kursbewegung, ist die aktuelle Marktstimmung bearish. Liegt sie unter dem aktuellen Kursgeschehen, ist die aktuelle Marktstimmung optimistisch. Die VPOC-Linie zeigt dieses Gleichgewicht einfach, schnell und klar an, so dass Sie die Marktstimmung mit Genauigkeit und Zuversicht beurteilen können.
Der Quantum VPOC-Indikator verfügt über mehrere einzigartige Funktionen, die Ihnen dabei helfen, den Markt zu verstehen und mit ihm zu handeln, anstatt gegen ihn.
- Der Indikator ist dynamisch, d. h. die Ausgabe ändert sich allmählich, wenn neue Volumendaten eingehen, so dass Sie sicher sein können, nur die relevantesten Signale zu erhalten.
- Zu den fortschrittlichen Funktionen gehört die Möglichkeit, den Zeitrahmen der Datenquelle zu ändern, was sich hervorragend für die Analyse mehrerer Zeitrahmen eignet. Dies gibt Ihnen die Möglichkeit, verschiedene Zeitrahmen schnell und einfach mit dem zugehörigen VPOC zu sehen.
- Die beiden Seiten des Volumenprofils sind unterschiedlich eingefärbt und durch die Linie des Volume Point of Control getrennt, um eine intuitive und schnelle Analyse des Charts zu ermöglichen. Die obere Seite ist standardmäßig blau und die untere Seite ist standardmäßig lila.
- Es werden zwei Arten von Unterstützungs- und Widerstandszonen generiert, die aus Geschwindigkeitsgründen wiederum unterschiedlich eingefärbt sind. High Volume Nodes (HVN) sind in einem helleren Orangeton eingefärbt - Low Volume Nodes (LVN) in einem dunkleren Orangeton.
- Die Anzahl der Unterstützungs- und Widerstandszonen ist bei einem bestimmten empfohlenen Bereich einstellbar.
- Die Balken des Volumenprofils können schmaler oder breiter eingestellt werden.
- Die Periode (Anzahl der verarbeiteten Balken) kann nach Belieben eingestellt werden.
- Das Volumenprofil, die Unterstützungs- und Widerstandszonen und der Volumen-Kontrollpunkt können je nach Ihren Wünschen ein- und ausgeschaltet werden.
- Die Farben des Volumenprofils, der Unterstützungs- und Widerstandszonen und der Volumen-Kontrollpunkt-Linie können an Ihre persönlichen Vorlieben angepasst werden.
Der Quantum VPOC-Indikator ist dynamisch und ändert sich ständig mit jedem eingehenden Tick. Er funktioniert in allen Zeitrahmen und bietet ein leistungsfähiges und viel tieferes Verständnis von Unterstützung und Widerstand durch das Prisma des Volumens und der damit verbundenen High und Low Volume Nodes, wobei der Point of Control selbst als Dreh- und Angelpunkt des Marktes fungiert.


The VPOC is Very powerful & accurate...I mostly use it for support & resistance levels & it has never predicted any wrong level. Thanx much💪💪💪