POWR Support Resistance Zones
- Indikatoren
- Version: 1.0
- Aktivierungen: 5

Sicherlich ist dieser Indikator unter den Händlern sehr beliebt geworden. Durch die Kodierung dieses Indikators erhalten Sie die genauesten Werte für Ihre Handelsanalyse. Wir haben auch die Möglichkeit eingebaut, Sie zu benachrichtigen, wenn der Kurs eine Unterstützungs- oder Widerstandslinie über- oder unterschreitet!
ANWENDUNG
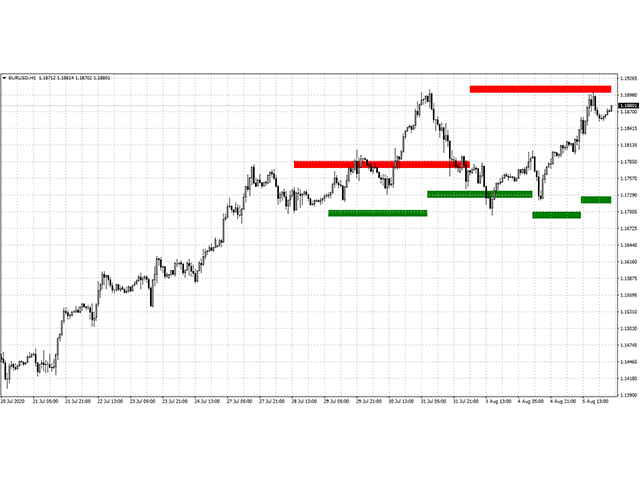
- Die roten Rechtecke stellen Ihre Widerstands-/Angebotszone dar.
- Die grünen Rechtecke stellen Ihre Unterstützungs-/Nachfragezone dar.
BONUS-FEATURES
Wir haben diesen Indikator so kodiert, dass er zwischen Standard-, Minor- und Major-Support/Resistance-Zonen umschalten kann, um Ihnen die genauesten Niveaus für Ihre Handelsanalyse zu liefern. Wir haben auch die Möglichkeit eingebaut, Sie zu benachrichtigen, wenn der Kurs eine Unterstützungs- oder Widerstandslinie über- oder unterschreitet!