Quantum Dynamic Support and Resistance Indicator
- Indikatoren
- Version: 5.0
- Aktualisiert: 6 Januar 2025
- Aktivierungen: 5

Wenn Sie sich schon länger mit dem Handel befassen, sind Sie sicherlich schon einmal mit dem Konzept der Unterstützung und des Widerstands in Berührung gekommen. Dieses leistungsstarke und einfache Konzept ist das Herzstück der technischen Analyse. Es bildet den Eckpfeiler des Price Action Trading.
Es ist daher verwunderlich, dass eine solche Schlüsselkomponente des Händlercharts weitgehend ignoriert wird. Die meisten Devisenhändler zeichnen ihre Linien immer noch manuell, was zu einer groben Interpretation dieser Schlüsselniveaus führt. Selbst diejenigen Unternehmen, die einen Handelsindikator entwickelt haben, haben eine ebenso grobe Interpretation entwickelt. Zweifellos haben Sie sie schon gesehen. Im Allgemeinen erscheinen sie als breite Bänder auf dem Diagramm, die vage Bereiche mit Staus und damit verbundenen Unterstützungs- und Widerstandsbändern anzeigen. Diese sind praktisch nutzlos. Es fehlt ihnen an Präzision oder Definition.
Warum also hat noch nie jemand Unterstützung und Widerstand als dynamisch betrachtet? Würde ein dynamischer Indikator nicht gerade dort hochwertige Informationen liefern, wo man sie am meisten braucht - am Rande des Marktes?
Nun, vielleicht hat noch nie jemand auf diese Weise darüber nachgedacht. Schließlich ist die Preisbewegung dynamisch. Wären Unterstützung und Widerstand nicht noch leistungsfähiger und nützlicher, wenn sie ebenfalls als dynamisch und nicht als historisch betrachtet würden? Vielleicht haben Sie das auch schon gedacht. Vielleicht haben Sie sich gefragt, ob jemand einen solchen Indikator entwickeln könnte!
Nun, das haben wir uns auch gedacht, und hier ist er nun endlich - der Quantum Dynamic Support and Resistance Indikator. Der erste und einzige dynamische Unterstützungs- und Widerstandsindikator der Welt. Endlich steht Ihnen auf Ihrer MT4-Plattform ein Indikator zur Verfügung, der die für Sie als Devisenhändler so wichtigen Bereiche von Kursunterstützung und -widerstand wirklich punktgenau definiert.
Es handelt sich um einen äußerst leistungsfähigen Indikator, der die Richtung der Kurse zu jedem beliebigen Zeitpunkt anzeigt. Für die meisten Händler ergibt sich der Gewinn beim Handel aus der genauen Bestimmung von Unterstützungs- und Widerstandsniveaus. Mit diesem Indikator können Sie GENAU feststellen, wo und wann sich der Preis nach oben oder unten bewegt, und so die Möglichkeit haben, dies zu beurteilen:
- Optimale Einstiegsniveaus
- Sichere Ausstiegsniveaus
- Angemessene Stop-Loss-Niveaus
- Ausgezeichnete Take-Profit-Levels
Aber wie bei allen Quantum Trading-Indikatoren gibt es noch mehr, sehr viel mehr!
- Der Indikator macht keinen Unterschied zwischen Unterstützung und Widerstand. Ein bestimmtes Kursniveau, das jetzt als Unterstützung fungiert, kann in der nächsten Sitzung ein Widerstand sein. Jede Linie beeinflusst die Kursbewegung für das gesamte Diagramm.
- Er ist unglaublich genau - fast wie Magie
- Der Indikator ist dynamisch, d. h. die erzeugten Unterstützungs- und Widerstandslinien stimmen mit dem aktuellen Kursgeschehen überein
- In Verbindung mit dem Quantum Dynamic Price Pivots-Indikator wird der Quantum Dynamic Support and Resistance-Indikator noch leistungsfähiger
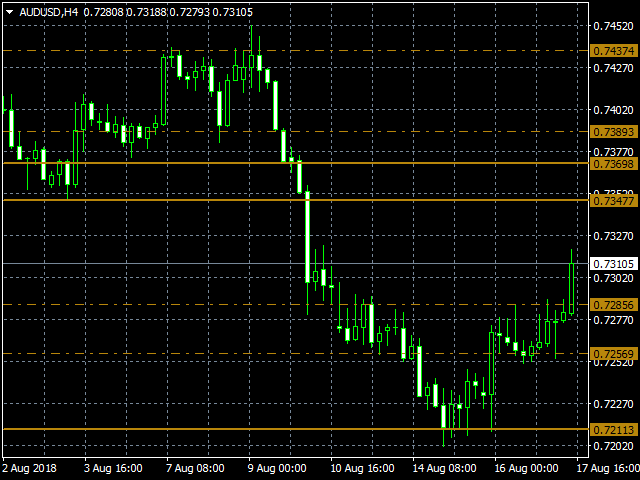
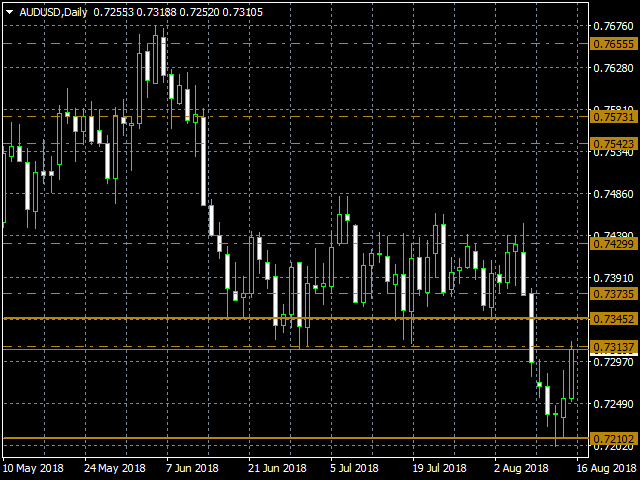
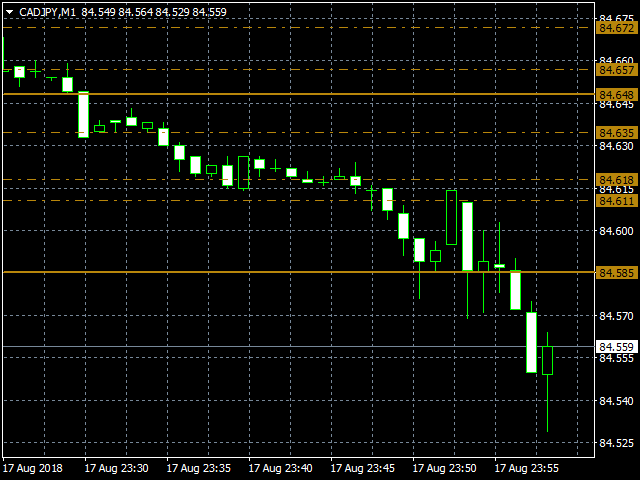
Der Indikator zeigt die verschiedenen Niveaus auf zwei verschiedene und unterschiedliche Arten an. Erstens mit gepunkteten Linien und zweitens mit durchgezogenen Linien. Die gepunkteten Linien stellen Niveaus dar, bei denen der Preis mindestens einmal getestet wurde, während die durchgezogenen Linien Niveaus darstellen, bei denen der Preis mehrmals getestet wurde.
Während die einzelnen Linien des Indikators Ihre Handelsentscheidungen punktgenau abbilden, definieren Cluster diese sehr starken Kursniveaus, und diese können entweder Cluster aus gepunkteten Linien oder Cluster aus durchgezogenen Linien sein. Ein Cluster aus durchgezogenen Linien signalisiert natürlich, dass sich ein extrem starker Bereich des Preiswiderstands oder der Unterstützung gebildet hat.
In dem Maße, in dem sich die Cluster bilden, wächst auch die Stärke dieser Kursniveaus, was Ihnen volles Vertrauen in Ihre Handelsentscheidungen gibt. Sie können dies live auf Ihren Charts beobachten, während sich die Preisbewegung entfaltet. Eine so einfache Idee, und doch so wirkungsvoll.
Kein Rätselraten mehr. Keine groben Linien oder vagen Bereiche auf dem Chart mehr. Jetzt ist alles klar und präzise definiert. Egal, ob Sie die einzelnen Linien für den Präzisionshandel oder die Cluster für die längerfristige Entscheidungsfindung verwenden - es ist alles da - in einem einzigen Indikator.