Quantum Dynamic Price Pivots Indicator for MT5
- Indikatoren
- Version: 2.0
- Aktualisiert: 6 Januar 2025
- Aktivierungen: 5

Aufstrebende Price-Action-Trader können das schnelle Lesen eines Kerzencharts erlernen, aber es dauert Jahre, bis sie diese Fähigkeit perfektioniert haben. Für weniger Sterbliche ist Hilfe erforderlich, und hier kommt der Quantum Dynamic Price Pivots-Indikator ins Spiel, um zu helfen.
Als Frühindikator, der ausschließlich auf Kursbewegungen basiert, liefert der Indikator einfache, klare Signale in Hülle und Fülle und zeigt potenzielle Umkehrungen mit klinischer Effizienz auf. Genau wie Volumen und Preis sind Pivots ein weiterer "prädiktiver" Indikator und ein Frühindikator für das Kursverhalten. Und dies ist nur der Ausgangspunkt für den "Schweizer Taschenmesser"-Indikator.
Mit Hilfe von Pivot-Punkten lassen sich dann Stau-Phasen in der Kursentwicklung erkennen, da sie dynamisch entstehen, und Trends definieren, ebenfalls in Echtzeit. Nicht zu vergessen sind natürlich auch mögliche Handelsgelegenheiten.
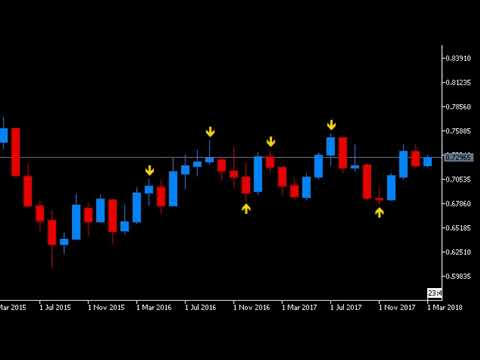
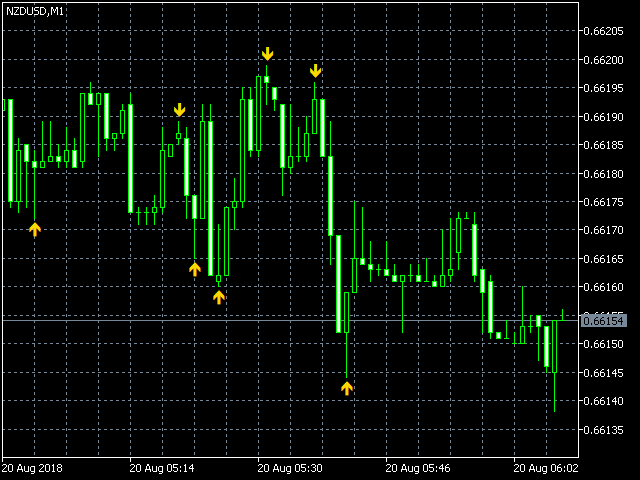
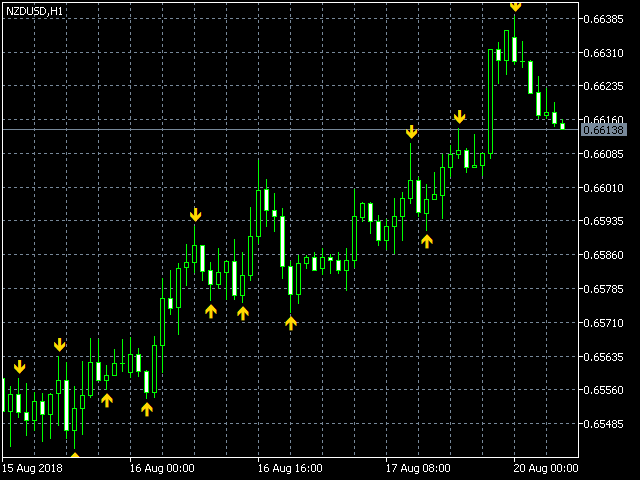
Es werden zwei spezifische Pivot-Signale angezeigt. Ein Pivot-Tief und ein Pivot-Hoch. Beide werden mit einem gelben Pfeil angezeigt. Das Pivot-Tief wird auf der Kerze ausgelöst, wenn die Kerzen oder Balken auf beiden Seiten ein höheres Hoch und ein höheres Tief aufweisen als die Kerze in der Mitte. Das Pivot-Hoch wird auf der Kerze ausgelöst, wenn die Kerzen oder Balken auf beiden Seiten ein niedrigeres Hoch und ein niedrigeres Tief aufweisen. Diese einfachen Phasen des Kursgeschehens signalisieren dann potenzielle Umkehrungen sowie Pausen, in denen sich ein Stau bildet, und die Entwicklung längerfristiger Trends.
In Stau-Phasen markieren die Pivots dynamisch die Hochs und Tiefs der Phase. In der Trendphase wiederum markieren sie die obere und untere Trendlinie, während sich die Preisbewegung entwickelt.
Aus diesem Grund bezeichnen wir den Indikator als "Schweizer Taschenmesser". Einfach und elegant, aber dennoch leistungsstark und funktionell mit vielen Einsatzmöglichkeiten! In Verbindung mit dem Quantum Dynamic Support & Resistance Indikator können Sie diese wichtigen Wendepunkte dynamisch ausnutzen.
Holen Sie sich Ihren Indikator noch heute und nehmen Sie sich die harte Arbeit des Price Action Trading!