Quantum Currency Heatmap Indicator for MT5
- Indikatoren
- Version: 2.0
- Aktualisiert: 6 Januar 2025
- Aktivierungen: 5

Der Handel an den Devisenmärkten ist ein komplexes Geschäft, nicht zuletzt deshalb, weil wir es mit Währungspaaren zu tun haben und damit auch mit Paaren von Volkswirtschaften. Alle Volkswirtschaften der Welt sind miteinander verbunden, was sich in der ständigen Ebbe und Flut der Währungsstärke und -schwäche widerspiegelt. Das Problem für uns als Händler besteht darin, so viele Paare gleichzeitig zu beobachten, da sich jedes Paar nicht unabhängig voneinander bewegt, sondern die Verflechtung dieses Marktes widerspiegelt.
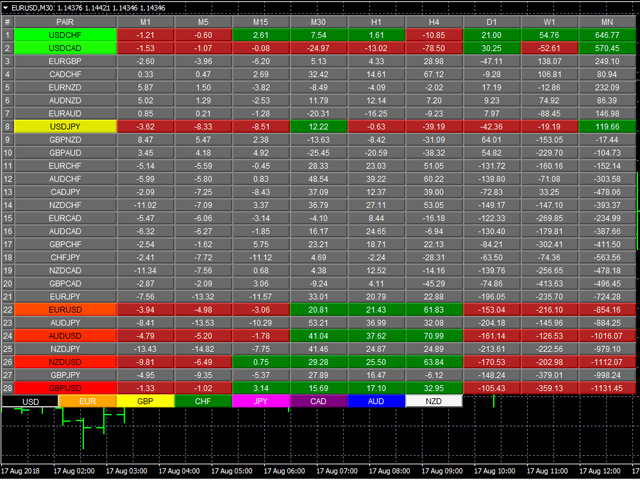
Die Quantum Currency Heatmap liefert Ihnen die Informationen, die Sie benötigen, um Ihre Handelsentscheidungen auf die Daten eines ganzen Spektrums von Währungspaaren zu stützen, die von den 8 wichtigsten Währungen abgeleitet sind. Nämlich USD, EUR, GBP, CHF, JPY, CAD, AUD und schließlich NZD. In einer übersichtlichen, einfachen und intuitiven Tabelle sehen Sie sofort das gesamte Gewicht der Marktstimmung über alle 28 Paare und über alle Zeitrahmen hinweg.
Ein globaler Überblick über Risiko und Stimmung in einem Diagramm in zwei Dimensionen! Vertikal in der Ranking-Tabelle und dann horizontal über den Zeithorizont. Sofort, einfach und leistungsstark.
Keine mehreren Monitore, keine mehreren PCs, keine überfüllten Bildschirme, kein Hin- und Herlaufen von einem Zeitrahmen zum anderen und wieder zurück. Alles ist da und ermöglicht es Ihnen, in Sekundenschnelle Entscheidungen zu treffen.
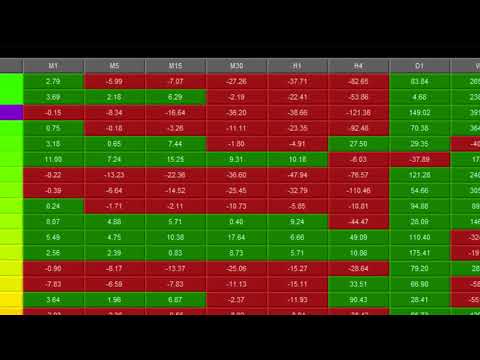
Die Quantum Currency Heatmap zeigt sofort die "heißesten" und "kältesten" Bereiche der Devisenlandschaft an. Vertikal sind 28 Währungspaare aufgelistet, die vom bullischsten Paar (oben) zum bearischsten Paar (unten) geordnet sind und die Daten aus der Quantum Currency Matrix beziehen. Und hier wird es interessant: Horizontal werden die Performance-Scores der einzelnen Währungspaare in 9 Zeitrahmen angezeigt: 1 Minute, 5 Minuten, 15 Minuten, 30 Minuten, stündlich, 4 Stunden, täglich, wöchentlich und monatlich.
Jede Zelle der Quantum Currency Heatmap ist farbkodiert, was eine sofortige Interpretation mit nur einem Blick ermöglicht, ähnlich wie bei einem hochentwickelten Wärmebildscanner, aber für den Forex-Bereich. Wenn Sie sich den Indikator ansehen, werden Sie sehen, wie einfach und intuitiv das Layout ist, aber lassen Sie uns das hier näher erläutern.
Beginnen wir mit den Performance-Scores. Dies ist der Wert, den der Indikator jedem Währungspaar zuweist und der angibt, wie positiv oder negativ sich sein Kurs in einem bestimmten Zeitraum entwickelt hat. Je nach Wert kann er eine der beiden Farben annehmen, und dies ist die Farbkodierung, die bei der Betrachtung der Währungspaare ÜBER den Zeithorizont - die Horizontale!
- Grün - wenn der Leistungswert des Währungspaares positiv ist.
- Rot - wenn der Performance-Wert des Währungspaares negativ ist.
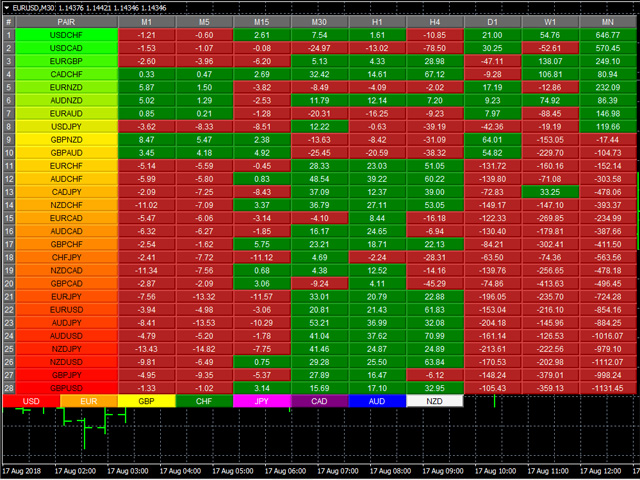
Die Paare werden dann jedoch VERTIKAL mit einem dynamisch abgestuften Farbcode eingestuft, der in dieser Reihenfolge von grün über gelb zu rot wechselt. Die Performance-Scores der Währungspaare in 9 Zeitrahmen werden addiert. Die Währungspaare werden dann nach ihrer Summe vom positivsten bis zum negativsten Wert geordnet und wie folgt farblich kodiert:
- Grüne Farbtöne - die Summe der Performance-Werte des Währungspaares in 9 Zeitrahmen liegt, entsprechend gewichtet, deutlich über dem Drehpunkt von Null.
- Gelbe Farbtöne - die Summe der Performance-Werte des Währungspaares in 9 Zeitrahmen, die entsprechend gewichtet sind, ist relativ flach und liegt um den Drehpunkt von 0. Sie kann entweder positiv oder negativ sein, folgt aber den Zahlen, die am nächsten an 0 liegen.
- Rote Farbtöne - die Summe der Performance-Werte des Währungspaares in 9 Zeitrahmen, die entsprechend gewichtet sind, liegt deutlich unter dem Drehpunkt von 0.
Die Abstufung der Farben ist dynamisch. Daher hängt der Übergang der Farben vollständig von der Summe der Performance-Werte des Währungspaares in den 9 Zeitrahmen ab, wie oben erläutert. Wie alle unsere anderen Indikatoren ist auch dieser dynamisch und ändert sich ständig in Echtzeit, um die Ebbe und Flut der Stimmung in den Zeitrahmen widerzuspiegeln.
Der Indikator wendet eine Gewichtung in der Rangliste an, um die Tatsache widerzuspiegeln, dass ein Trend in einem langsameren Zeitrahmen eine größere Bedeutung hat als ein Trend in einem schnelleren Zeitrahmen.
Die wechselnden Farben liefern eine Heatmap, die die relative Performance der 28 Währungspaare über ALLE Zeitrahmen in Echtzeit widerspiegelt. Dies ermöglicht eine horizontale Analyse der Währungspaare im Zeitverlauf. Dies ist immens leistungsfähig und ermöglicht es Ihnen als Händler, klare, logische und schnelle Entscheidungen zu treffen. Die Heatmap macht die komplexe Welt des Forex einfach und klar. Ein Arbeitsbereich, der Informationen aus 252 Charts liefert!