Quantum Trend Monitor Indicator for MT5
- Indikatoren
- Version: 2.1
- Aktualisiert: 13 Januar 2025
- Aktivierungen: 5

Währungspaare steigen oder fallen nie in einer geraden Linie. Sie steigen und fallen ständig und verursachen Pullbacks und Umkehrungen. Und mit jedem Anstieg und Fall steigen und fallen auch Ihre Emotionen. Erst hoffen, dann fürchten, dann wieder hoffen - das ist der Moment, in dem der Markt versuchen wird, Sie aus einer starken Position heraus zu verscheuchen. Das ist der Zeitpunkt, an dem Sie am verwundbarsten sind.
Aber nicht, wenn Sie den Quantum Trend Monitor haben. Und hier bekommen Sie sogar zwei Indikatoren zum Preis von einem!
Der Quantum Trend Monitor wurde entwickelt, um diese vorübergehenden Pausen und Rücksetzer aufzufangen. Er analysiert das Kursgeschehen und wechselt nur dann zu einer Übergangsfarbe von dunkelrot oder dunkelblau, wenn der Trend ein vorübergehendes Zeichen von Schwäche zeigt. Handelt es sich um einen echten Trendwechsel, wechselt der Indikator zu einer hellen Farbe, wenn sich der neue Trend entwickelt.
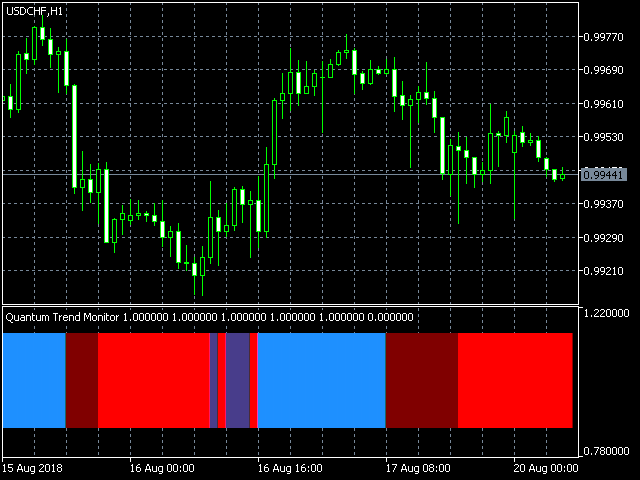
Mit anderen Worten, der Quantum Trend Monitor tut genau das. Er überwacht die Stärke des Trends. Diese wird als durchgehender horizontaler Balken am unteren Rand des Bildschirms angezeigt. Der Trendmonitor arbeitet mit dem Quantum Trends-Indikator zusammen und hilft Ihnen dabei, im Trend zu bleiben - raten Sie mal - im Trend! Das ist eine der schwierigsten Aufgaben im Handel. Aber mit dem Quantum Trend Monitor ist es ein Kinderspiel. Wir nennen ihn "den Gewinngenerator", denn genau das ist er auch. Er hilft Ihnen, jede Position über einen längeren Zeitraum zu halten und so Ihre Gewinne zu maximieren. Sie müssen nicht mehr vorzeitig aussteigen und den Handel bedauern. Keine emotionalen Handelsentscheidungen mehr. Beobachten Sie einfach Ihren Quantum Trend Monitor, der..... überwacht ihn für Sie!
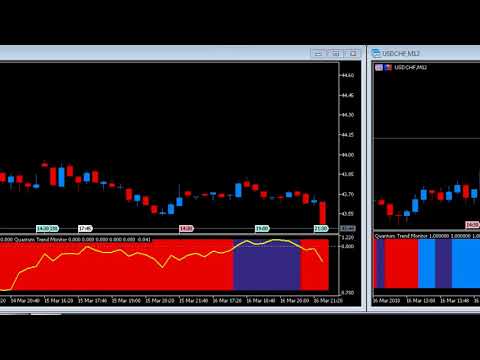
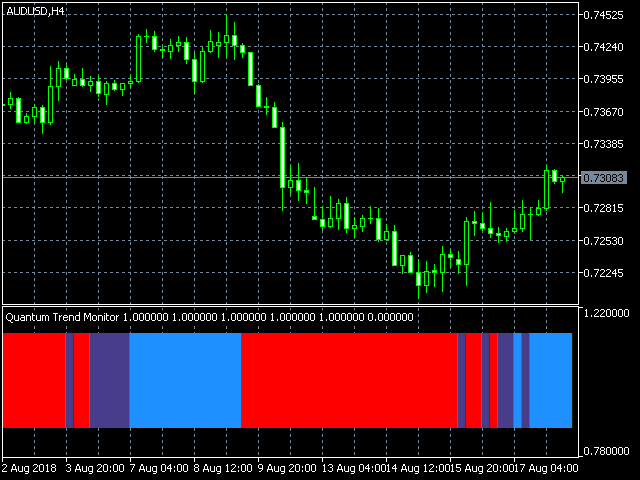
Der Quantum Trend Monitor zeigt vier Farben am unteren Rand des Bildschirms in Form eines durchgehenden Balkens an:
- Hellblau - stark bullischer Trend
- Helles Rot - starker Abwärtstrend
- Dunkelblau - Schwäche im Trend
- Dunkelrot - Schwäche im Trend
Wenn der Trend stark ist, wechselt der Quantum Trend Monitor entweder zu einem hellen Blau oder zu einem hellen Rot und unterstützt so den Trend-Indikator, während sich der Trend entwickelt.
In Verbindung mit einem Ansatz mit mehreren Zeitrahmen ist dies der Indikator, der den Trend wirklich zu Ihrem Freund" macht. Jetzt können Sie die Trends in mehreren Zeitrahmen in Echtzeit überwachen, das Risiko reduzieren, die Rendite verbessern und Ihre Gesamtrentabilität steigern.
Die Quantum Trends erzeugen das Signal, sein Schwesterindikator, der Quantum Trend Monitor, schaltet sich dann ein. Zusammen bieten Ihnen diese beiden Indikatoren die perfekten Werkzeuge für das Management Ihrer Position. Keine Angst mehr, keine Zweifel, keine Unsicherheit. Beobachten Sie, wie Ihr Handelskonto wächst, während Sie Ihre Gewinne laufen lassen - mit Vertrauen!
Und raten Sie mal - damit ist es noch nicht getan.
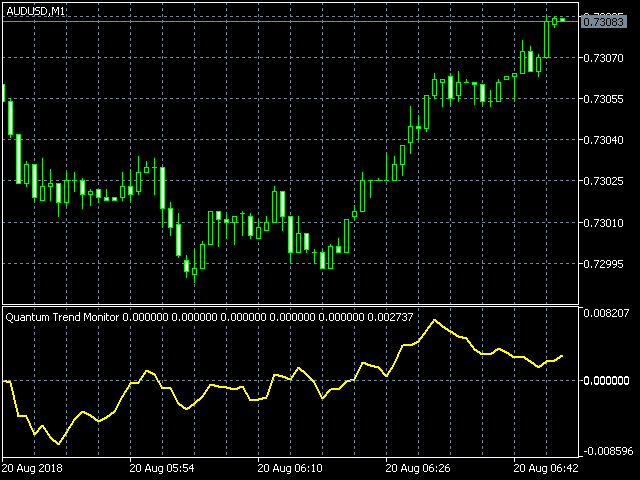
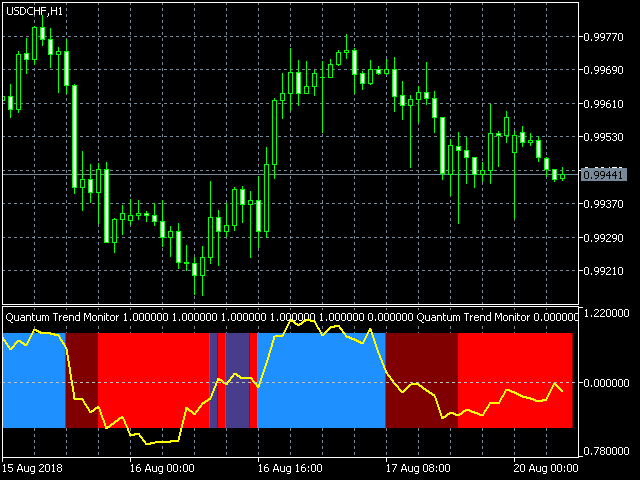
Erinnern Sie sich daran, dass wir sagten, Sie bekommen hier zwei Indikatoren zum Preis von einem! Nun, um Ihnen noch mehr zu helfen, kommt der Quantum Trend Monitor mit seiner eigenen einzigartigen Trendlinie, die Ihnen einen weiteren Hinweis auf den Trend gibt. Der Klarheit und Einfachheit halber wird dieser Indikator über den Quantum Trend Monitor gelegt und erscheint als gelbe Linie. Das Liniendiagramm zeigt die Dynamik des Trends an und funktioniert wie folgt:
- Wenn die gelbe Trendlinie über der Nulllinie liegt, ist ein Aufwärtstrend vorhanden.
- Befindet sich die gelbe Trendlinie unterhalb der Nulllinie, liegt ein Abwärtstrend vor.
- Wenn die gelbe Trendlinie die Nulllinie kreuzt, hat sich der Trend umgekehrt.
- Je weiter sich die gelbe Trendlinie von der Nulllinie entfernt, desto stärker und dynamischer ist der Trend
Wie ein altes Sprichwort sagt - zwei Köpfe sind besser als einer. Hier könnten wir sagen - zwei Indikatoren sind besser als einer! Mit dem Quantum Trend Monitor und der gelben Trendlinie haben Sie nun ein vollständiges Bild des Trends. Es war noch nie so einfach, im Trend zu bleiben und Ihre Gewinne zu maximieren.
Mit dem Quantum Trend Monitor haben Sie die Kontrolle. Genau wie bei der Lautstärkeregelung Ihres Radios können Sie die Empfindlichkeit des Indikators an Ihren Handelsstil anpassen. Wenn Sie die Empfindlichkeit etwas höher einstellen, werden Sie früher auf Engpässe aufmerksam gemacht - wichtig, wenn Sie nur scalping handeln. Wenn Sie die Empfindlichkeit ein wenig herunterdrehen, werden diese Phasen geglättet und Sie bleiben in den längerfristigen Trends, um maximale Gewinne zu erzielen.
Der Zwei-Indikator funktioniert in allen Zeitfenstern.
Einsteigen ist leicht - drinbleiben ist schwer. Mit dem Quantum Trend Monitor und der dazugehörigen gelben Trendlinie wird auch das Dranbleiben einfach!