Quantum Volume Point of Control Indicator
- Indicadores
- Versión: 5.0
- Actualizado: 6 enero 2025
- Activaciones: 5

El indicador Quantum VPOC se ha desarrollado para ampliar el estudio bidimensional del volumen y el precio a uno tridimensional que abarca el tiempo. La relación volumen/precio/tiempo proporciona entonces una visión real del funcionamiento interno del mercado y el latido del sentimiento y el riesgo que impulsa la acción del precio en consecuencia.
El indicador Quantum VPOC muestra la siguiente información clave en el gráfico:
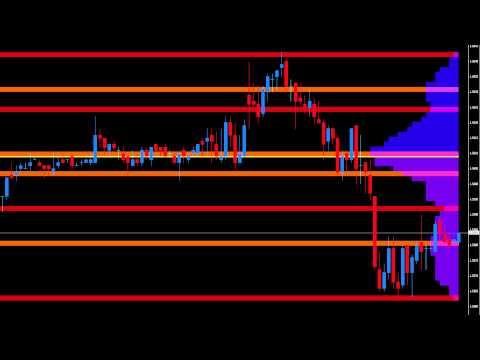
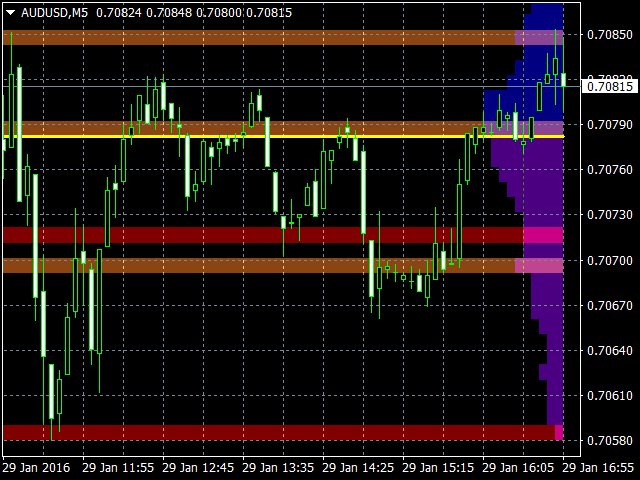
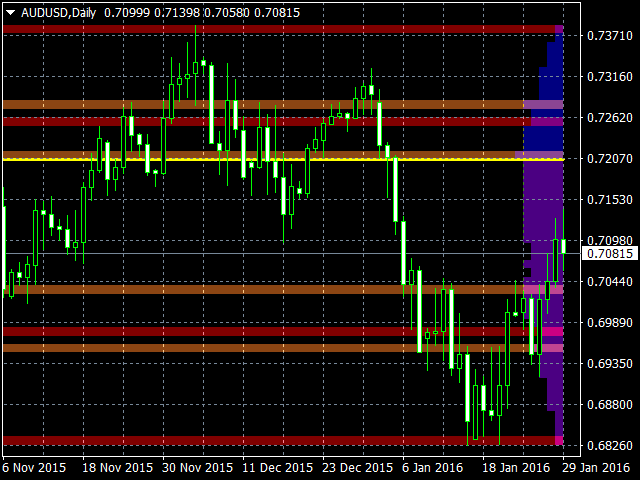
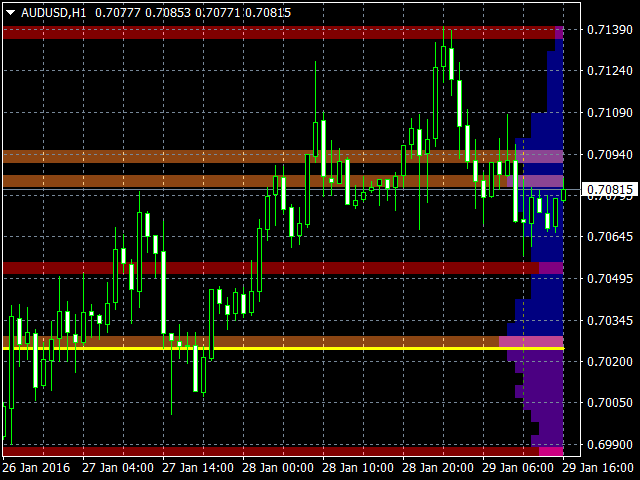
- Perfil de volumen: aparece como un histograma de volumen en el eje vertical de precios, a la derecha del gráfico. Los máximos y mínimos se muestran claramente resaltando los nodos de Volumen Alto y Bajo.
- Nodo de volumen alto (HVN): aquí es donde tenemos una protuberancia en el perfil de volumen generalmente como resultado de una fase prolongada de congestión de precios. Como resultado, a medida que el mercado se acerca a estas regiones en el gráfico, es probable que la acción del precio se encharque con una mayor congestión y que el nodo actúe como una fuerte zona de soporte o resistencia. Como hemos visto una fuerte aceptación del precio en este nivel en el pasado, es probable que esto se repita con el mercado oscilando en un rango. En última instancia, el mercado podría retroceder desde estos niveles, y cualquier movimiento a través de ellos confirmaría el sentimiento actual.
- Nodo de bajo volumen (LVN) - Aquí es donde vemos bajo volumen en el perfil de volumen. En estas regiones, el mercado sólo se ha detenido temporalmente, en otras palabras, una región donde el precio ha sido rechazado en el pasado. Como tal, es probable que veamos al mercado moverse rápidamente a través de estas regiones con poca resistencia o soporte que actúe para evitar un mayor avance de la caída del precio. Es probable que el sentimiento actual continúe y se consolide rápidamente a través de estos niveles.
- Zonas de soporte y resistencia: se dibujan en los nodos de volumen alto y bajo para resaltar los distintos niveles HVN y LVN en el eje de precios.
- Línea de Punto de Control de Volumen - se dibuja como una línea única en el volumen más alto del Nodo de Volumen Alto en el marco temporal y define claramente el punto de inflexión del sentimiento. Se mueve dinámicamente y representa el punto de inflexión del sentimiento del mercado. Si está por encima de la acción del precio, entonces el sentimiento actual del mercado es bajista. Si está por debajo de la acción del precio actual, entonces el sentimiento actual del mercado es alcista. La línea VPOC revela este equilibrio de forma sencilla, rápida y clara, lo que le permite juzgar el sentimiento del mercado con precisión y confianza.
El indicador Quantum VPOC tiene varias características únicas, todas ellas diseñadas para ayudarle a ver el interior del mercado y a operar con la corriente, y no contra ella.
- El indicador es dinámico, lo que significa que la salida cambia gradualmente a medida que llegan nuevos datos de volumen, por lo que puede estar seguro de que sólo recibe las señales más relevantes.
- Una característica avanzada incluye la capacidad de cambiar el marco temporal de la fuente de datos, lo que es excelente para el análisis de marcos temporales múltiples. Esto le da la opción de ver diferentes marcos temporales de forma rápida y sencilla con el VPOC asociado.
- Los dos lados del Perfil de Volumen están coloreados de forma diferente y separados por la línea del Punto de Control de Volumen para un análisis intuitivo y rápido del gráfico. El lado superior es azul por defecto y el lado inferior es morado por defecto.
- Se generan dos tipos de zonas de soporte y resistencia y se vuelven a colorear de forma diferente para mayor rapidez. Los Nodos de Alto Volumen (HVN) se colorean en un tono más claro de naranja - Los Nodos de Bajo Volumen (LVN) se colorean en un tono más oscuro de naranja.
- El número de Zonas de Soporte y Resistencia son ajustables con un determinado rango recomendado.
- Las barras del Perfil de Volumen se pueden ajustar para que sean más estrechas o más anchas.
- El Periodo (número de barras procesadas) puede ajustarse a su preferencia.
- El Perfil de Volumen, las Zonas de Soporte y Resistencia, y el Punto de Volumen de la Línea de Control pueden ser activados y desactivados de acuerdo a su propia preferencia.
- Los colores del Perfil de Volumen, de las Zonas de Soporte y Resistencia y de la Línea de Punto de Control de Volumen pueden personalizarse según sus preferencias.
El indicador Quantum VPOC es dinámico y cambia constantemente con cada tick entrante. Funciona en todos los marcos temporales y proporciona una comprensión poderosa y mucho más profunda del soporte y la resistencia a través del prisma del volumen y los Nodos de Volumen Alto y Bajo asociados, con el Punto de Control en sí, actuando como el punto de apoyo del mercado.


The VPOC is Very powerful & accurate...I mostly use it for support & resistance levels & it has never predicted any wrong level. Thanx much💪💪💪